2093
In-Vivo Quantification of Aortic Stiffness in Abdominal Aortic Aneurysm Porcine Model using Magnetic Resonance Elastography: A Comparison to Histopathology and Burst Testing1Department of Radiology, The Ohio State University Wexner Medical Center, Columbus, OH, United States, 2Department of Biomedical Engineering, The Ohio State University, Columbus, OH, United States, 3Department of Biomedical Sciences, Oregon State University, Corvallis, OR, United States, 4Center for Biostatistics, The Ohio State University, Columbus, OH, United States, 5Davis Heart & Lung Research Institute-Interventional Cardiology Cath Core Lab, The Ohio State University Wexner Medical Center, Columbus, OH, United States, 6Internal Medicine-Cardiovascular Division, The Ohio State University Wexner Medical Center, Columbus, OH, United States
Synopsis
Aortic stiffness is an important biomarker that can provide more accurate rupture potential of abdominal aortic aneurysm (AAA) than diameter. Aortic MR elastography (AMRE) is a non-invasive technique to estimate aortic stiffness and has not been validated against gold standard methods. The aim of the study is to estimate aortic stiffness in AAA-induced porcine model using in-vivo AMRE, and compare it with histopathology and burst testing. Results demonstrated that AAA stiffness was significantly higher than normal aorta (p<0.002), while %elastin and burst pressure was significantly lower in AAA (p<0.0001). Aortic stiffness showed significant negative correlation to %elastin and burst pressure.
Introduction
Abdominal aortic aneurysm (AAA) is an abnormal, irreversible and localized dilatation of the infrarenal aorta. The majority of AAAs remain undetected until rupture due to asymptomatic development. AAA rupture claims ~15000 lives annually in the United States, making it the 15th leading cause of death1. Clinically, AAAs with diameter>5.0cm are considered high-risk. However, multiple studies have observed frequent small AAA (<5.0cm) ruptures, arguing that diameter is a poor metric for assessing rupture potential2-5. AAA stiffness is a better alternative because it offers critical information regarding overall mechanical integrity and extracellular matrix (ECM) remodeling process of the AAA wall that determines the stability of an AAA independent of diameter6-8. Conventional ex-vivo mechanical testing is clinically inapplicable. On the other hand, the established pulse wave velocity (PWV)-based aortic stiffness measurements only provide a global estimation without crucial spatial information.
Aortic MR elastography (AMRE) is a novel non-invasive phase-contrast technique through which AAA stiffness can be spatially estimated by introducing external motion8-10. However, AMRE has not been validated against gold standard methods in dedicated animal models. The aim of this work is to study and validate in-vivo AMRE-derived stiffness in AAA-induced porcine model against histopathology and burst testing measurements.
Methods
AAA was induced in 11 juvenile Yorkshire pigs (~80lbs) using elastase and calcium chloride after mechanically stretching the abdominal aortic wall via an endovascular approach11-12. Data from one animal were discarded due to technical issues.
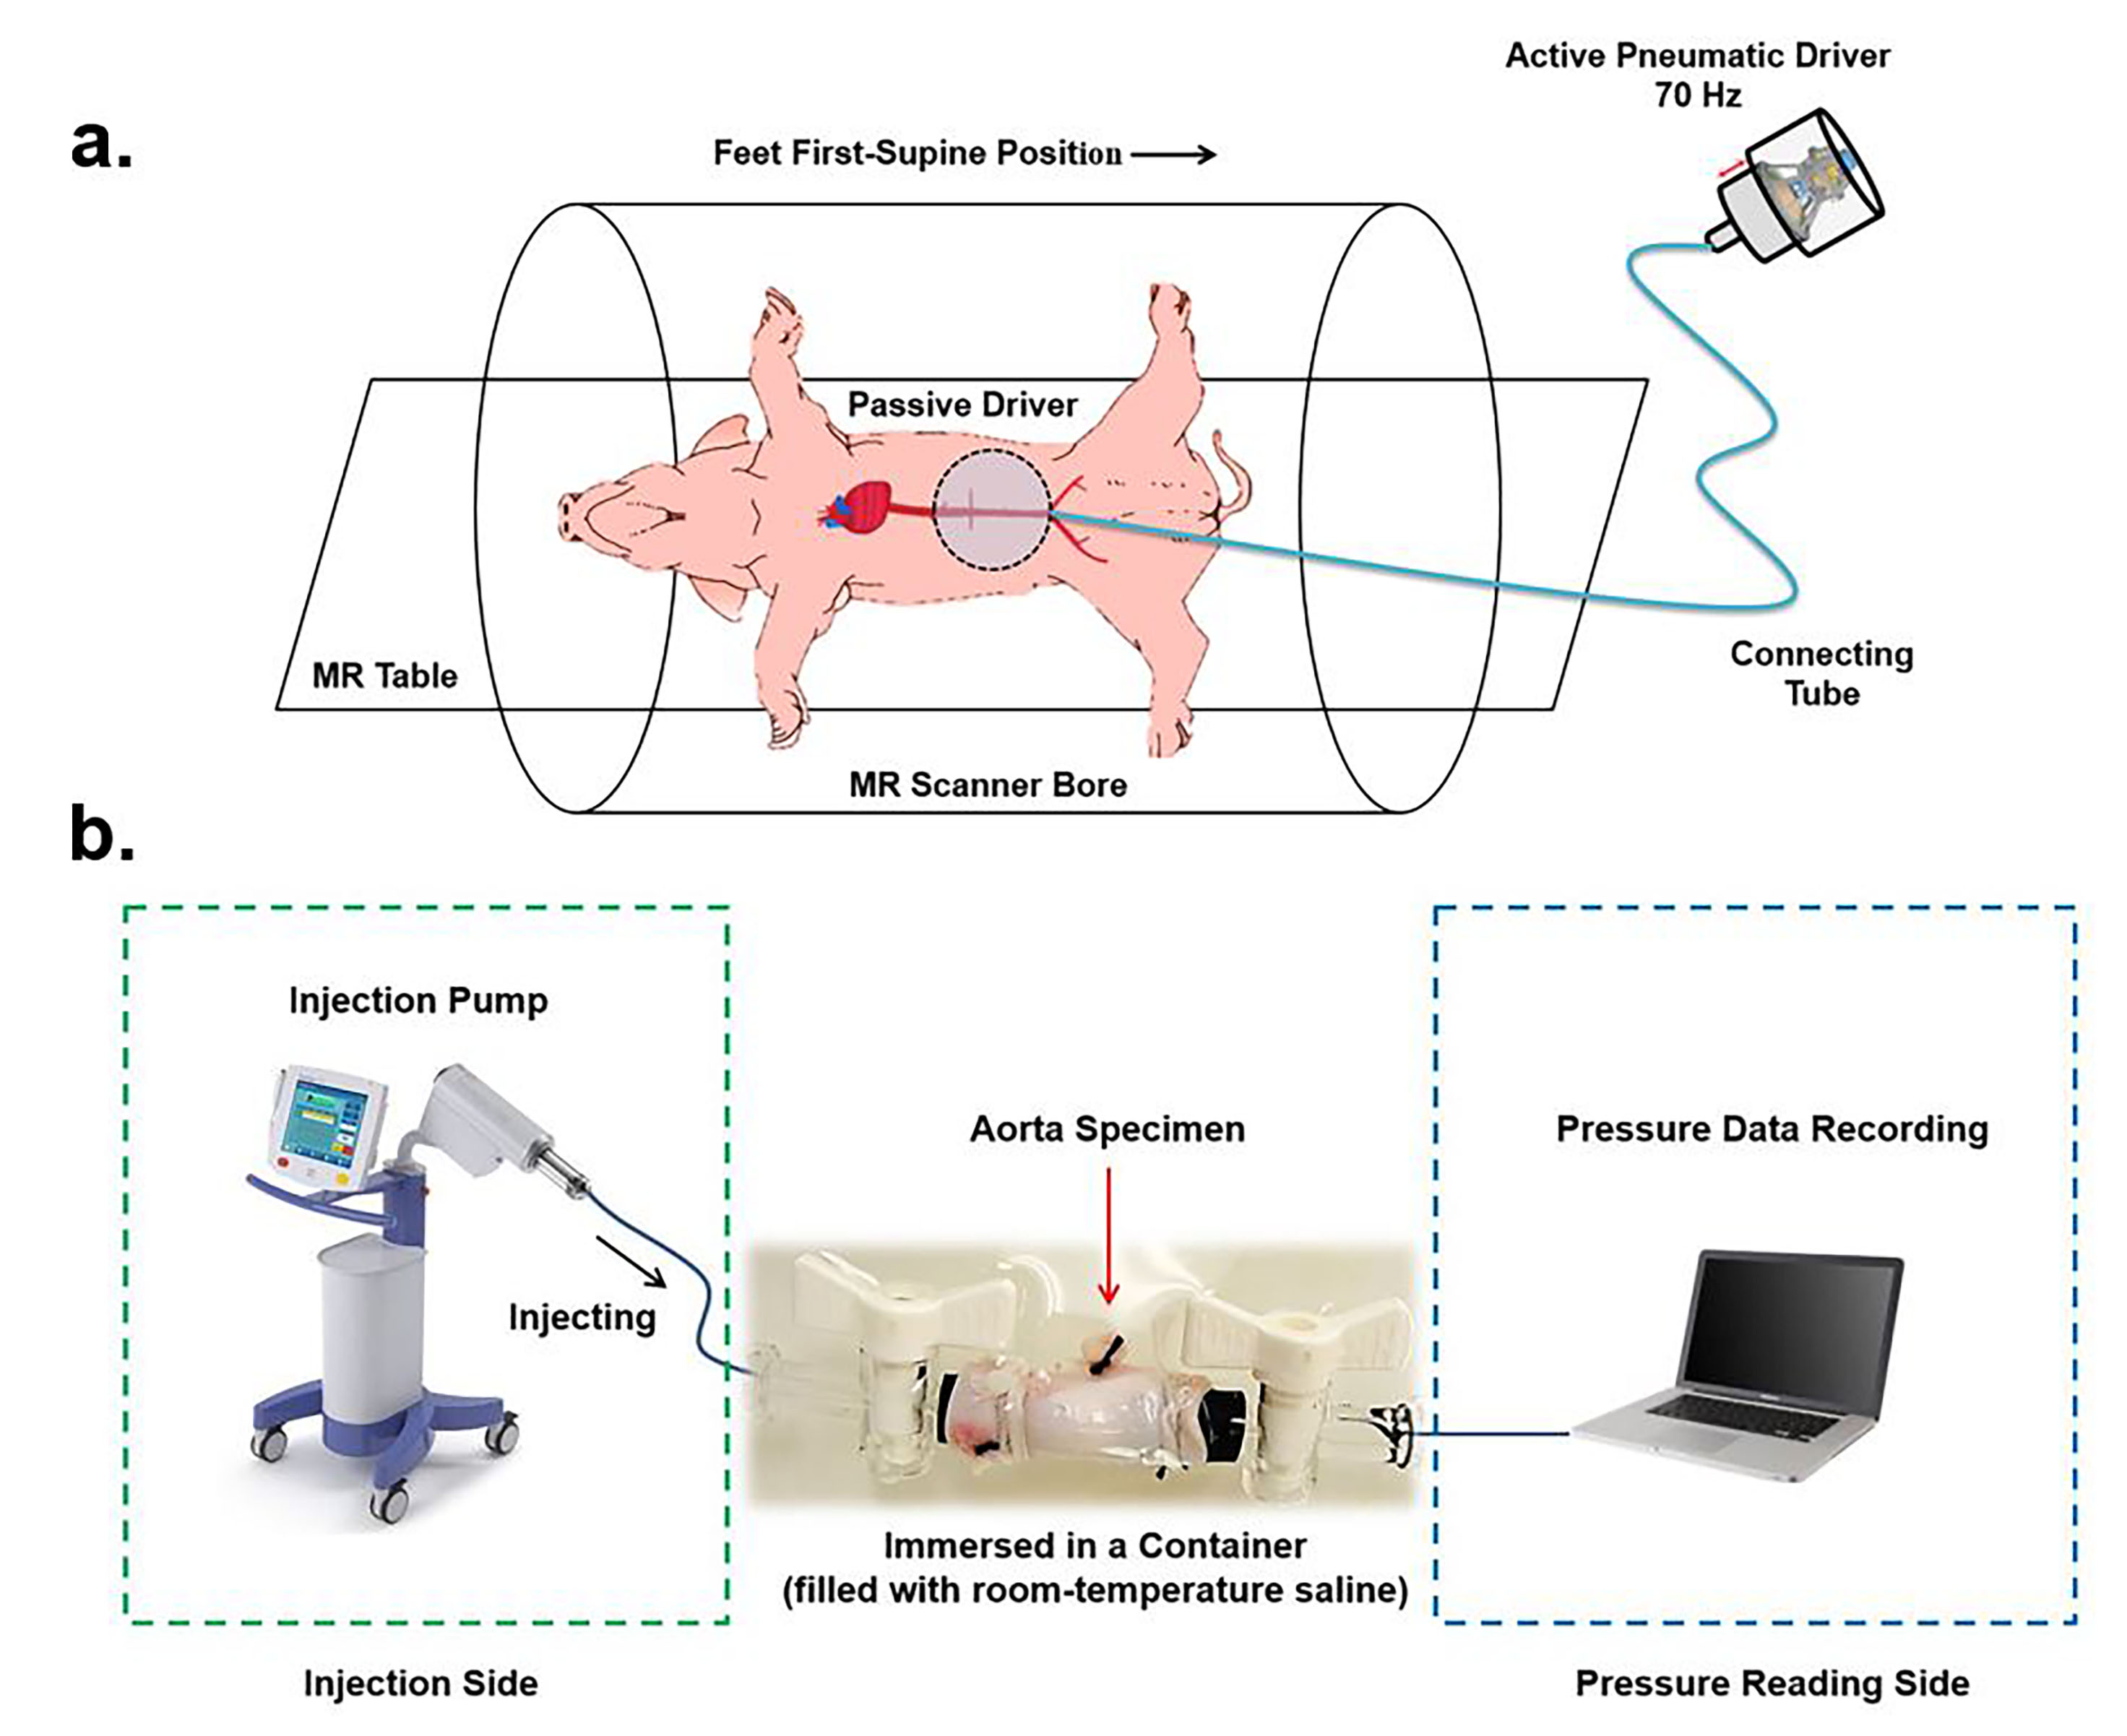
All imaging was performed in a 1.5T MR scanner (Avanto, Siemens Healthcare, Erlangen, Germany). Animals were placed feet first, supine position inside the scanner (Figure 1a). In-vivo AMRE was performed prior to AAA induction (i.e., baseline, Bx) and at 2 weeks (2W) and 4 weeks (4W) after the surgery. A retrospectively cardiac-gated GRE MRE sequence was developed to acquire the AMRE data. Imaging parameters included: TE/TR=10.77/14.29ms; FOV=400x400x6mm3; No. of slices=3; reconstruction matrix=256x256; mechanical frequency=70Hz; motion-encoding gradient frequency=120Hz; three-directional motion-encoding; 4 phase offsets. After 4W imaging was performed, the animals were euthanized and the aortic samples were collected for histopathology and burst testing.
AMRE data were processed using MRElab (Mayo Clinic, Rochester, MN). Eight 4th order Butterworth band-pass directional filters with cutoff of 1-40waves/FOV were used to eliminate the undesirable noise, longitudinal waves and wave reflections. Subsequently, 3D local-frequency estimation (LFE) inversion was performed to obtain the weighted stiffness map from all motion-encoding directions13.
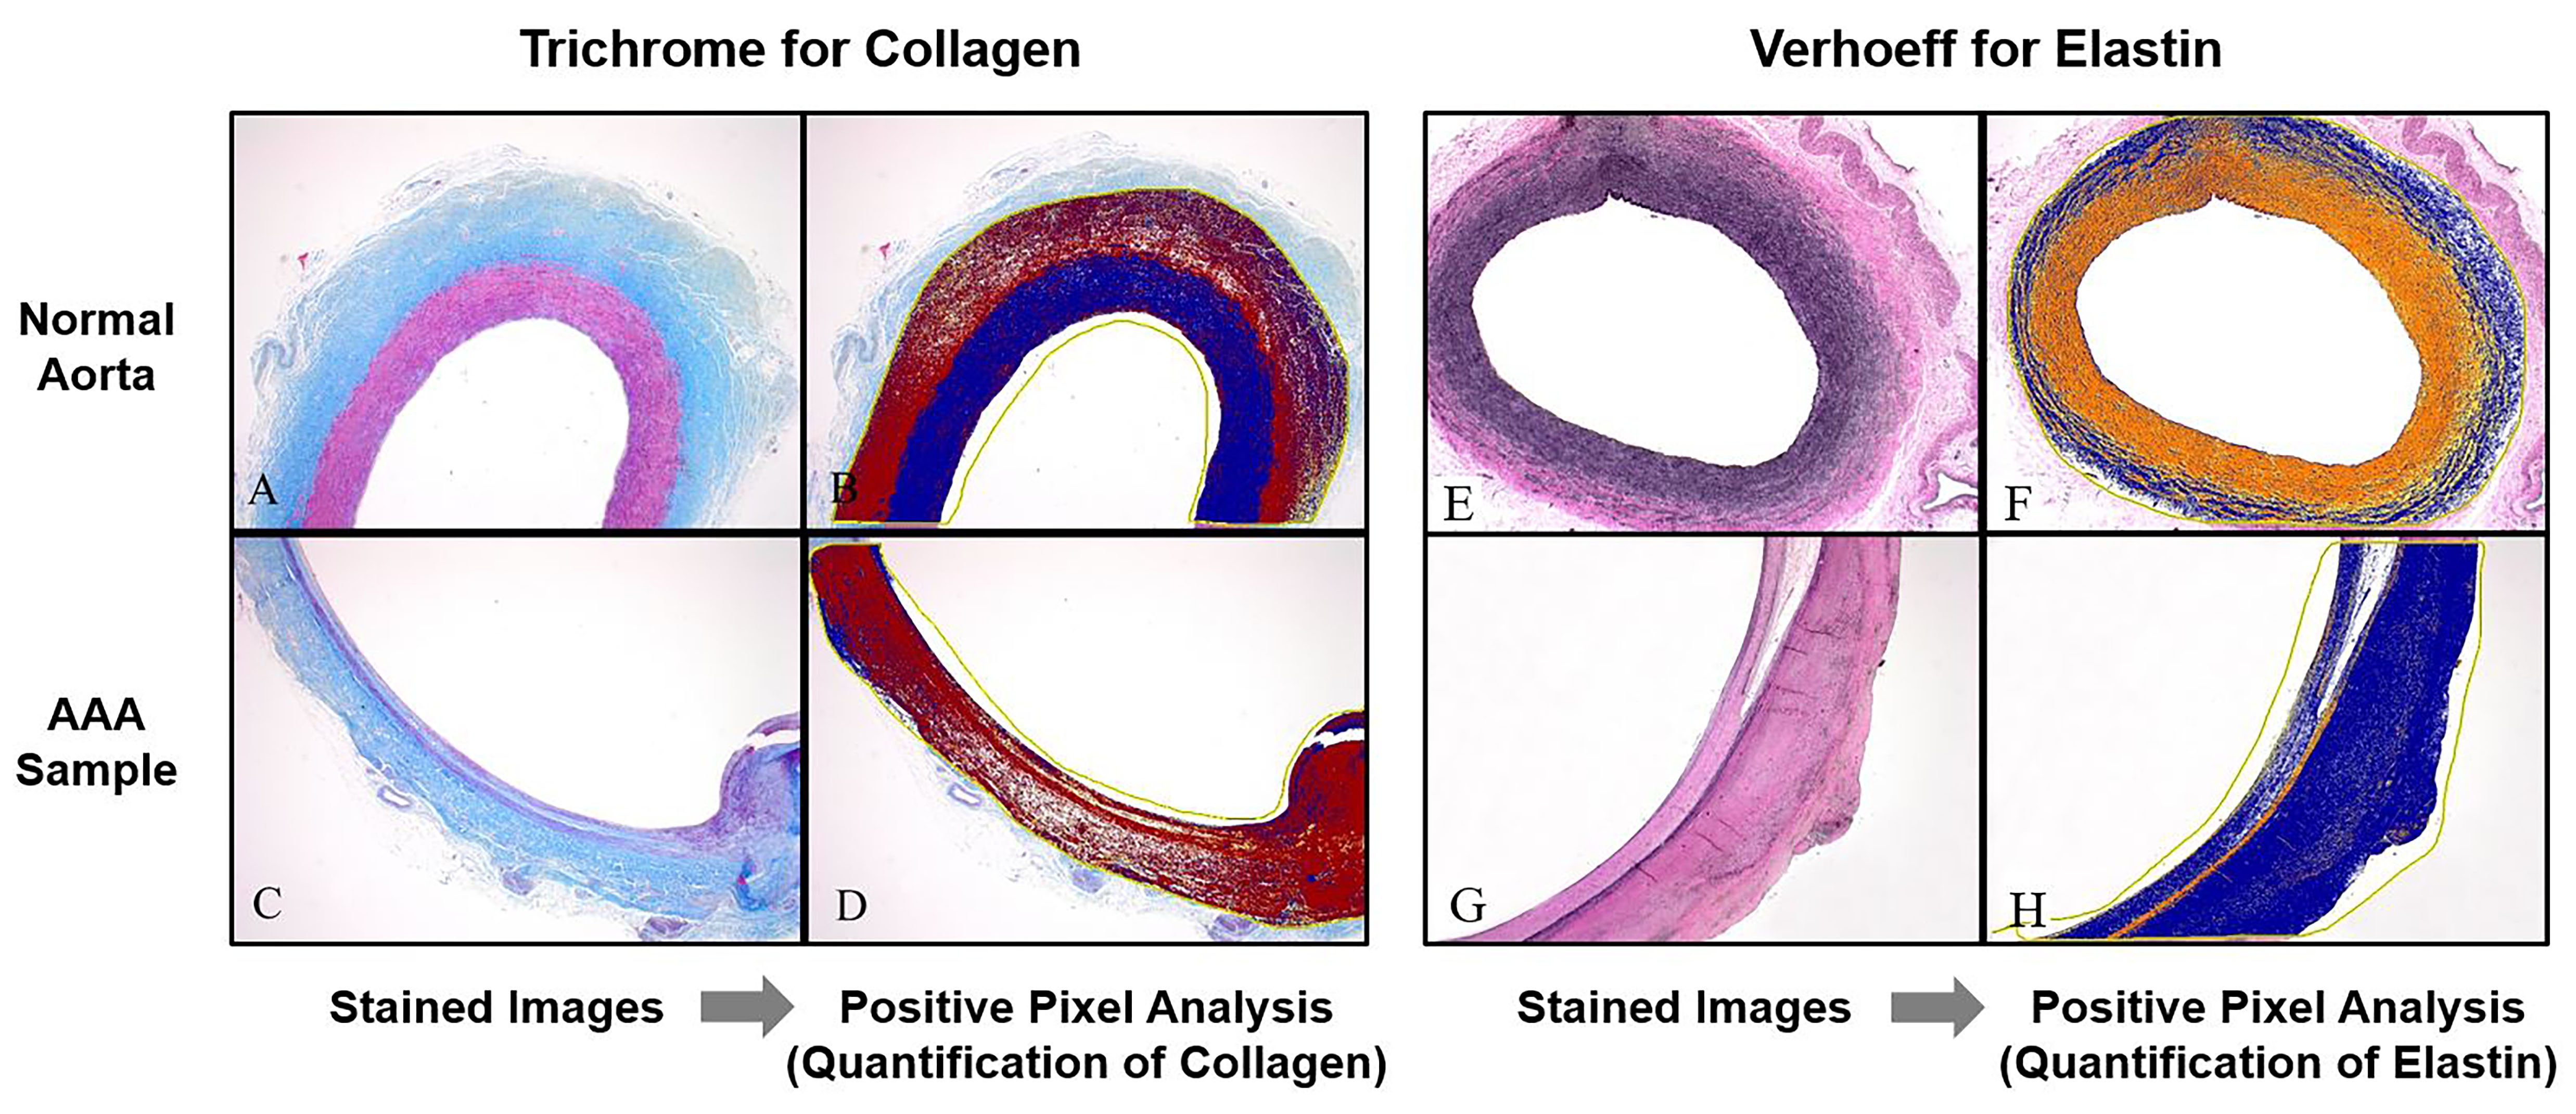
For histopathology, normal aorta and AAA samples were stained with hematoxylin and eosin, Masson’s trichrome (for collagen) and Verhoeff (for elastin). Collagen and elastin were then quantified by a board-certified veterinary anatomic pathologist (DSR) using positive pixel analysis14. During burst testing, both ends of the specimens were cannulated to a inflation system (Figure 1b). All specimens were immersed in saline solution under room-temperature. The pressure at which specimens failed to remain intact was recorded as burst pressure.
Results and Discussion
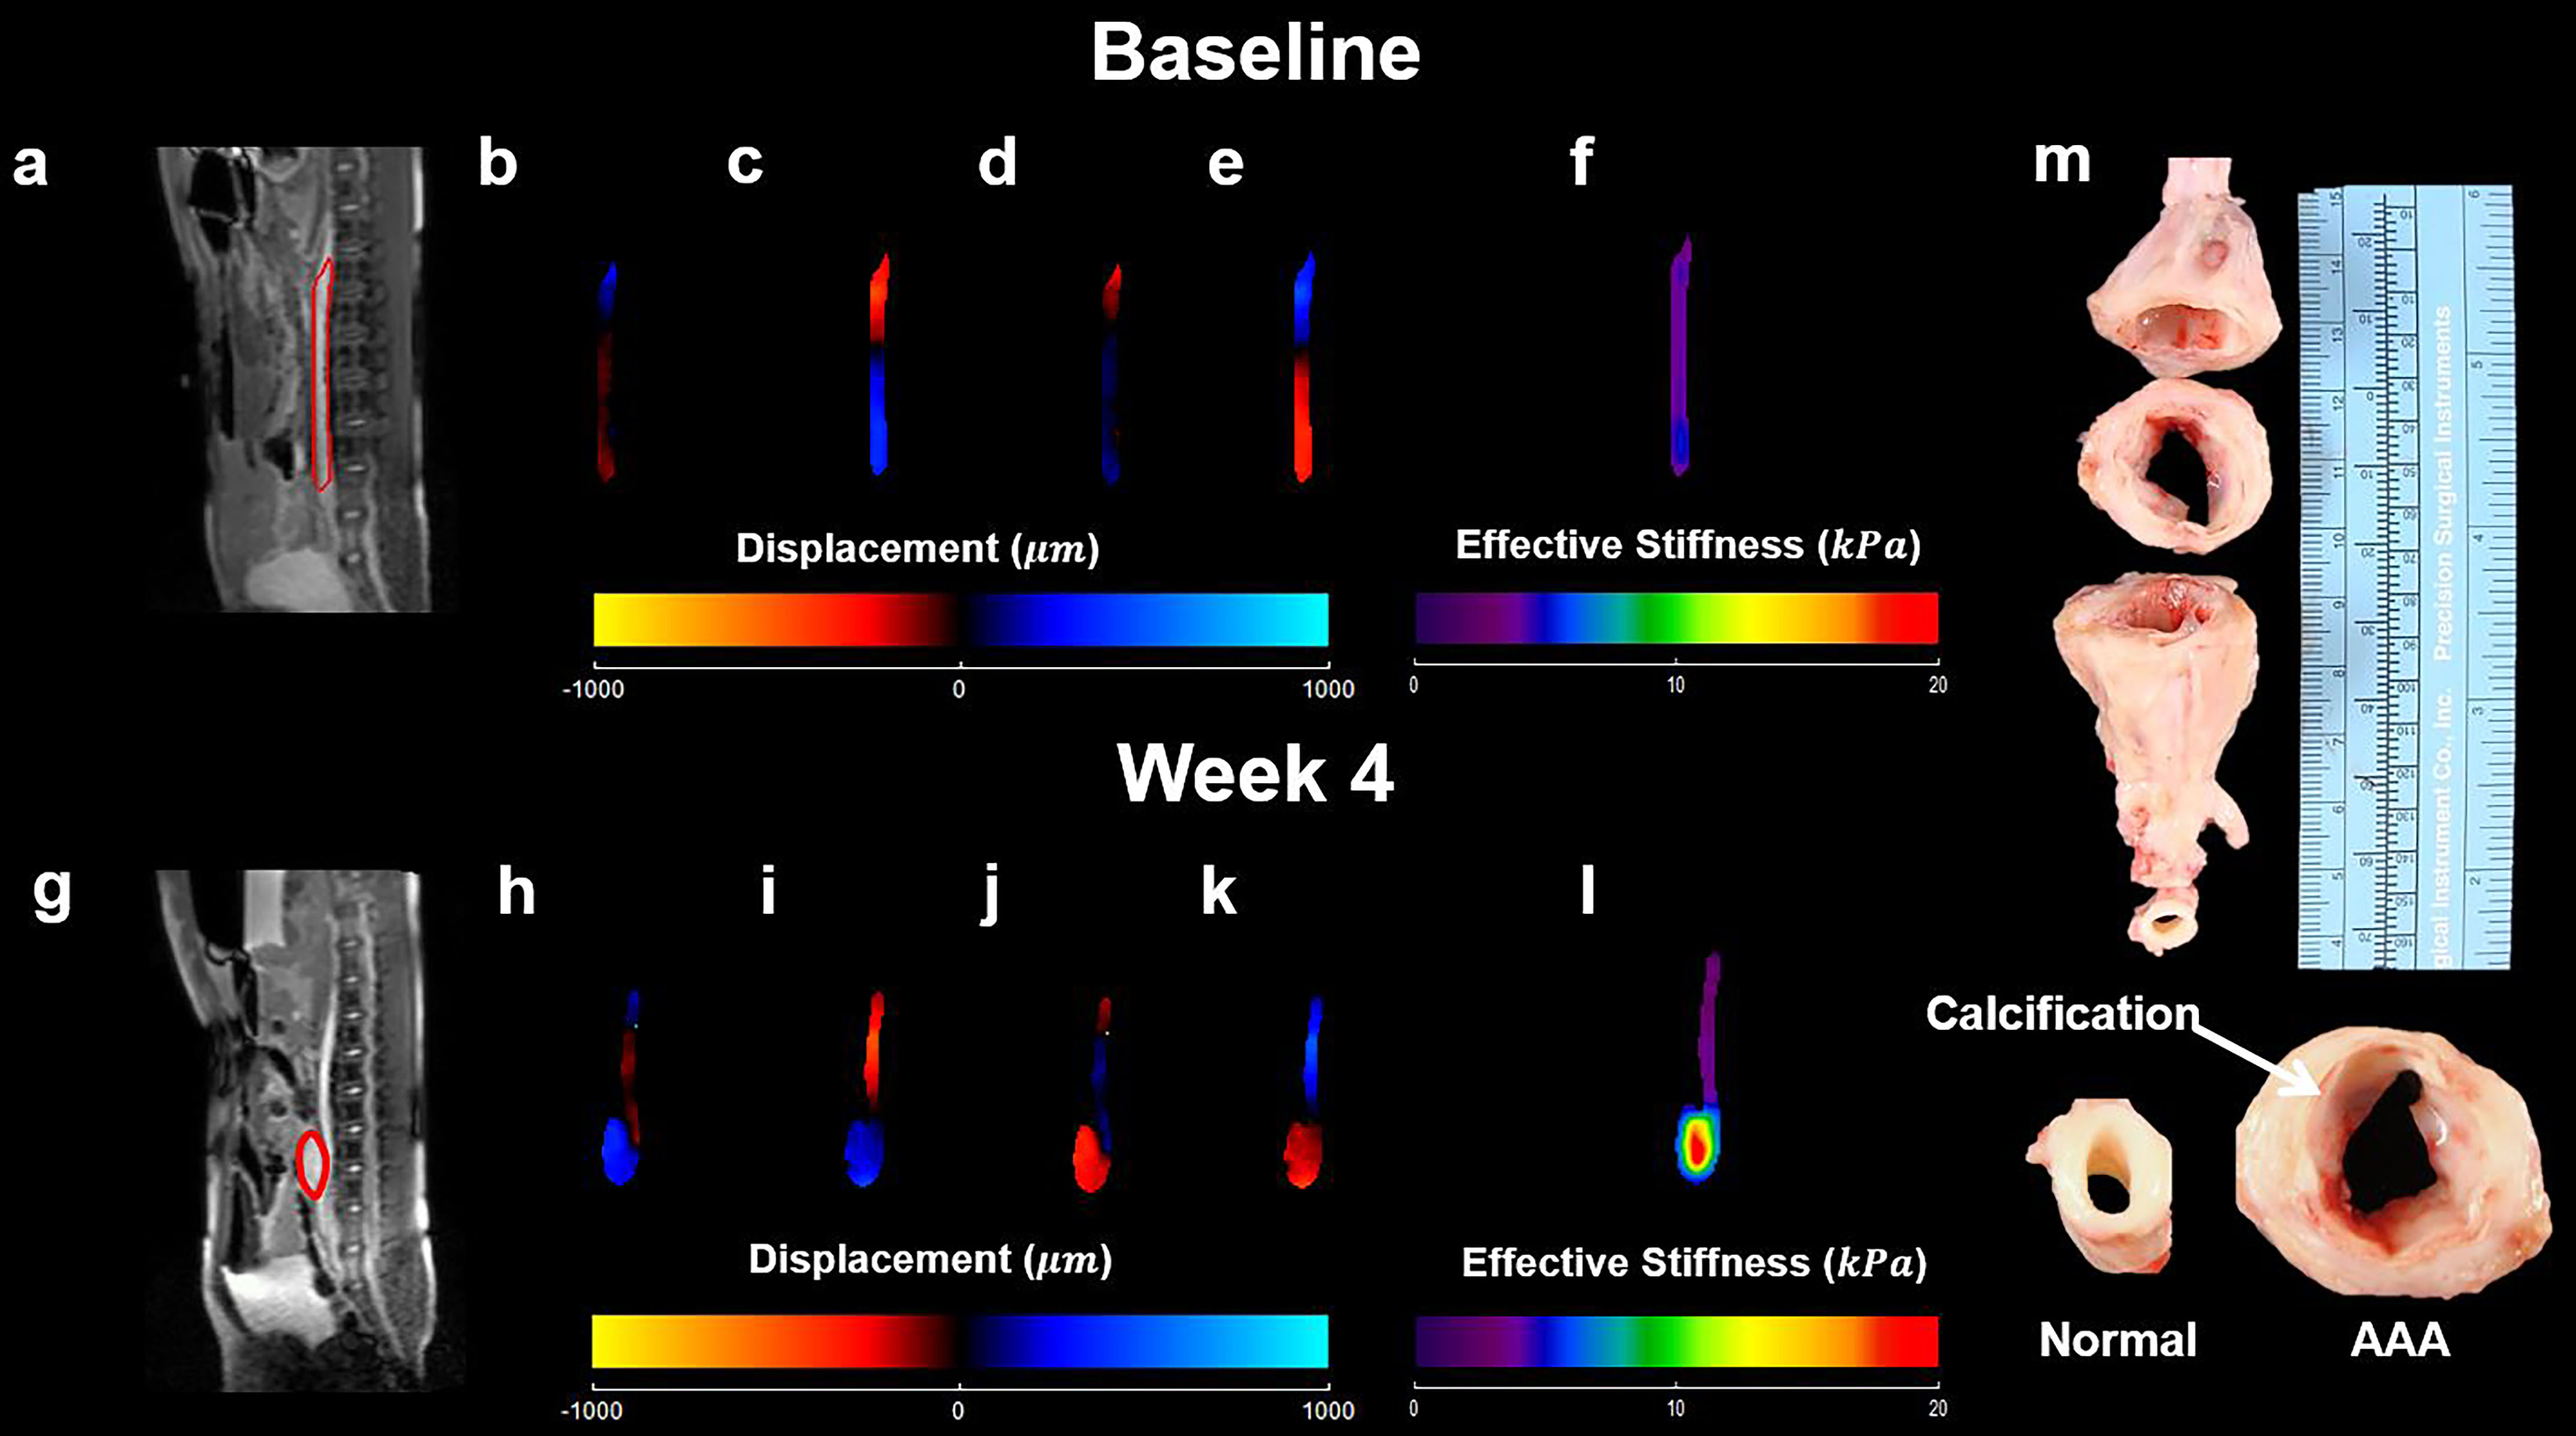
Figure 2 demonstrates the anatomic images in sagittal view, AMRE wave images and corresponding stiffness maps of the same animal at Bx and 4W. AAA development and increase in stiffness can be observed.
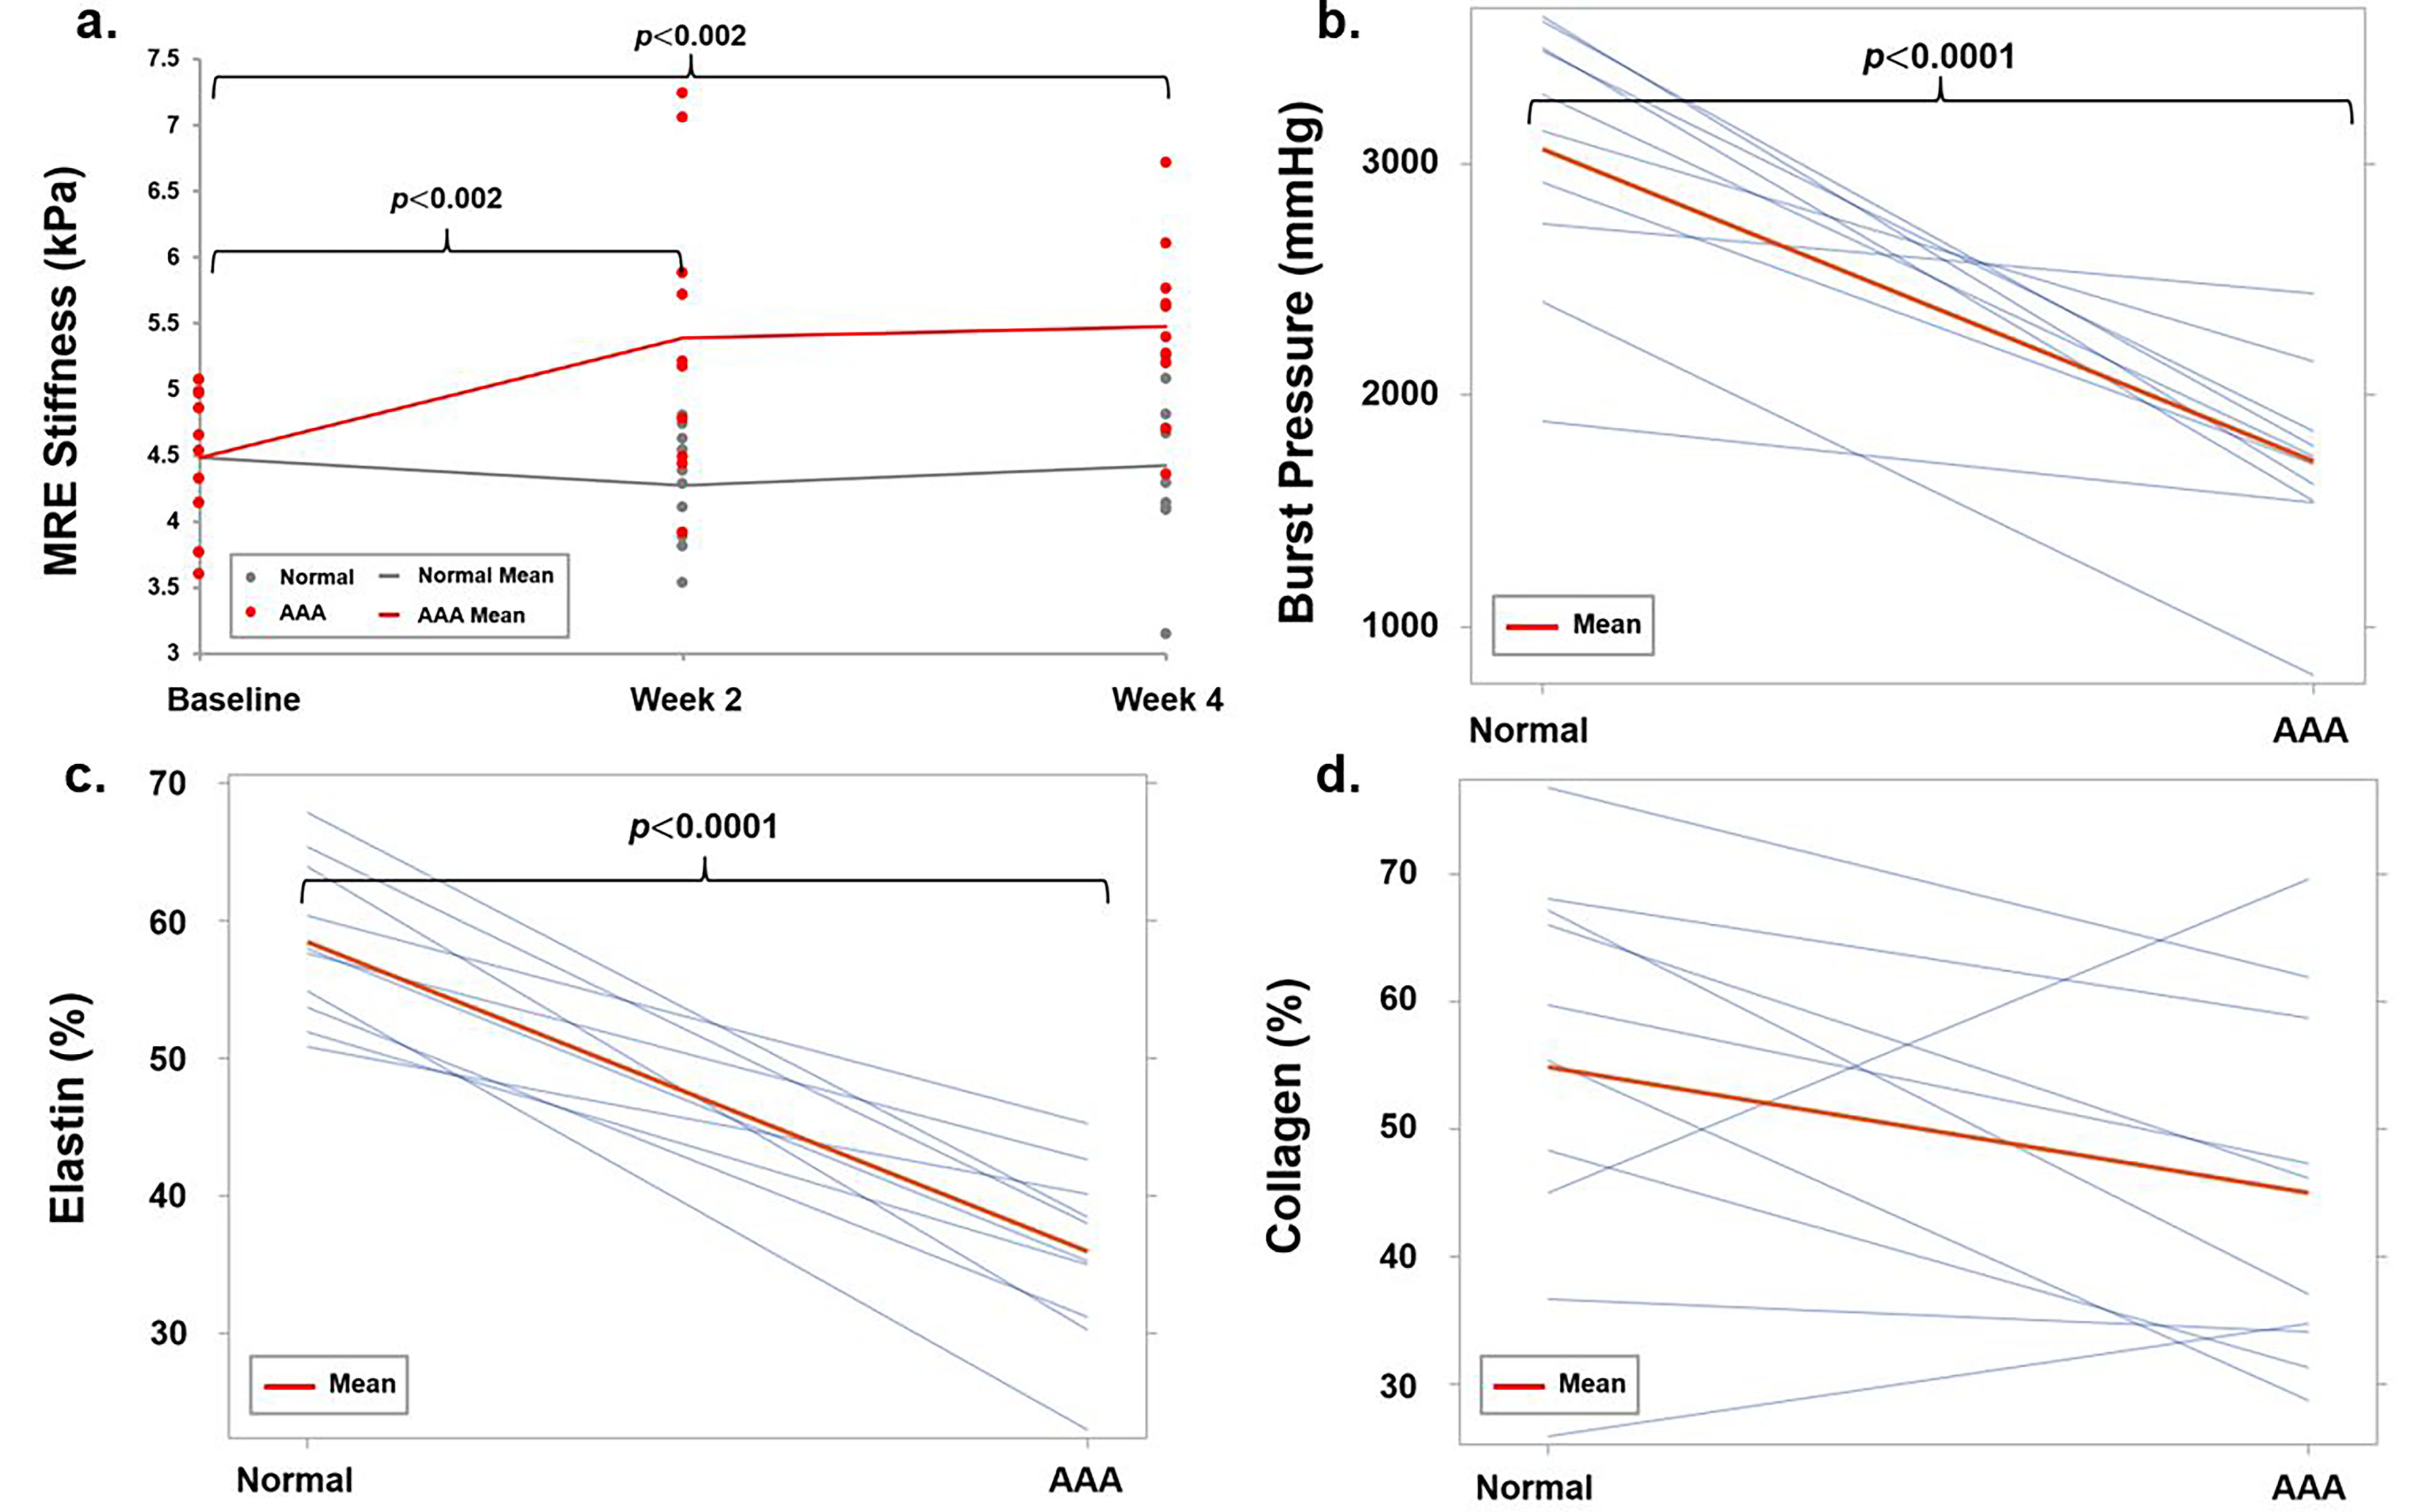
Figure 3 displays the aortic stiffness, elastin, collagen content and burst pressure of all animals. AAA stiffness at 2W and 4W were significantly higher than the normal aorta (p<0.002), while both elastin content and burst pressure was significantly lower in AAA (p<0.0001), indicating the decrease in compliance and strength of AAA wall.
Figure 4 shows the histopathology of the normal aorta and AAA samples from an animal. Diminishing of elastin and increasing of collagen in AAA was observed in the animal.
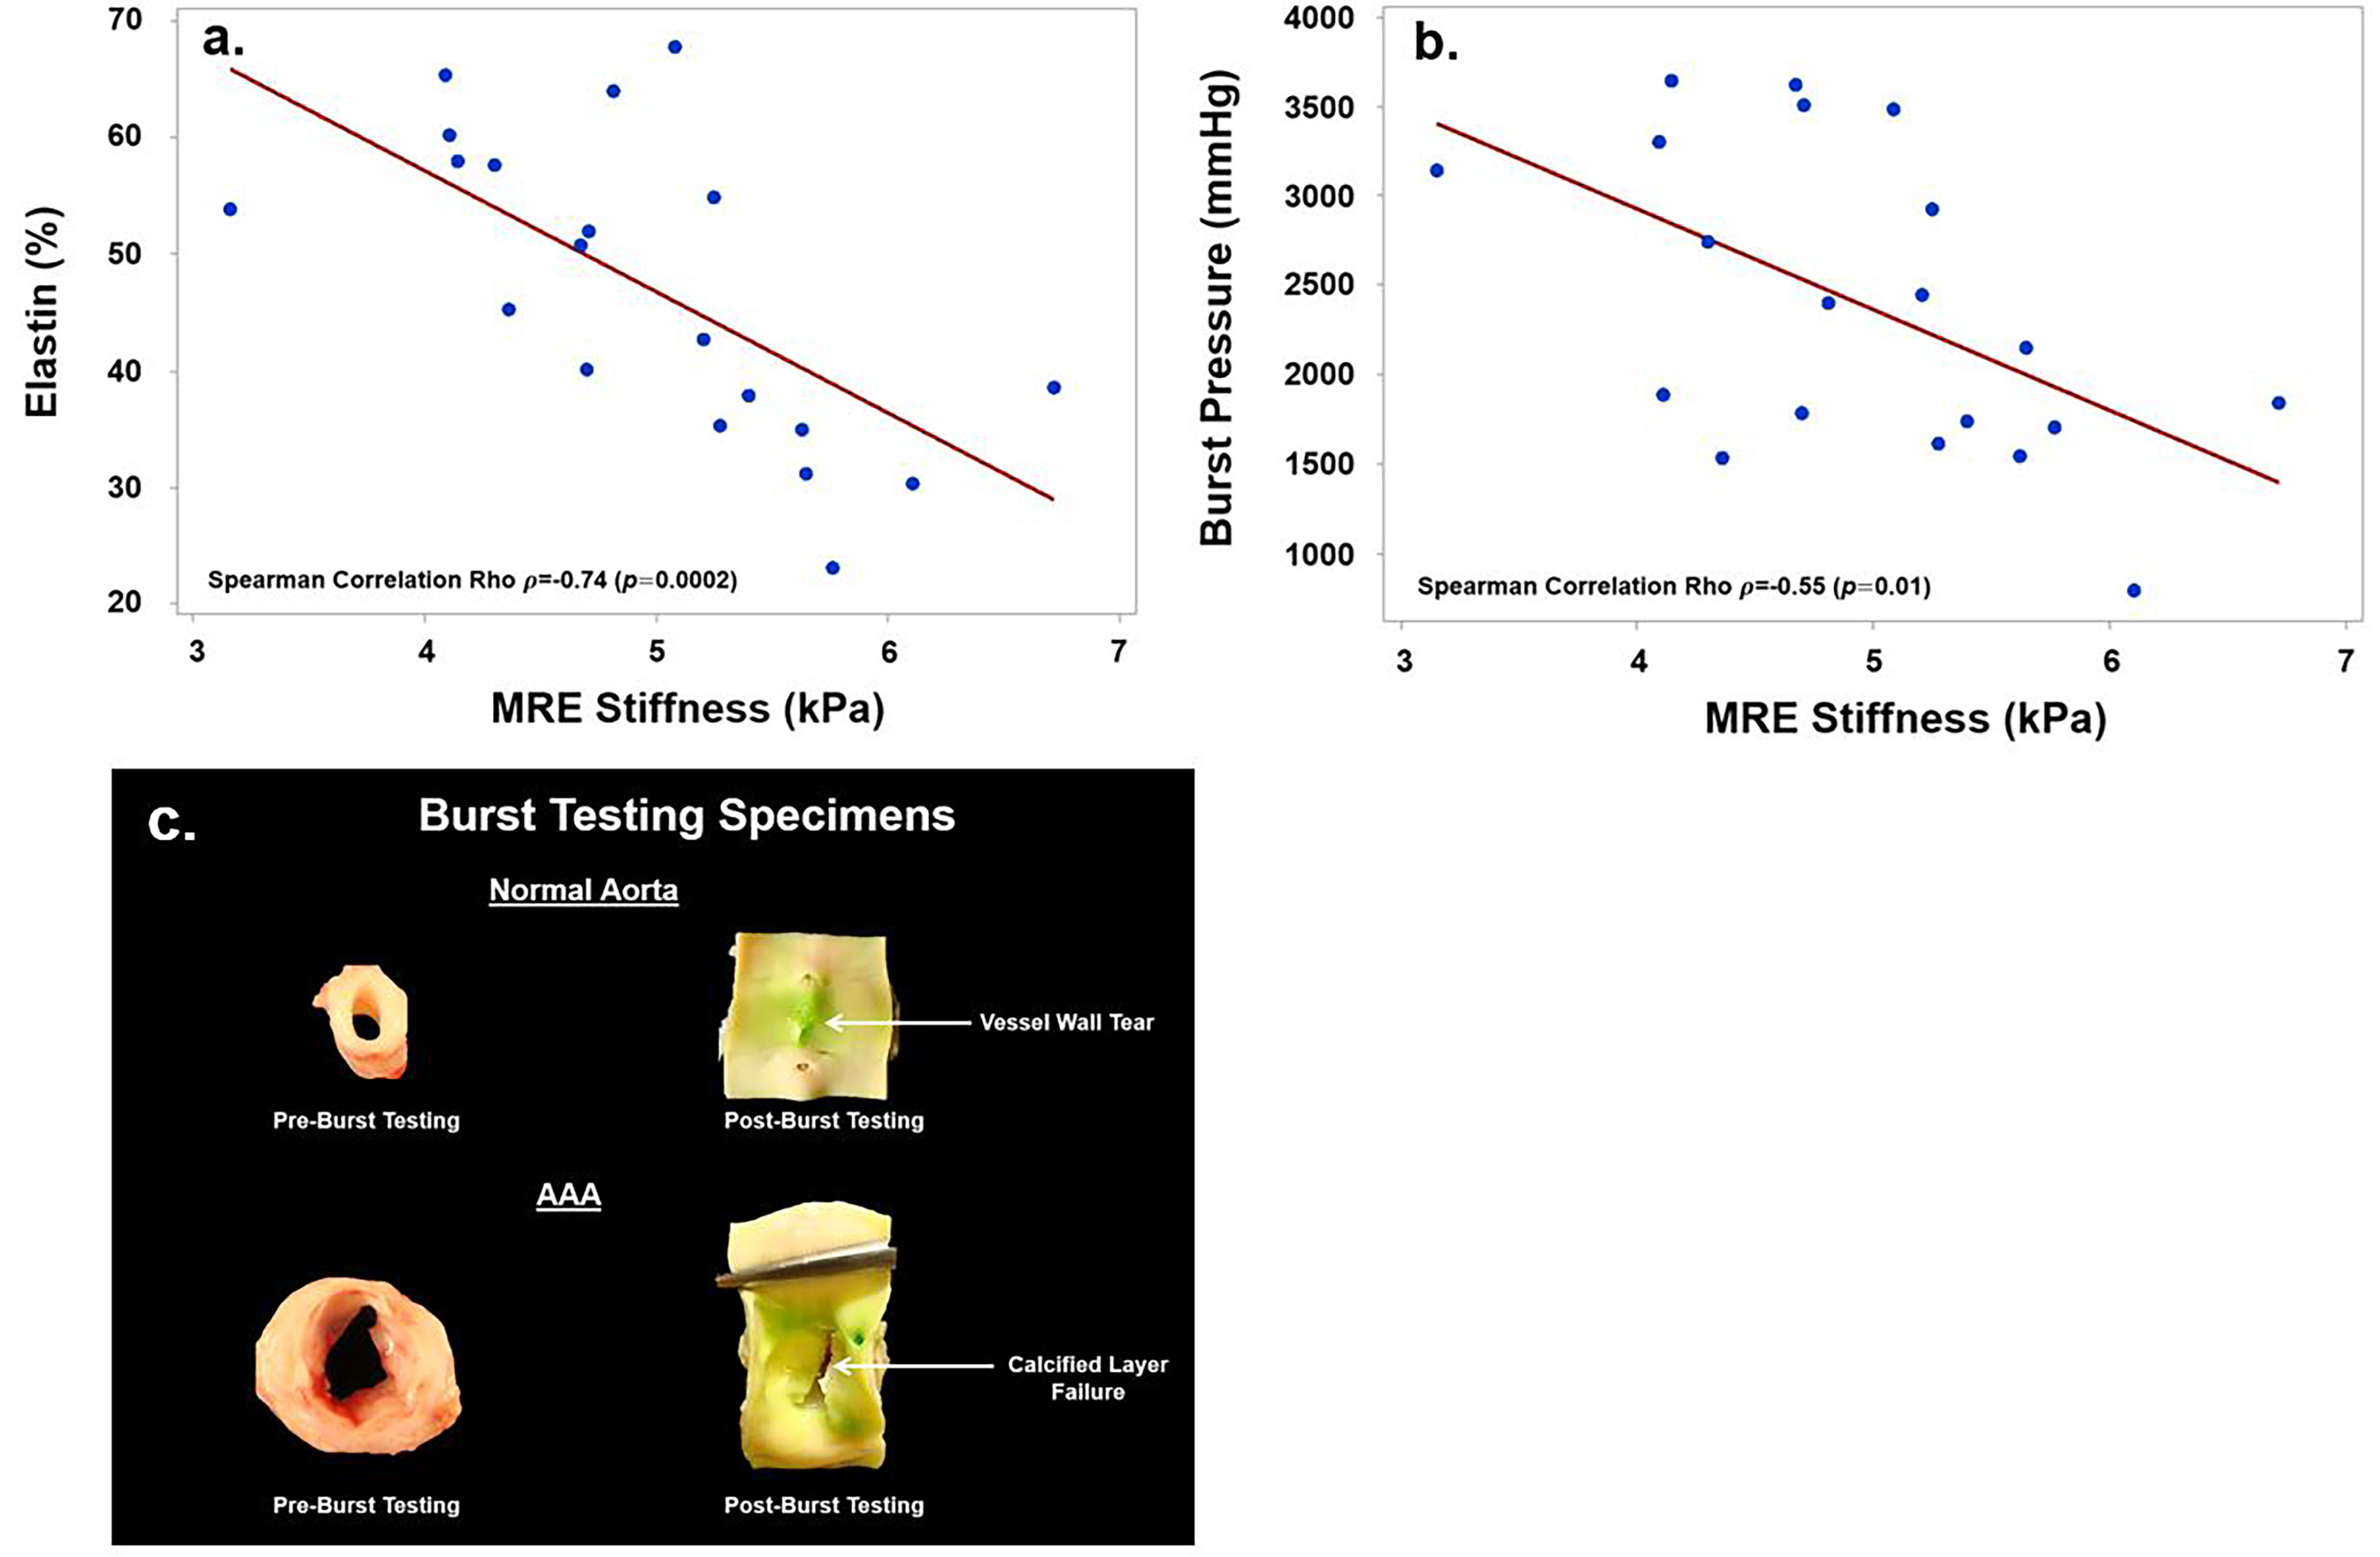
Figure 5 demonstrates the correlations among aortic stiffness, histopathology and burst pressure. Significant negative Spearman correlation was observed between aortic stiffness and %elastin (rho=-0.74, p=0.0002); between aortic stiffness and burst pressure (rho=-0.55, p=0.01). With the elastin degradation occurred in the AAA model, it was believed that stiffer collagen fibers (~1000x stiffer than elastin) were providing the load bearing15-16, resulting in an increase in AMRE-derived AAA stiffness. Additionally, as observed, there was no significant decrease in %collagen between AAA and normal aorta. On the other hand, those collagen fibers were disorganized and associated with microstructure defects due to AAA17-18, leading to significant strength decrease (i.e., brittle) as confirmed by the lower burst pressure.
Conclusion
This study demonstrated that AMRE-derived stiffness increased in AAA-induced animals as predicted by the disease model. Moreover, both elastin and burst pressure were lower in AAAs, confirming the diminished compliance and mechanical integrity of AAAs as the disease progressed. This study validated in-vivo AMRE-derived stiffness against gold standard measurements. Therefore, aortic MRE can be a potential tool for AAA diagnosis and accurate assessment of rupture risk.Acknowledgements
The authors particularly acknowledge Brian Raterman, BSRT (MR), Department of Radiology, The Ohio State University Wexner Medical Center and funding support NIH-R01HL124096.References
[1] Kuivaniemi H, Platsoucas CD, Tilson 3rd MD. Aortic aneurysms: an immune disease with a strong genetic component. Circulation 2008;117(2):242-252.
[2] Nicholls SC, Gardner JB, Meissner MH, Johansen HK. Rupture in small abdominal aortic aneurysms. J Vasc Surg 1998;28:884-8.
[3] Lederle FA, Wilson SE, Johnson GR, Reinke DB, Littooy FN, Acher CW, et al. Immediate repair compared with surveillance of small abdominal aortic aneurysms. N Engl J Med 2002;346:1437-44.
[4] Brewster DC, Cronenwett JL, Hallett JW Jr, Johnston KW, Krupski WC, Matsumura JS. Guidelines for the treatment of abdominal aortic aneurysms. Report of a subcommittee of the Joint Council of the American Association for Vascular Surgery and Society for Vascular Surgery. J Vasc Surg 2003;37:1106-17.
[5] Hall AJ, Busse EFG, McCarville DJ, Burgess JJ. Aortic Wall tension as a predictive factor for abdominal aortic aneurysm rupture: improving the selection of patients for abdominal aortic aneurysm repair. Ann Vasc Surg. 2000;14:152–157.
[6] Raghavan ML, Webster MW, Vorp DA. Ex vivo biomechanical behavior of abdominal aortic aneurysm: assessment using a new mathematical model. Ann Biomed Eng 1996;24:573-82.
[7] Vorp DA, Vande Geest JP. Biomechanical determinants of abdominal aortic aneurysm rupture. Arterioscler Thromb Vasc Biol 2005;25:1558-66.
[8] Kolipaka A, Illapani VS, Kenyhercz W, Dowell JD, Go MR, Starr JE, Vaccaro PS, White RD. Quantification of abdominal aortic aneurysm stiffness using magnetic resonance elastography and its comparison to aneurysm diameter. J Vasc Surg 2016.
[9] Kenyhercz WE, Raterman B, Illapani VS, Dowell J, Mo X, White RD, Kolipaka A. Quantification of aortic stiffness using magnetic resonance elastography: Measurement reproducibility, pulse wave velocity comparison, changes over cardiac cycle, and relationship with age. Magn Reson Med 2016;75(5):1920-1926.
[10] Dong H, Mazumder R, Illapani VSP, Mo X, White RD, Kolipaka A. In vivo quantification of aortic stiffness using MR elastography in hypertensive porcine model. Magn Reson Med 2017;78(6):2315-2321.
[11] Moláček J, Třeška V, Kobr J, Čertík B, Skalický T, Kuntscher V, Křížková V. Optimization of the model of abdominal aortic aneurysm–experiment in an animal model. Journal of Vascular Research 2009;46(1):1-5.
[12] Zaragoza C, Gomez-Guerrero C, Martin-Ventura JL, Blanco-Colio L, Lavin B, Mallavia B, Tarin C, Mas S, Ortiz A, Egido J. Animal models of cardiovascular diseases. J Biomed Biotechnol 2011;2011:497841.
[13] Knutsson H, Westin CF, Granlund G. Local multiscale frequency and bandwidth estimation. Image Processing, 1994, IEEE International Conference 1994; Vol. 1:36-40.
[14] Mulrane L, Rexhepaj E, Penney S, Callanan JJ, Gallagher WM. Automated image analysis in histopathology: a valuable tool in medical diagnostics. Expert Rev Mol Diagn. 2008;8(6):707-725. doi:10.1586/14737159.8.6.707.
[15] Dobrin PB, Baker WH, Gley WC. Elastolytic and Collagenolytic Studies of Arteries. Arch Surg. 1984;119(4):405. doi:10.1001/archsurg.1984.01390160041009.
[16] Mulrane L, Rexhepaj E, Penney S, Callanan JJ, Gallagher WM. Automated image analysis in histopathology: a valuable tool in medical diagnostics. Expert Rev Mol Diagn. 2008;8(6):707-725. doi:10.1586/14737159.8.6.707.
[17] Campa JS, Greenhalgh RM, Powell JT. Elastin degradation in abdominal aortic aneurysms. Atherosclerosis. 1987;65(1-2):13-21. doi:10.1016/0021-9150(87)90003-7.
[18] Gundiah N, Babu AR, Pruitt LA. Effects of elastase and collagenase on the nonlinearity and anisotropy of porcine aorta. Physiol Meas. 2013;34(12):1657-1673. doi:10.1088/0967-3334/34/12/1657.
Figures