2092
Evaluation of the endothelial (dys)function in a rabbit model of atherosclerosis by DCE-MRI and pharmacokinetic modelling1Division of General Neurology, Medical University of Graz, Graz, Austria, 2Clinical Institute for Medical and Chemical Laboratory Diagnosis, Medical University of Graz, Graz, Austria, 3Bracco Imaging SpA, Bracco Research Centre, Colleretto Giacosa, Italy, 4Department of Physiological Chemistry, Medical University of Graz, Graz, Austria
Synopsis
Endothelial dysfunction as a consequence of cardiovascular risk factors and increased endothelial permeability are involved in remodeling processes of the arterial wall and progression of AS early on. DCE-MRI in combination with pharmacokinetic modelling and a special nitric oxide donor compound together with dynamic vasomotor patterns could provide novel information related to changes of the endothelial function during the progression and pathogenesis of atherosclerosis and may contribute to a better mechanistic understanding of AS pathophysiology. In this work, we demonstrate the feasibility to investigate endothelial (dys)function and NO induced vasomotor function of the abdominal aorta in AS induced rabbits simultaneously.
Introduction
Endothelial dysfunction as a consequence of cardiovascular risk factors and increased endothelial permeability are involved in remodeling processes of the arterial wall and progression of AS early on1,2. This creates an unfavorable setting as protective antioxidant, antiinflammatory, anticoagulant and profibrinolytic actions and nitric oxide (NO) release are only fully efficient with a functioning vascular endothelium3. Moreover, NO controls vasoreactivity, regulates endothelial cell and tight junction morphology and vascular permeability4,5.
In this work we set out to explore changes in endothelial function with plaque progression in a rabbit model of atherosclerosis by pharmacokinetic modelling of T1w DCE-MRI vessel wall data. In detail, the response to a nitric oxide (NO) donor (S-nitroso human serum albumin, S-NO-HSA6) blood pool agent (B22956/17, Bracco Imaging SpA) compound was assessed. The original work (without pharmacokinetic modelling) was already presented at the 24th Annual ISMRM Meeting8.
Methods
Animal model: A total of three male New Zealand White (NZW) rabbits (age:10-11months; body weight:3,5-4,5kg) were repeatedly used in this study. Abdominal aortic atherosclerosis was induced in two rabbits by a combination of balloon catheter denudation and a two months high cholesterol diet.
S-NO-HSA(-B22956/1) infusion: Either a 20mL premix of B22956/1 and S-NO-HSA (molar ratio 2:1; 2mM/1mM) or B22956/1 (2mM) diluted in sodium chloride was administered intravenously (infusion rate of 20mL/h) during DCE-MRI.
Imaging: A dark blood double inversion recovery (DIR) T1-weighted turbo spin echo (T1w-TSE) sequence was used on one selected axial slice for DCE measurements. Scan parameter were TR/TE:600/12ms; NEX/ETL:4/7; matrix:256x176; FOV:120x82,5mm; resolution:0.46x0.46x3mm. A total of 60 images were acquired with a temporal resolution of 1min1sec. All experiments were performed on a human 3Tesla platform (Siemens Magnetom Prisma) using a 15Ch TxRx knee coil.
Data analysis: Average wall signal intensities (SI) were calculated for each DCE time point. Plasma curves (arterial input function, AIF) were extracted based on the arteria spinalis. The relative signal enhancement C(t) was calculated according to equation: C(t) = (SI(0)-SI(t)) / SI(0) . C(t) was used in lieu of the concentration as proportionality is approximately correct for sufficient low contrast agent concentration9. Wall tissue and plasma curves (Ct and modelled Cp) were than used to evaluate kinetic parameters using pharmacokinetic modelling. Numerical integration was realized using the trapezoidal rule and Eq. 3 rewritten as described by Murase et al to solve it using the linear least-squares (LLSQ) method10. Parameters of the plasma curve Cp (Eq. 4, AIF) were determined using a Levenberg-Marquardt nonlinear least squares fitting algorithm.
Two-compartment pharmacokinetic model: It describes the transport of a contrast agent between the vascular compartment and extravascular extracellular space (EES). In detail, analysis of contrast agent (CA) dynamics (bolus injection) using a two-compartment model in combination with a macromolecular agent is described by Faranesh et al11. Analysis of CA kinetics during and after infusion of a non-specific extravasating Gd agent is described by Brix et al12. Mathematical aspects for studying blood pool agent kinetics during infusion will be discussed in the following. The differential equations for the plasma Cp and extravascular extracellular space (EES) Ce concentration (mass/volume) are: $$\frac{\mathrm{d} C_p}{\mathrm{d} t}=\frac{K_{in}}{V_p}-k_eC_p \quad \textrm{(1)} \quad \frac{\mathrm{d} C_e}{\mathrm{d} t}=\frac{V_{p}}{V_e}k_{pe}C_p-k_{ep}C_e \quad \textrm{(2)}$$ and and the corresponding solution for the total tissue concentration Ct which is a weighted sum of veCe+vpCp is $$ C_t(t)=v_ek_{pe}\frac{V_p}{V_e} \intop\nolimits_{0}^{t}C_p(u)e^{-k_{ep}(t-u)}du+v_pC_p(t) \textrm{.} \quad \textrm{(3)}$$.
The differential equation Eq. 1 with the initial condition Cp(t = 0) = 0 can be solved and the integration yields $$C_p(t)=\frac{K_{in}}{V_pk_e}(1-e^{-k_{e}t}) \textrm{.} \quad \textrm{(4)}$$
Results
Table 1 represents parameter estimates for the plasma Cp(t) and vessel wall lesion tissue curves Ct(t). A detailed look at the rate constants of Ct(t) reveals a drop (CTRL-NZW and BTWD-NZWII) or no change (BTWD-NZWI) in flux/reflux of the contrast agent from vascular compartment to extravascular extracellular space (EES) and vice versa using the nitric oxide compound when compared to the blood pool agent alone. The visual inspection of the wall tissue curves (middle column Figure 1) confirms that behaviour. Data on the relative change in lumen area over time (right column Figure 1) indicate vasodilation, impaired vasodilation and paradoxical vasoconstriction (top to bottom) stimulated by the nitric oxide donor depending on the degree of plaque progression. In addition, Figure 3 (left column) shows representative anatomical wall images of the abdominal aorta and outlines the normalized wall index (NWI).
Discussion and Conclusion
In this work, we demonstrate for the first time the feasibility to investigate endothelial (dys)function (vascular permeability and vasomotor function) by DCE-MRI in combination with kinetic modelling and a special nitric oxide donor compound. Pharmacokinetic parameter estimates together with dynamic vasomotor patterns indicate novel information related to changes of the endothelial function during the progression and pathogenesis of atherosclerosis and may contribute to a better mechanistic understanding of AS pathophysiology.
Acknowledgements
This work was supported by an EU grant (NanoAthero, grant agreement no 30982).References
1. F. Wiesmann, S. E. Petersen, P. M. Leeson, J. M. Francis, M. D. Robson, Q. Wang, R. Choudhury, K. M. Channon, and S. Neubauer, Global impairment of brachial, carotid, and aortic vascular function in young smokers: direct quantification by high-resolution magnetic resonance imaging., J Am Coll Cardiol. 2004;44(10):2056-64. 2. M. J. Jaervisalo, M. Raitakari, J. O. Toikka, A. Putto-Laurila, R. Rontu, S. Laine, T. Lehtimaeki, T. Roennemaa, J. Viikari, and O. T. Raitakari, Endothelial dysfunction and increased arterial intima-media thickness in children with type 1 diabetes., Circulation. 2004;109(14):1750-5. 3. J. Davignon and P. Ganz, Role of endothelial dysfunction in atherosclerosis., Circulation. 2004;109(23 Suppl 1):III27-32. 4. S. Thibeault, Y. Rautureau, M. Oubaha, D. Faubert, B. C. Wilkes, C. Delisle, and J.-P. Gratton, Snitrosylation of beta-catenin by enos-derived no promotes vegf-induced endothelial cell permeability., Mol Cell. 2010;39(3):468-76. 5. D. Predescu, S. Predescu, J. Shimizu, K. Miyawaki-Shimizu, and A. B. Malik, Constitutive enos-derived nitric oxide is a determinant of endothelial junctional integrity., American journal of physiology. Am J Physiol Lung Cell Mol Physiol. 2005;289(3):L371-81. 6. E. Eroglu, B. Gottschalk, S. Charoensin, S. Blass, H. Bischof, R. Rost, C. T. Madreiter-Sokolowski, B. Pelzmann, E. Bernhart, W. Sattler, S. Hallstroem, T. Malinski, M. Waldeck-Weiermair, W. F. Graier, and R. Malli, Development of novel fp-based probes for live-cell imaging of nitric oxide dynamics., Nat Commun. 2016;7:10623. 7. C. de Haen, P. L. Anelli, V. Lorusso, A. Morisetti, F. Maggioni, J. Zheng, F. Uggeri, and F. M. Cavagna,Gadocoletic acid trisodium salt (b22956/1): a new blood pool magnetic resonance contrast agent with application in coronary angiography., Investigative radiology. 2006;41:279-291. 8. P. Opriessnig, G. Almer, H. Froehlich, C. Cabella, R. Stollberger, S. Hallstroem, G. Hoerl, and H. Mangge, Evaluation of endothelial barrier function in atherosclerosis induced rabbits using s-nitroso human serum albumin (s-no-hsa) - blood pool agent compound and dynamic contrast-enhanced (dce)-mri., Proceedings of the ISMRM 24th Annual Meeting, 2016. 9. W. Kerwin, A. Hooker, M. Spilker, P. Vicini, M. Ferguson, T. Hatsukami, and C. Yuan, Quantitative magnetic resonance imaging analysis of neovasculature volume in carotid atherosclerotic plaque, Circulation. 2003;107(6):851-6. 10. K. Murase, Efficient method for calculating kinetic parameters using t1-weighted dynamic contrast-enhanced magnetic resonance imaging., Magn Reson Med. 2004;51(4):858-62. 11. A. Z. Faranesh, D. L. Kraitchman, and E. R. McVeigh, Measurement of kinetic parameters in skeletal muscle by magnetic resonance imaging with an intravascular agent., Magnetic resonance in medicine, Magn Reson Med. 2006;55(5):1114-23. 12. G. Brix, W. Semmler, R. Port, L. R. Schad, G. Layer, and W. J. Lorenz, Pharmacokinetic parameters in cns gd-dtpa enhanced mr imaging., J Comput Assist Tomogr. 1991;15(4):621-8.
Figures

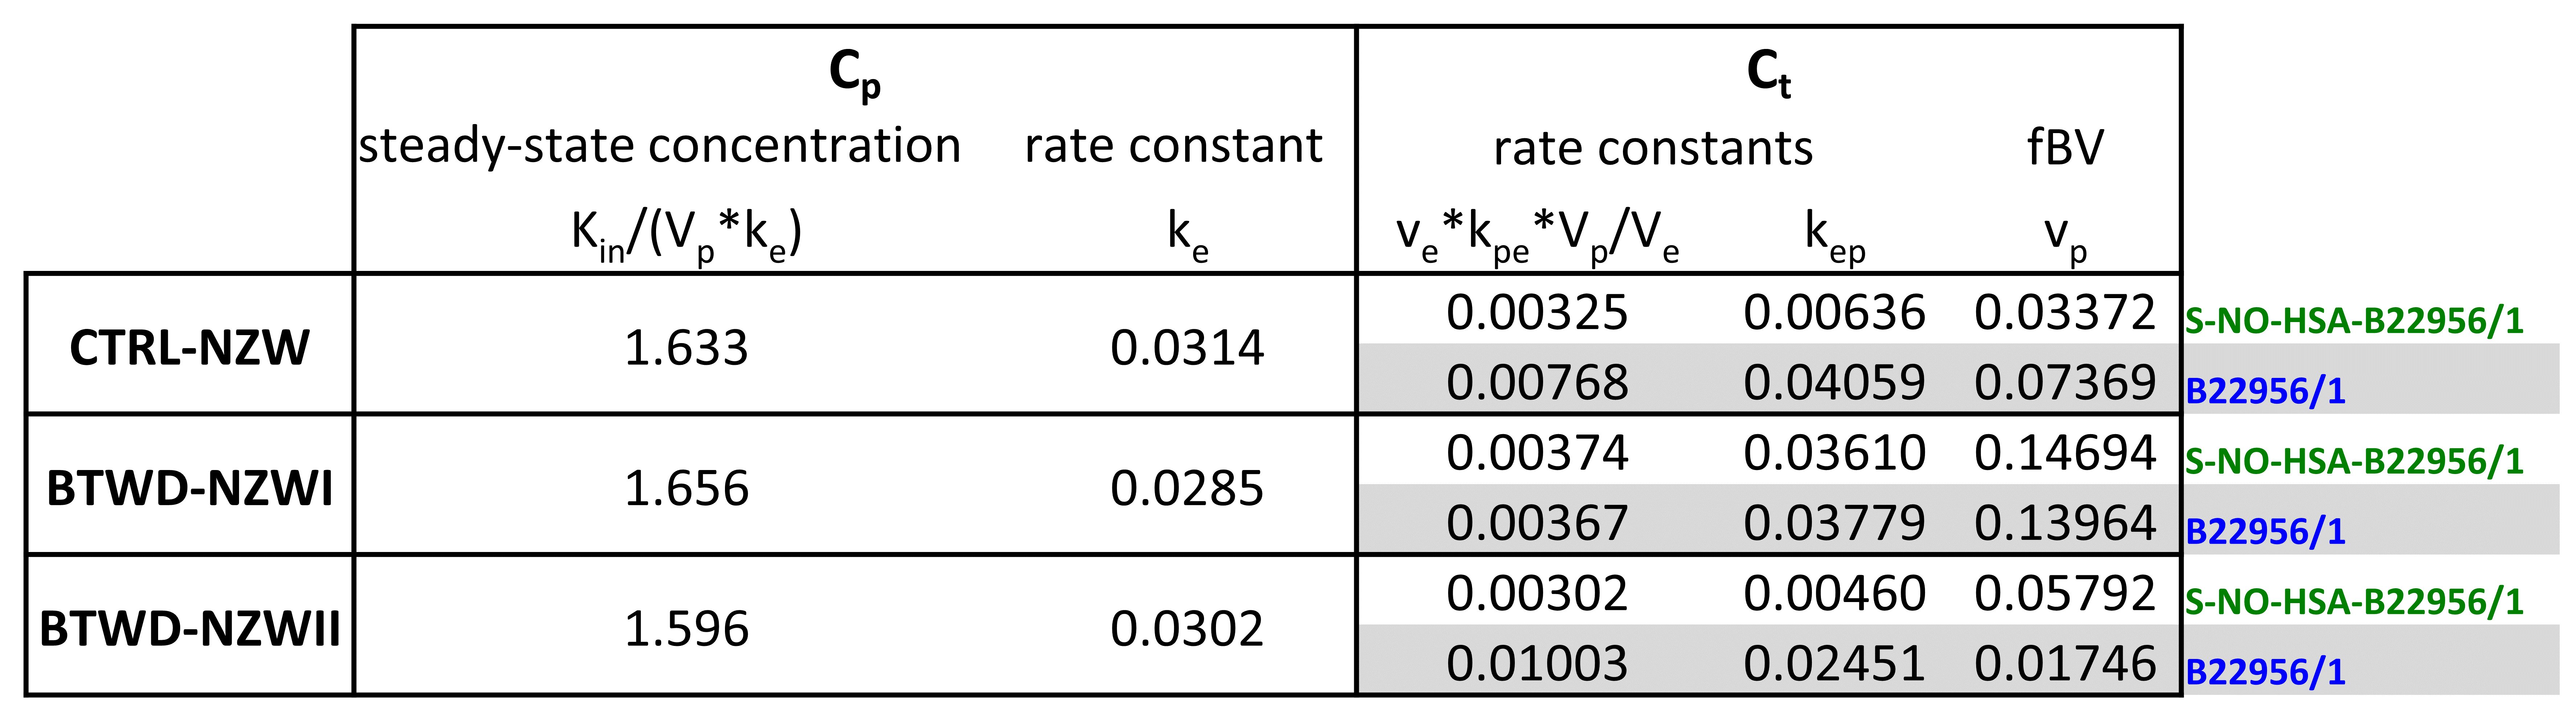
Figure 2: Pharmacokinetic parameters for Cp(t) and Ct(t). Parameters for plasma curve Cp: Steady-state concentration Kin/(Vpke) (mass/volume) and
first-order elimination rate constant ke (time-1). Kin (mass/time) is the zero-order rate constant and
corresponds to the contrast agent infusion rate. Parameters for lesion tissue curve Ct: Transfer constant vekpeVp/Ve (time-1), first-order rate constant kep (time-1) and fractional blood volume vp. The transfer constant is the product of the rate constant kpe (time-1), the volumes of the plasma and EES compartment (Vp and Ve) and the fractional EES volume ve.