2091
Plaque feature analysis using a joint method of QSM and water-fat separation1Department of Radiology, University of Cambridge, Cambridge, United Kingdom, 2Department of Histopathology, Cambridge University Hospital NHS Trust, Cambridge, United Kingdom, 3Department of Radiology, Cambridge University Hospitals NHS Foundation Trust, Cambridge, United Kingdom
Synopsis
In this work we investigated the feasibility of using a joint method of water-fat separation and Quantitative Susceptibility Mapping to characterize carotid artery plaques. The combination of both methodologies was able to detect strong changes in susceptibility, to detect plaque calcification, and also detect changes in the local fat fraction of the plaques in order to identify a lipid core.
Introduction
Carotid atherosclerosis involves the formation of plaques, which may rupture and cause ischemic stroke. Plaques can be classified as vulnerable and are characterized by features such as Intraplaque Haemorrhage (IPH), a Lipid Rich Necrotic Core (LRNC), a thin/ruptured Fibrous Cap (FC), and Calcification. Previously these features have been identified non-invasively through multi-contrast magnitude weighted MR images1. This is time consuming and requires extensive post-acquisition analysis. QSM is a novel method that allows for the identification of IPH, and calcification. We have shown previously that its implementation requires the correction of chemical shifts caused by the presence of fat and we have solved this problem using water/fat separation2. Furthermore, it has been shown that water/fat separation can be used to identify the lipid core3. We suggest that joint QSM and water/fat separation can be used to identify plaque features simultaneously, thus reducing the need for cross-acquisition comparison and additional sequences.Methods
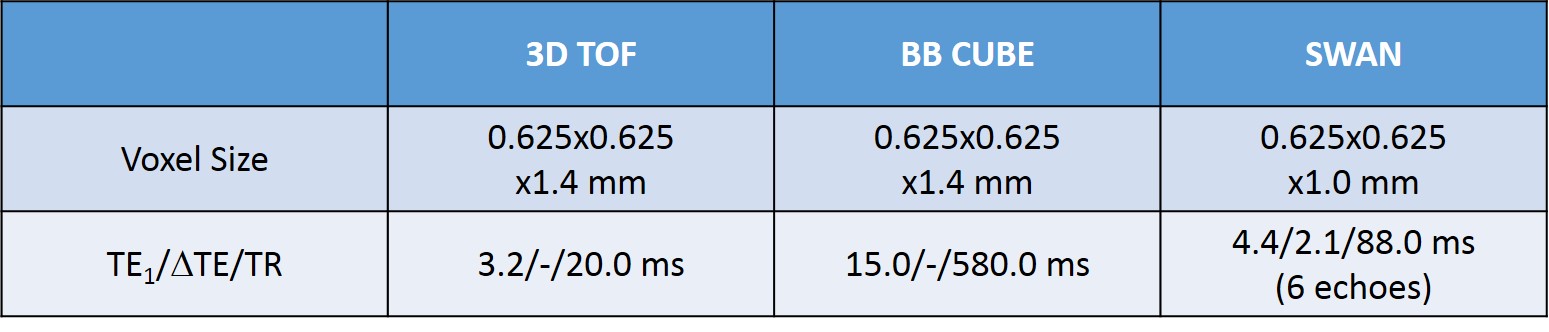
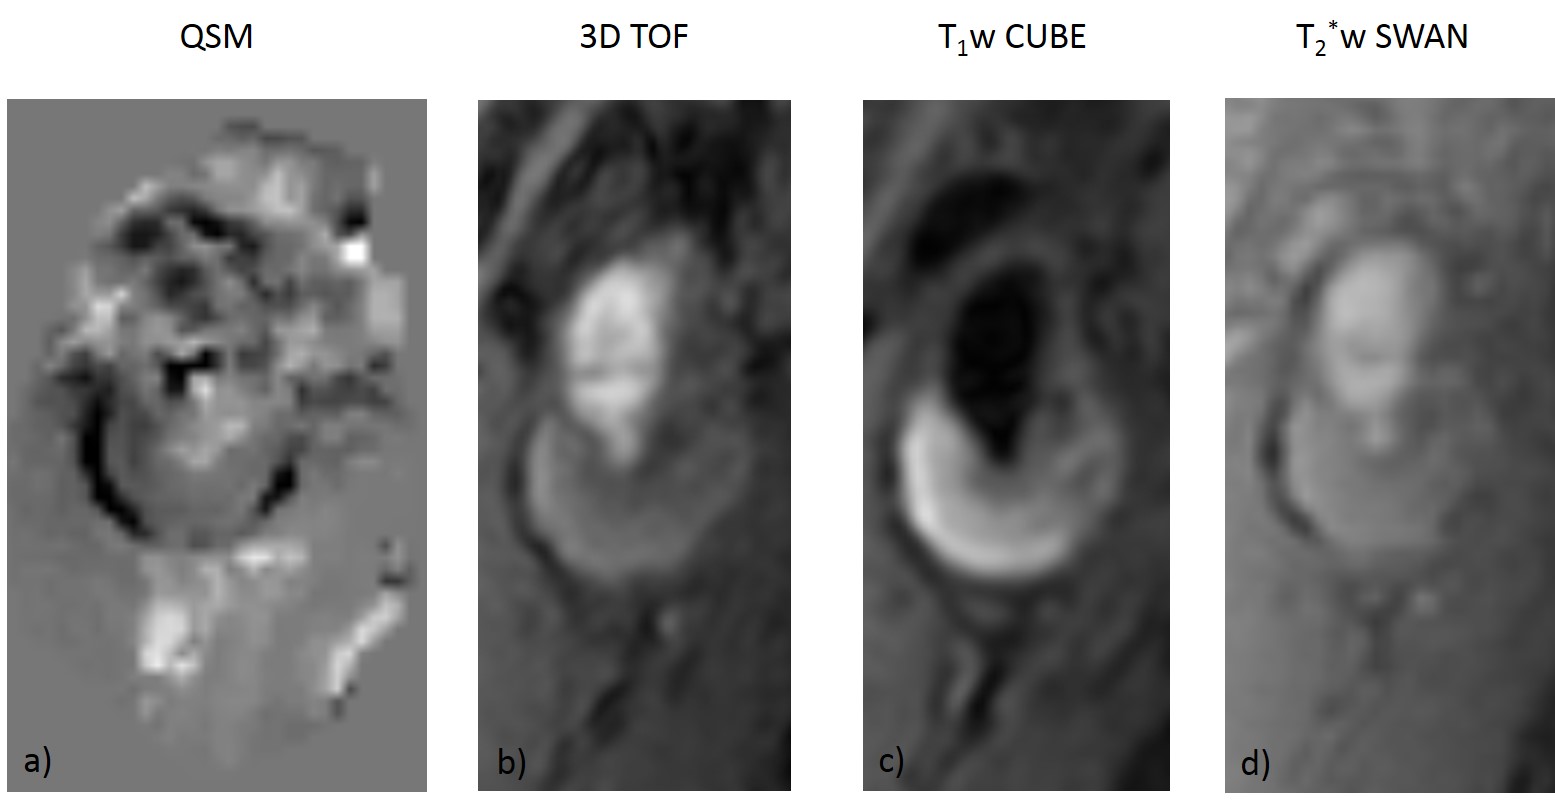
One patient with carotid artery disease was scanned at 1.5T (MR450w, GE Healthcare, Waukesha, WI). The study protocol consisted of 3D Time-of-Flight (TOF) MRA, black-blood (DANTE-prepared), fat suppressed T1-weighted CUBE, and a 3D multi-echo gradient echo acquisition (SWAN) (Figure 1). The T2*-weighted GRE sequence was used for QSM processing, which consisted of IDEAL water-fat separation to estimate ΔB and the water and fat fraction2,4,5, background field removal, and dipole field inversion using MEDI6–13.The multi-contrast protocol was used to validate the presence of calcification.
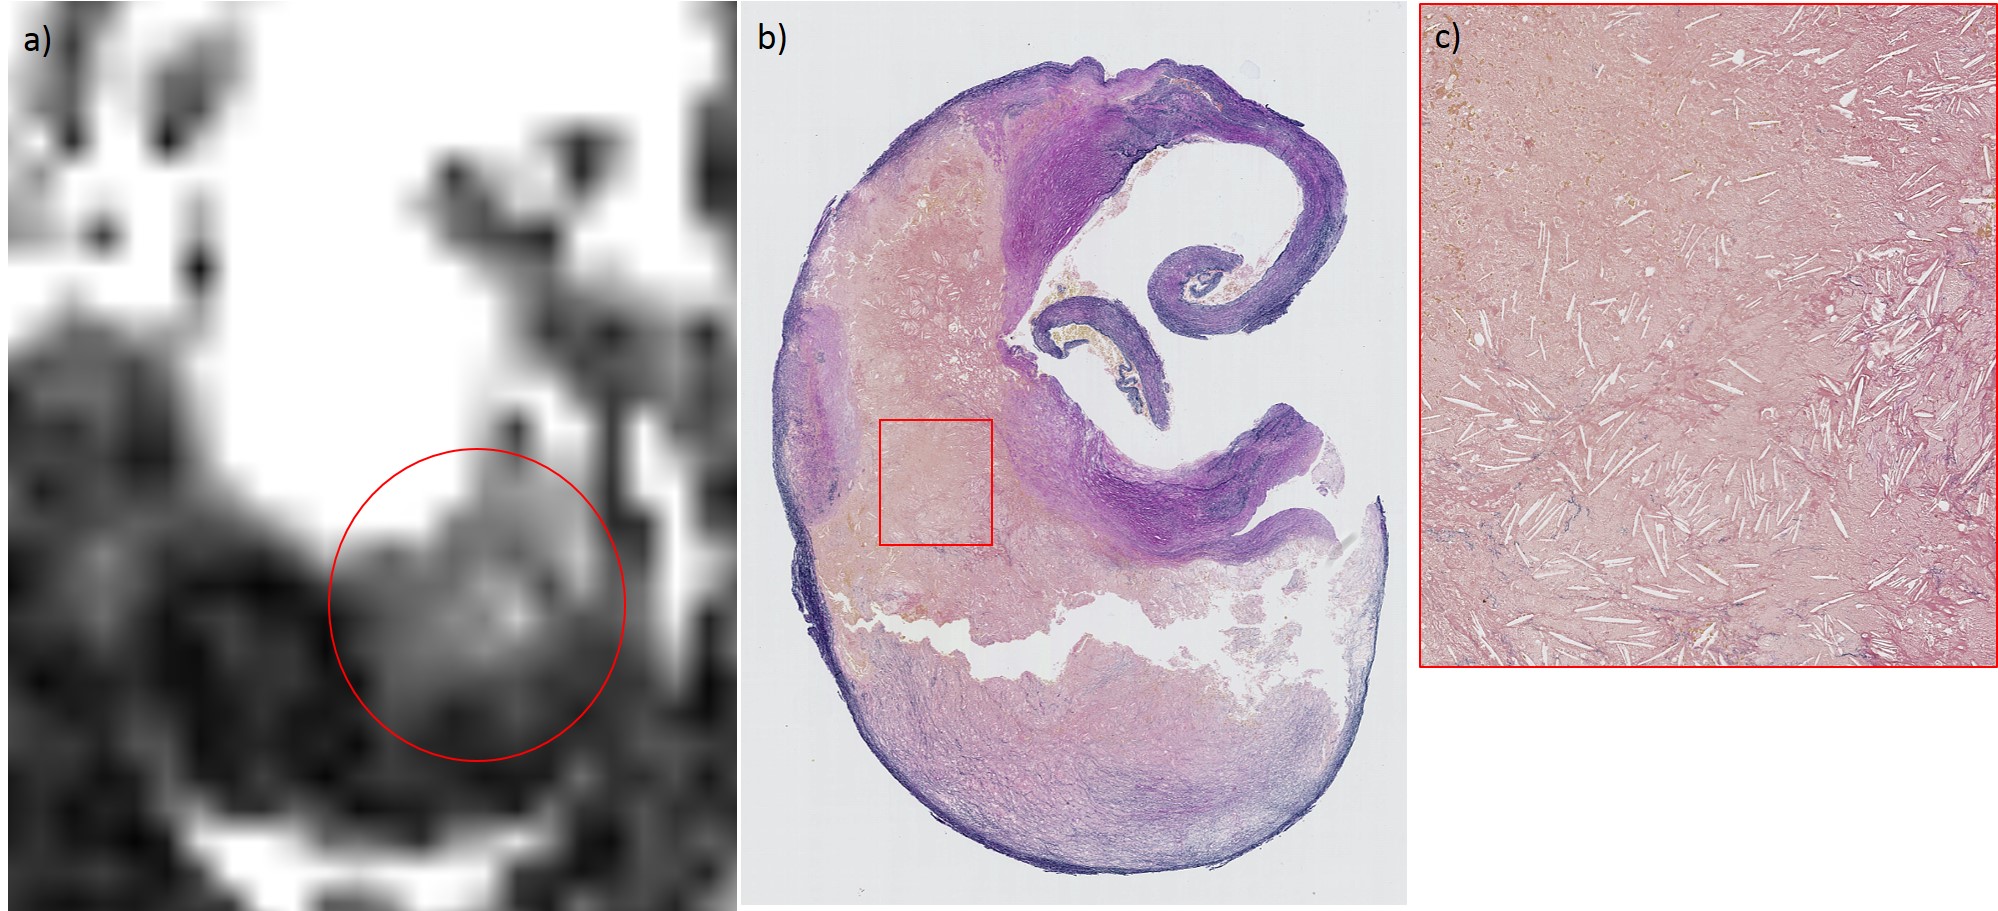
After the MRI scan, the patient underwent carotid endarterectomy surgery and the excised plaque was analysed histologically. For histological analysis the carotid endarterectomy specimen was decalcified and sliced at 3mm intervals. The tissue was embedded in paraffin wax; thin sections were cut at 3µm thickness and then stained with an Elastic Van Gieson histochemical stain.
Areas of calcification were outlined on the susceptibility map and the lipid core on a map of the relative fat fraction. The results were compared to the multi-contrast protocol and the histological validation.
Results
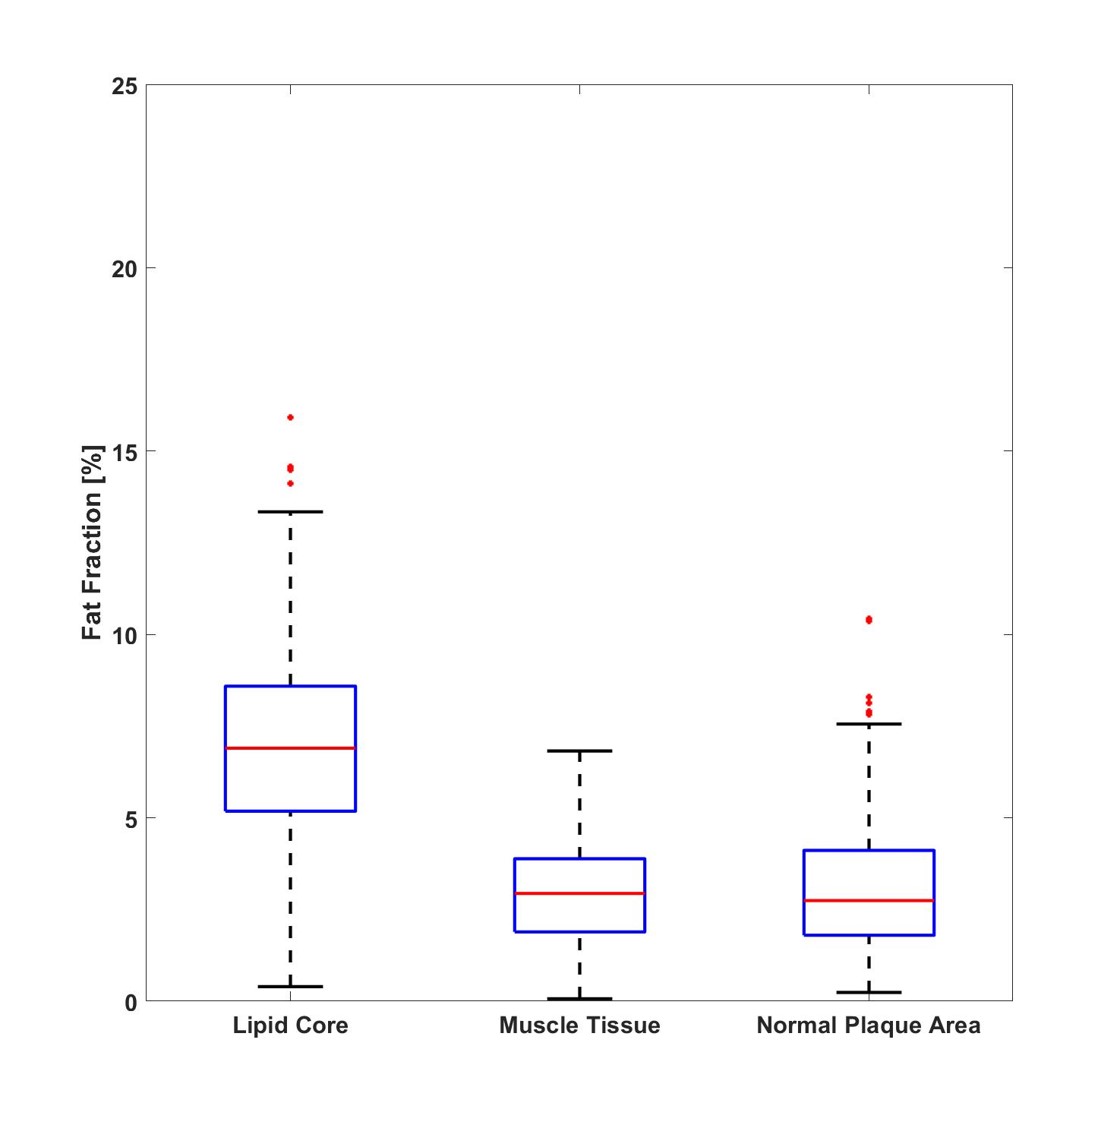
Areas of IDEAL-identified lipid core were identified as hyperintensities on the fat fraction map and coincided with the histologically identified lipid core (Figure 2). Areas of IDEAL-identified lipid core had a higher fat fraction (6.92+-2.53%), that was more than twice as high as that of normal plaque areas (3.09+-1.75%) and the sternocleidomastoid muscle (2.96+-1.34%) (Figure 3). The areas of QSM-identified calcification coincided with the location on the multi-contrast protocol. Susceptibility values within the calcified area were much more negative (-0.67±0.28 ppm) than measured in the normal plaque area (-0.11±0.17 ppm) (Figure 4).Discussion
The joint method of QSM and IDEAL water/fat separation offers a more concise and quantitative assessment of carotid artery plaque composition. By using a single sequence instead of three to four sequences that are required to identify lipid core, calcification, and intra-plaque haemorrhage. This reduces scanning time and removes the need for extensive post-acquisition qualitative image analysis that is highly user dependent.Conclusion
QSM and water fat separation may improve current non-invasive MR analysis of carotid artery plaques.Acknowledgements
P Ruetten is funded by a Medical Research Council/Sackler Stipend. The project was supported by the Addenbrooke’s Charitable Trust and the NIHR comprehensive Biomedical Research Centre. A Usman is funded by Mountbatten Cambridge International Scholarship in collaboration with Cambridge Trust, Christ’s College and Sir Ernest Cassel Educational Trust.
We would like to thank Jianmin Yuan for his support during the sequence design.
References
1. Gillard J, Graves M, Hatsukami T, Yuan C. Carotid Disease : The Role of Imaging in Diagnosis and Management. Vol. 9780521862264. Cambridge: Cambridge : Cambridge University Press; 2006.
2. Ruetten, et al. Quantitative Susceptibility Mapping of the Carotid Artery Wall using IDEAL. 34th Annual Scientific Meeting of ESMRMB; Barcelona. 2017; abstract 798
3. Koppal S, Warntjes M, Swann J, Dyverfeldt P, Kihlberg J, Moreno R, et al. Quantitative fat and R2* mapping in vivo to measure lipid‐rich necrotic core and intraplaque hemorrhage in carotid atherosclerosis. Magn Reson Med. 2017;78(1):285–96.
4. Dimov A V., Liu T, Spincemaille P, Ecanow JS, Tan H, Edelman RR, et al. Joint estimation of chemical shift and quantitative susceptibility mapping (chemical QSM). Magn Reson Med. 2015;73(6):2100–10.
5. Reeder SB, Wen Z, Yu H, Pineda AR, Gold GE, Markl M, et al. Multicoil Dixon chemical species separation with an iterative least‐squares estimation method. Magn Reson Med. 2004;51(1):35–45.
6. Liu T, Wisnieff C, Lou M, Chen W, Spincemaille P, Wang Y. Nonlinear formulation of the magnetic field to source relationship for robust quantitative susceptibility mapping. Magn Reson Med. 2013;69(2):467–76.
7. Kressler B, de Rochefort L, Liu T, Spincemaille P, Jiang Q, Wang Y. Nonlinear Regularization for Per Voxel Estimation of Magnetic Susceptibility Distributions From MRI Field Maps. IEEE Trans Med Imaging [Internet]. 2010;29(2):273–81. Available from: http://ieeexplore.ieee.org/lpdocs/epic03/wrapper.htm?arnumber=5067387%0Apapers2://publication/doi/10.1109/TMI.2009.2023787
8. De Rochefort L, Brown R, Prince MR, Wang Y. Quantitative MR susceptibility mapping using piece-wise constant regularized inversion of the magnetic field. Magn Reson Med. 2008;60(4):1003–9.
9. Zhou D, Liu T, Spincemaille P, Wang Y. Background field removal by solving the Laplacian boundary value problem. NMR Biomed. 2014;27(3):312–9.
10. Liu J, Liu T, De Rochefort L, Ledoux J, Khalidov I, Chen W, et al. Morphology enabled dipole inversion for quantitative susceptibility mapping using structural consistency between the magnitude image and the susceptibility map. Neuroimage [Internet]. 2012;59(3):2560–8. Available from: http://dx.doi.org/10.1016/j.neuroimage.2011.08.082
11. Liu T, Liu J, De Rochefort L, Spincemaille P, Khalidov I, Ledoux JR, et al. Morphology enabled dipole inversion (MEDI) from a single-angle acquisition: Comparison with COSMOS in human brain imaging. Magn Reson Med. 2011;66(3):777–83.
12. De Rochefort L, Liu T, Kressler B, Liu J, Spincemaille P, Lebon V, et al. Quantitative susceptibility map reconstruction from MR phase data using bayesian regularization: Validation and application to brain imaging. Magn Reson Med. 2010;63(1):194–206.
13. Shmueli K, Zwart J De. Magnetic susceptibility mapping of brain tissue in vivo using MRI phase data. Magn Reson Med. 2009;62(6):1510–1.
14 the codes referenced in [6-13] are available at "http://weill.cornell.edu/mri/pages/qsm.html"
Figures