2088
Multiparametric evaluation of Atheroembolic renal disease in a microsphere-induced animal model1Peking University, Beijing, China, 2Shanghai Jiao Tong University, Shanghai, China, 3Peking University First Hospital, Beijing, China
Synopsis
Atheroembolic renal disease (AERD) is the major cause of renal insufficiency in the elderly, and cholesterol embolism is a manifestation of this disease. AERD is often an underdiagnosed clinical illness because of the lack of sensitive examination methods. Recently, multiparameter MRI showed its potential in enhancing the efficiency of diagnosing renal diseases. In this study, we examine the value of multiparameter MRI in AERD detection and further compared with histology.
Introduction
Atheroembolic renal disease (AERD) is the major cause of renal insufficiency in the elderly, and cholesterol embolism is a manifestation of this disease. AERD is often an underdiagnosed clinical illness because the systemic nature of atheroembolism makes diagnosis difficult.1,2 Renal biopsy is regarded as the definitive method for diagnosis. However, the tissue damage caused by these crystal emboli is usually patchy, making it is easy to be misdiagnosed. Besides, taking a renal biopsy sample is not always feasible, especially in sick patients. The lack of sensitive examination methods makes the renal and patient prognosis of AERD poor. Recently, multiparameter MRI showed its potential in enhancing the efficiency of diagnosing renal diseases. In this study, we examine the value of multiparameter MRI in AERD detection and further compared with histology.Methods
Animal Study
All the experiments were conducted in accordance with the guidelines of the National Institutes of Health for Animal Care and Use Institutional Committee. Twenty New Zealand White rabbits aged 7-8 weeks were enrolled in this study (n = 18, weight range 2.5-3.5 kg). After anesthesia with sodium pentobarbital (30 mg/kg body weight), microspheres suspended in 2.0 ml of physiological saline were injected slowly into the ostium of the right renal artery through a catheter. Animals are fed under standard conditions.
MR imaging
MRI experiments were performed on a 3.0 T whole-body MRI system (Achieva, Philips Medical Systems, Best, The Netherlands), with a maximum gradient strength of 80 mT/m and a slew rate of 200T/m/s. Body coil was used for signal transmission, and an 8-channel knee coil was applied for signal reception. Each rabbit was placed in a supine position and the middle of the kidney was at the isocenter of the magnet. During the MRI experiments, anesthesia was induced with Isopentane (1.0 L/min) delivered by a facemask. All scans were performed during free breathing.
Histology
Four weeks after surgery, kidneys were removed and embedded in paraffin. Kidneys tissues were fixed in 10% formalin and embedded in paraffin for light microscopic observation. Kidneys were sectioned into 2-mm slides and stained with hematoxylin-eosin. A pathologist specializing in kidney diseases reviewe1d histological findings. The pathology and renal specimen results were considered the reference standard for assessing the kidney injury. The pathologist was blinded to the imaging findings.
Results
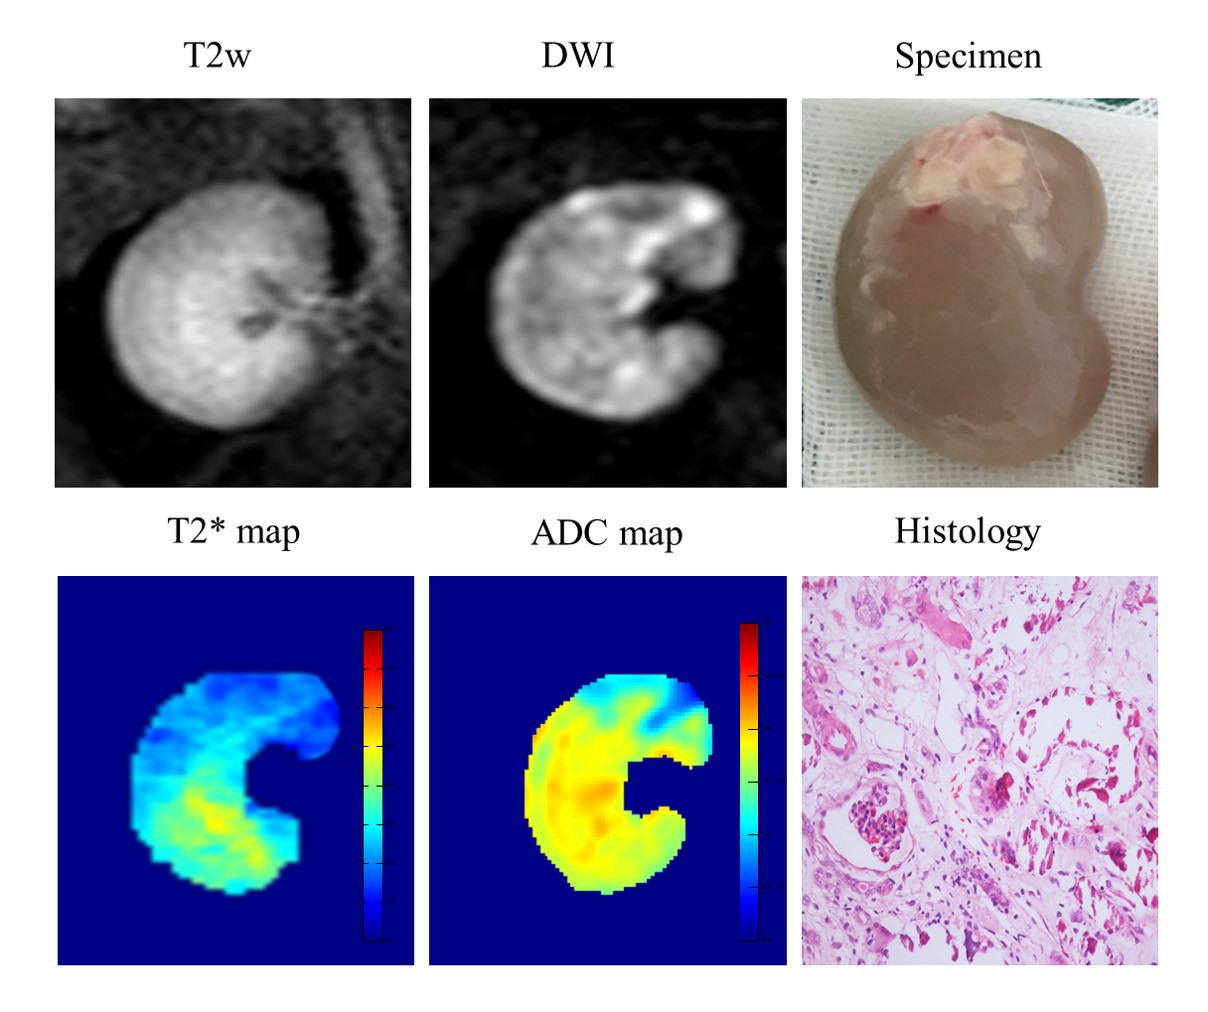
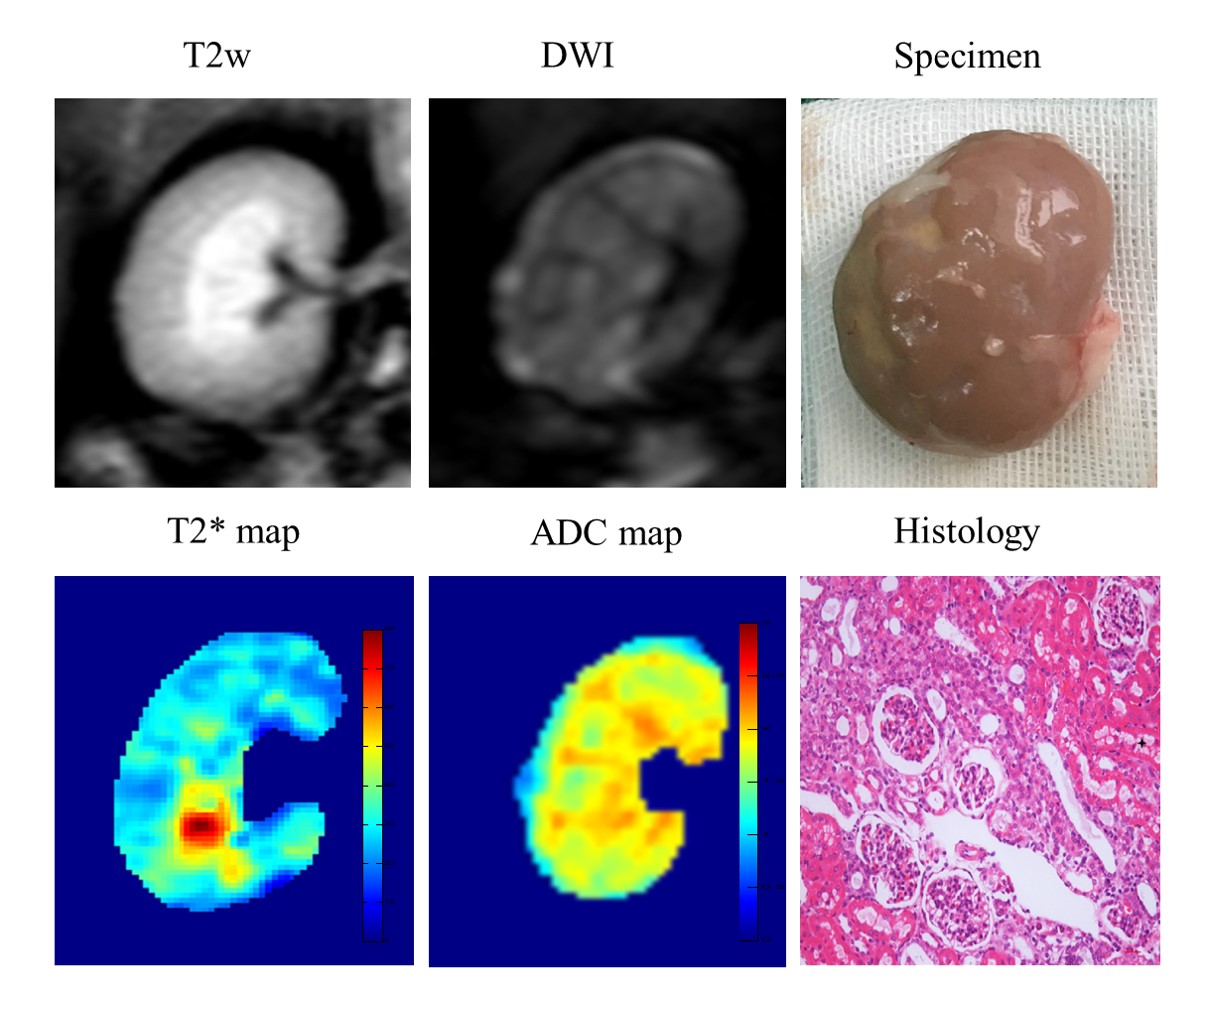
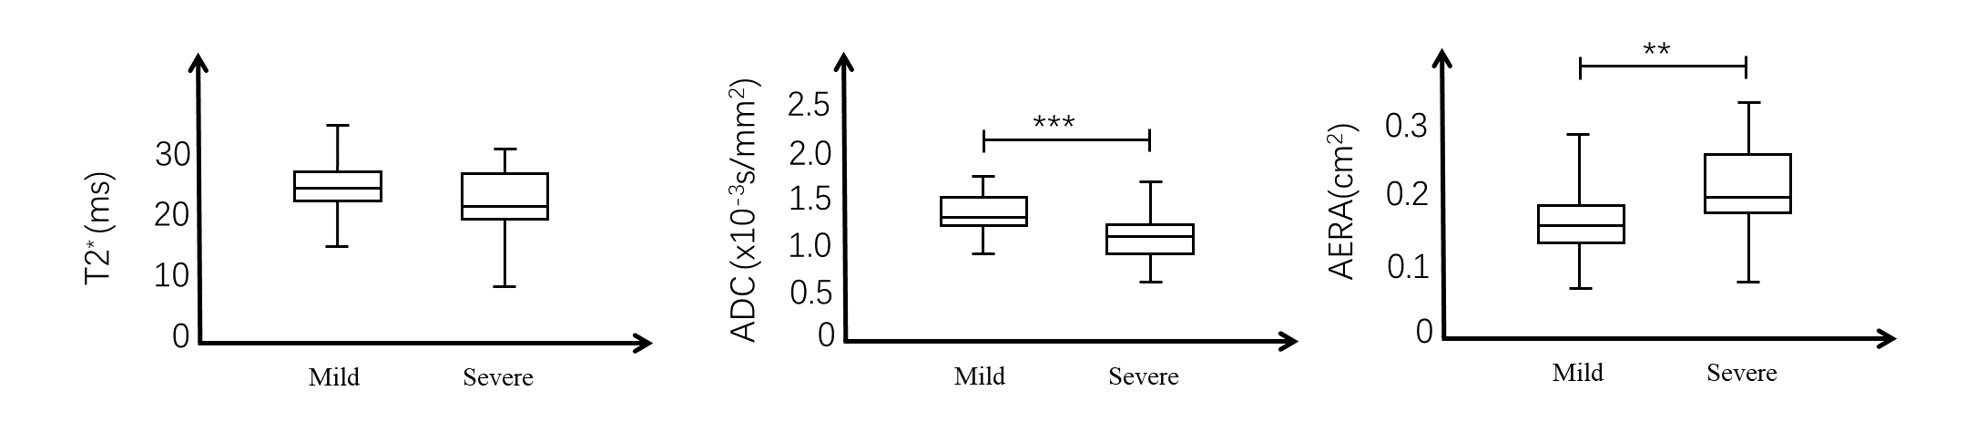
Figure 1 shows the multi-parameter MRI of a typical severe AERD and the corresponding renal specimen and histology results. No obvious signal change was observed on the T2 weighted image. Multifocal punctate high-signal-intensity spots were observed on DW image. Significant decreases were observed in both ADC map and T2* map, and the area of signal reduction is larger for T2* map. The lesion region on the renal specimen was basically consistent with that of the DW image, ADC map, and T2* map. For a typical mild AERD kidney, no abnormity is found in the T2 weighted image and ADC maps. Multifocal punctate high-signal-intensity spots were observed in the cortex on the DW image and t2* map. Similar with severe AERD, the area of signal reduction in T2* map is larger than that of the DW image. The T2* values, ADC values, and area of the lesion regions were compared between mild and severe AERD. There were significant differences in the area (p<0.0001) and ADC values (p=0.0004) between the two groups.Discussion and Conclusion
Since the ischemia is the most direct consequence of AERD, the T2* value showed an obvious signal reduction in both mild and severe AERD and had no significant difference between the two groups. ADC is not as sensitive as T2* in AERD detection, but it is useful for differentiating the severity of AERD. In clinical practice, BOLD can be used to first locate the ischemic site, and the disease’s severity is then determined according to the lesion area and ADC value. In conclusion, both the ADC value and lesion area were able to distinguish mild and severe AERD in a rabbit model. This multi-parameter MR approach could be useful for the diagnosis and assessment of treatments in AERD patients.Acknowledgements
No acknowledgement found.References
1. Modi KS, Rao VK. Atheroembolic renal disease. J Am Soc Nephrol. 2001;12(8):1781-1787.
2. Scolari F, Ravani P. Atheroembolic renal disease. The Lancet. 2010;375(9726):1650-1660.
Figures