2072
Investigation of Non-Contrast Enhanced Peripheral Artery MR Angiography using AccASL with Double Labeling and Dual AENC Scheme for Realizing Consistent Visualization in Various Blood Flow Conditions1Philips Japan, Ltd., Tokyo, Japan, 2Department of Clinical Radiology, Graduate School of Medical Sciences, Kyushu University, Kyushu University, Fukuoka, Japan, 3Division of Radiology, Department of Medical Technology, Kyushu University, Fukuoka, Japan, 4Department of Radiology, Tokai University Hospital, Kanagawa, Japan, 5Asia Pacific, Philips Healthcare, Tokyo, Japan
Synopsis
Acceleration-Selective Arterial Spin Labeling (AccASL) with double labeling and dual acceleration encoding (AENC) scheme (AccDD) was developed for consistent non-triggered peripheral non-contrast enhanced MR angiography. AccDD requires only 50% longer scan time than conventional single labeling and single AENC scheme and can provide better artery visualization. In addition, veins, with an expected flow slower than arteries, were more visualized using lower AENC acquisition of AccDD, indicating AccDD is sensitive to a wide flow velocity range. Consistent flow visualization in various flow conditions with patients can be expected.
Purpose
In this study, we optimized the Acceleration-Selective Arterial Spin Labeling (AccASL)1,2,3 sequence and scheme for non-triggered peripheral non-contrast enhanced MR angiography (NCE-MRA). Conventionally, physiological triggering is used in peripheral NCE-MRA2,4, which makes the examination troublesome and also decreases consistency due to its difficulty for patients with arrhythmia. The goal of this study is to investigate clinical feasibility of this new approach for the lower extremities.Methods
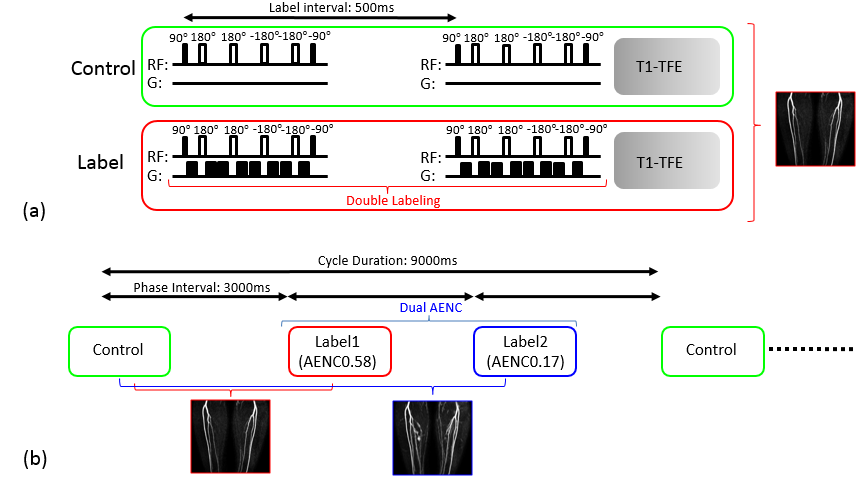
Double Labeling and Dual AENC Scheme
Optimized AccASL sequence and scheme are shown in Figure. 1. The AccASL consists of control and label pre-pulses. For robust flow visualization, four 180° pulses were used.5 In the conventional AccASL based peripheral NCE-MRA, acceleration-sensitized gradients (ASG) are applied at the time point when flow is at maximum deceleration,2 to get high labeling efficiency. In the case of non-triggering, the labeling efficiency can be reduced as the timing is not optimal. To achieve high labeling efficiency consistently, double labeling, applying two ASG with 500msec interval, was used as shown in Figure 1a. This way the probability of applying a labeling pulse at the timing when acceleration or deceleration occurs in the flow is increased.
The optimal ASG parameter or acceleration encoding (AENC) value, that is the acceleration causing a phase change of π, can vary from patient by patient. Considering that, we implemented the dual AENC scheme as shown in Figure.1b. Normally, two AENCs acquisitions require double scan time. For efficiency, a single control scan and two labeling scans with two different AENCs were applied in an interleaved manner such that scan time is extended by 50% only.
Magnetic Resonance (MR) Experiments
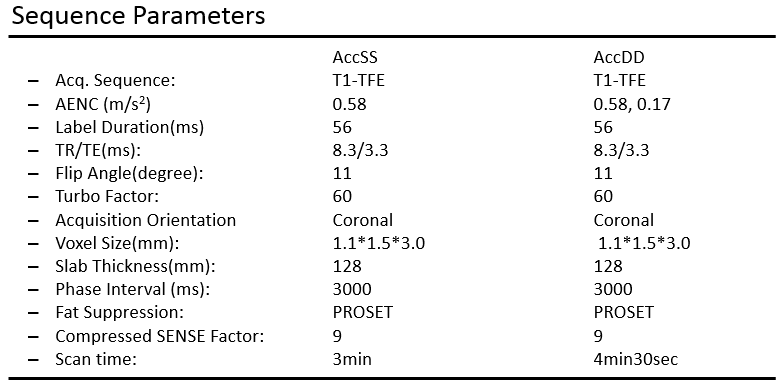
The double labeling and dual AENC scheme (AccDD) and conventional single labeling and single AENC scheme (AccSS) were implemented on a 3.0T Ingenia R5 MR scanner (Philips, Best, the Netherlands). Peripheral MRA was scanned in five healthy volunteers (mean age: 35.8 years). Informed consent required by the Institutional Review Board was obtained. We compared artery and vein visualization in AccDD and AccSS. Sequence parameters used in this study are shown in Figure 2. AENC 0.58 m/s2 was used in AccSS (AccSS-0.58) and AENC 0.58 m/s2 and 0.17 m/s2 were used in AccDD (AccDD-0.58, AccDD-0.17).
Validation of flow visualization
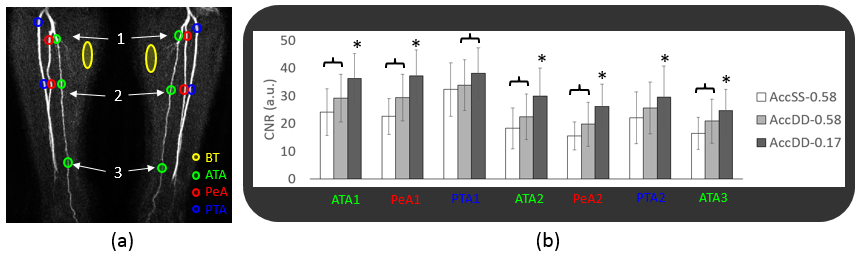
In the image evaluation, 50-mm coronal slab maximum intensity projection images were used. For the assessment of artery visualization, circular regions of interest (ROI) were selected from the background tissue (BT) and three branches, anterior tibial artery (ATA), peroneal artery (PeA) and posterior tibial artery (PTA). Three ROIs for ATA (ATA1, ATA2, ATA3) and two ROIs for PeA and PTA (PeA1, PeA2, PTA1, PTA2) were placed from proximal to peripheral. The contrast-to-noise ratio (CNR) between artery and BT was measured using the following equation:
CNR = (bloodmax–BTave)/BTSD.
Here, bloodmax is the maximum signal within artery ROI and BTave and BTSD are the average signal and standard deviation, respectively, in the BT ROI. The Holm method was used in the statistical analysis, and p<0.05 was considered statistically significant.
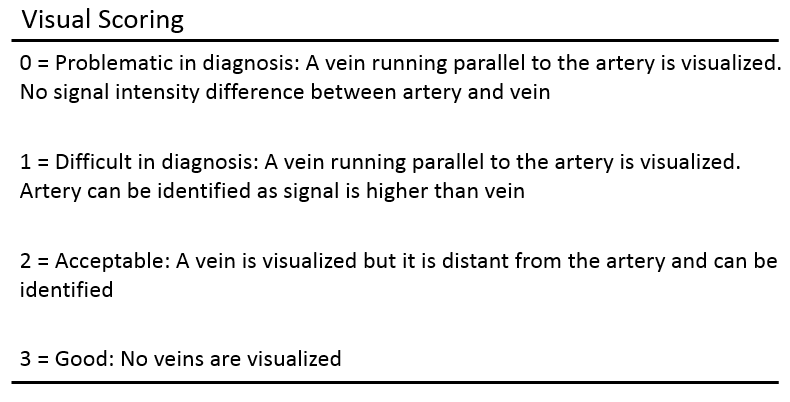
For the assessment of vein signal, visual scoring was conducted by an MR scientist with fifteen years of experience (M.O.), following criteria shown in Figure.3.
Results and Discussion
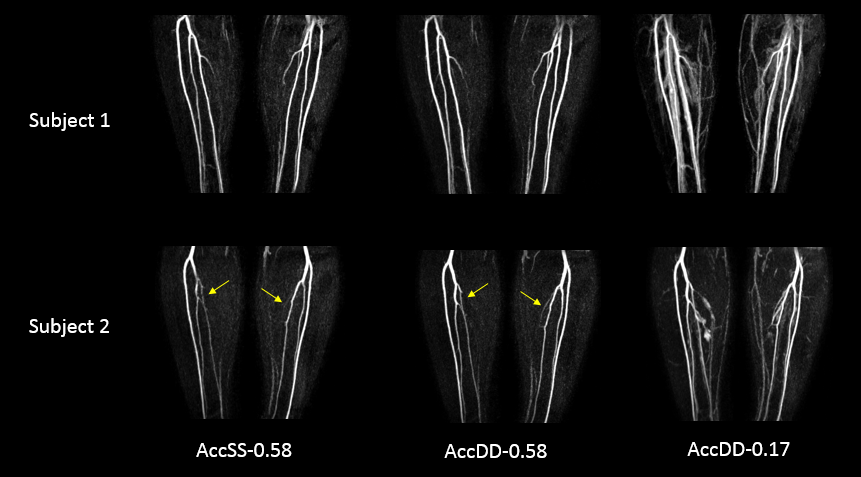
Representative images from two subjects generated from AccSS-0.58, AccDD-0.58 and AccDD-0.17 are shown in Figure 4. AccSS-0.58 and AccDD-0.58 selectively visualizes artery. AccDD-0.17 visualized small artery branches that are not visualized in other acquisitions, veins are also depicted though.
The average CNRs in each segment are shown in Figure 5. The CNRs in AccDD-0.58 were significantly higher in all segments except PTA1 and PTA2 compared with AccSS-0.58, indicating that double labeling is effective. The CNRs in AccDD-0.17 were significantly highest in all segments except PTA1 in three acquisitions.
In the visual assessment of vein signal, scores in AccSS-0.58 and AccDD-0.58 were completely same in all subjects and range was 2 and 3 (average: 2.4), indicating high artery selectivity. Scores in AccDD-0.17 was all 1 except one subject (average: 1.2), indicating vein signal can interfere with arterial visualization.
These results suggest AccDD-0.58 is optimal. However, slow arterial flow is expected in vascular disease patients. As flow in the vein is in general slower than artery, the fact that AccDD-0.17 visualizes vein in normal subjects suggests it could be used for patients with slow arterial flow. Further clinical investigation is ongoing.
Conclusion
Double labeling increases artery visualization without triggering compared to single labeling. Dual AENC suggests consistent artery visualization in a wide velocity range, while only 50% scan time extension compared to conventional approach. Further clinical investigation is needed to assess if AccDD can consistently provide diagnostic quality angiography.Acknowledgements
No acknowledgement found.References
1. Schmid S, et al. Magn Reson Med. 2014; 71(1): 191-199.
2. Priest AN, et al. Magn Reson Med. 2014; 72(3): 699-706.
3. Obara M, et al. Magn Reson Med. 2017; 77(5): 1996-2004.
4. Andrew J. Wheaton, et al. J Magn Reson Imaging. 2012; 36:286-304
5. Akamine Y, et al. Magn Reson Med. In Press.
Figures