2050
Clinical evaluation of a two-heartbeat inversion-recovery-based myocardial T1 mapping at 1.5T1School of Biomedical Engineering and Imaging Sciences, Faculty of Life Sciences and Medicine, King's College London, London, United Kingdom, 2MR Research Collaborations, Siemens Healthcare Limited, Frimley, United Kingdom
Synopsis
Cardiomyopathies can be revealed in the presence of abnormal native myocardial T1 times. Conventional myocardial T1 mapping techniques often require relatively long breathholds, thus limiting their usages in patients with severe breathholding difficulties. In this work, we evaluated the potential of a two-heartbeat inversion-recovery-based myocardial T1 mapping in patients.
Introduction
Cardiomyopathies can be revealed in the presence of abnormal native myocardial T1 times1. Conventional myocardial T1 mapping techniques, such as modified Look-Locker inversion recovery (MOLLI)2,3, often require 7-13 T1-weighted image acquisitions in a single breathold of 9-17 heartbeats2-7. However, they may be clinically infeasible for patients with severe breathholding difficulties, such as chronic pulmonary disease8. In this work, we evaluated the potential of a two-heartbeat inversion-recovery-based myocardial T1 mapping in patients at 1.5T.Methods
(1) Experiments: Conventional 5-(3)-3 MOLLI sequences were performed in patients on a 1.5T scanner (MAGNETOM Aera, Siemens Healthcare, Erlangen, Germany). 24 patients (17 male, 53±17yr) were recruited for native myocardial T1 mapping and 18 patients among them also underwent post-contrast myocardial T1 mapping. The sequences used 2D bSSFP single-shots in the short-axis orientation: TR/TE/α 2.7ms/1.1ms/35°, FOV 360×306mm2, 1.4×2.1mm2 pixel, 3 slices with thickness 8mm, GRAPPA factor 2, partial Fourier factor 7/8, bandwidth 1085Hz/px, first inversion time 100ms. T1 maps were reconstructed using: (i) the standard MOLLI reconstruction (three-parameter fitting model2 with Look-Locker correction2 and inversion factor correction9); (ii) a novel one-parameter (OP) fitting model based reconstruction using the first two images only (referred to as OP2, mimicking the proposed two-heartbeat T1 mapping scheme).
(2) OP2 reconstruction: In OP2, T1 fitting was achieved by an exhaustive search over a normalized signal dictionary. This dictionary was created using the OP fitting model S(TI)=1-(1+δ)e-TI/T1 in a 100-2200ms T1 range, where δ≤1 is the inversion factor9 of the inversion pulse and TI the inversion time between the inversion preparation and image acquisition. Bloch simulations were applied to estimate the slice profiles of the non-selective hyperbolic-tangent inversion pulse assuming typical B0/B1 inhomogeneities (80-100%/±150Hz) and myocardial T1/T2=400-1600/45ms. δ=0.96 as the corresponding in-slice average was then used in dictionary creation. Two procedures were undergone before dictionary matching: (i) the signal polarity was restored based on a phase-sensitive reconstruction10; (ii) the polarity-restored signal was individually scaled to each dictionary entry.
(3) Data analyses: Native T1 map quality was subjectively evaluated for both approaches by consensus of 2 experienced cardiac MRI readers. Scoring was based on image artifacts, myocardium/blood pool delineation and myocardium homogeneity using a 5-point-scale system (1-non-diagnostic/2-poor/3-fair/4-good/5-excellent)11. Native/post-contrast T1 times in each myocardial segment12 and the blood pool were measured. Myocardial segments with severe artifacts were discarded from the following quantitative analysis. Subject-wise myocardial/blood T1 times and partition coefficients were evaluated. Pearson correlation coefficients between both techniques for native/post-contrast myocardial/blood T1 times as well as partition coefficients were measured.
Results
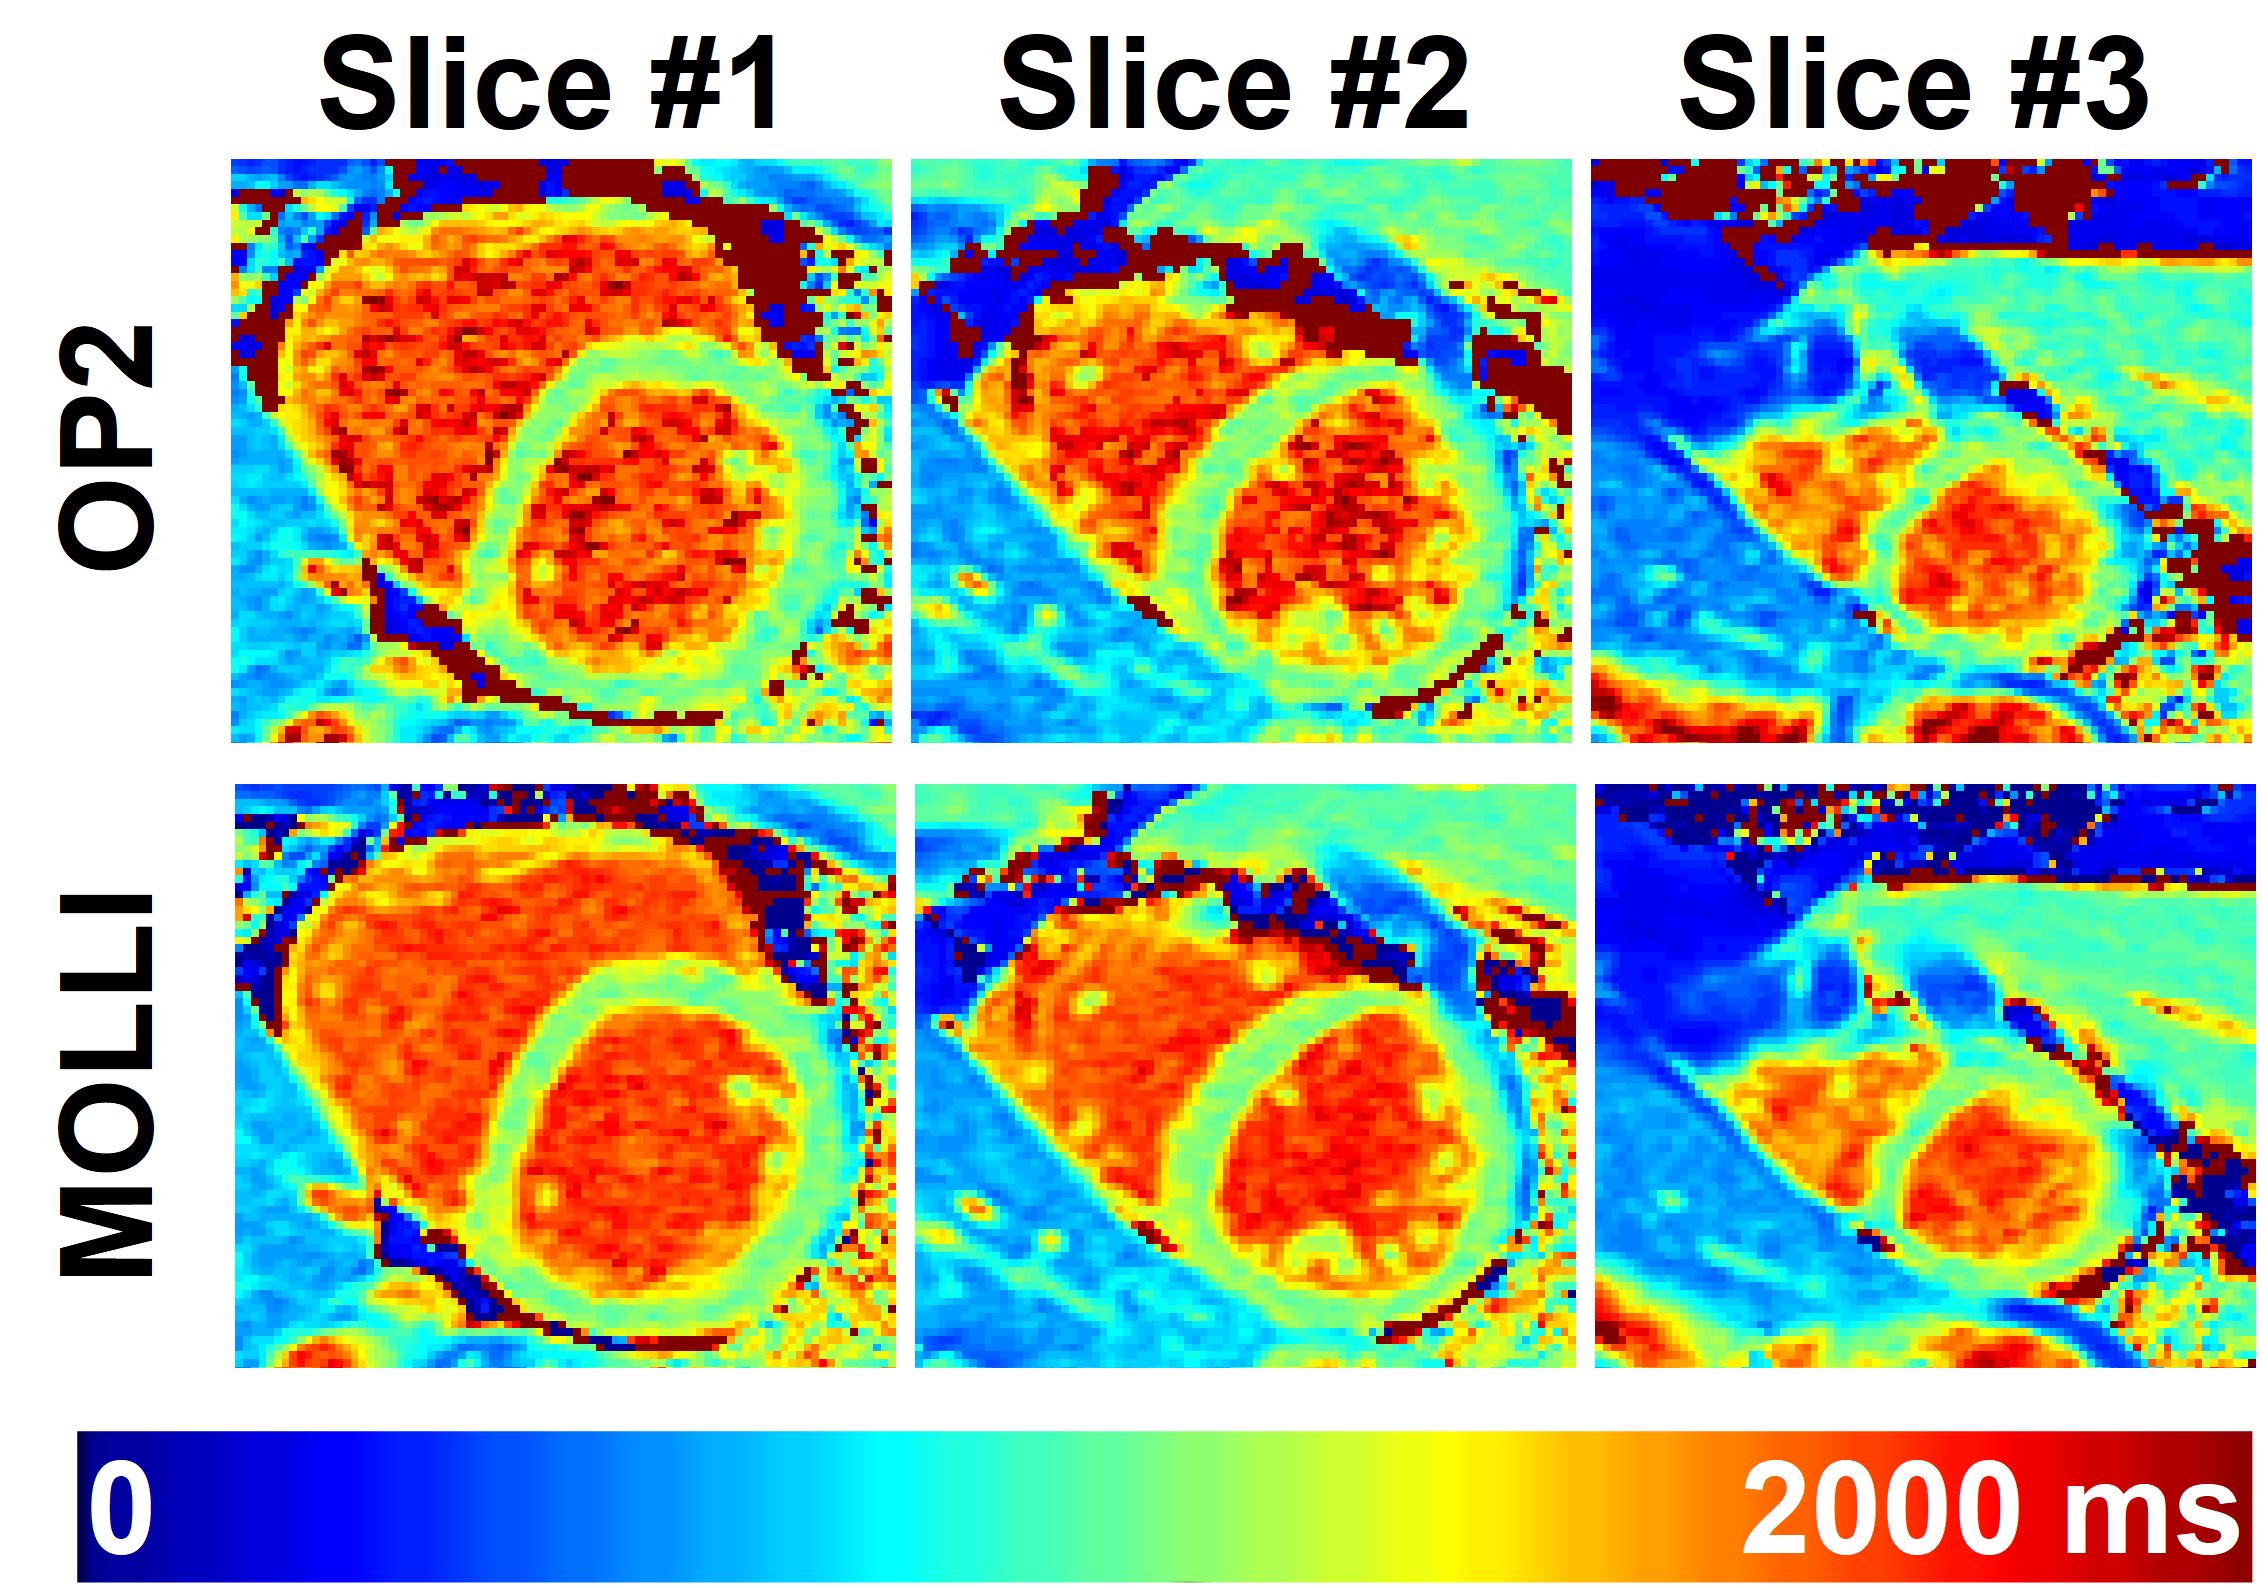
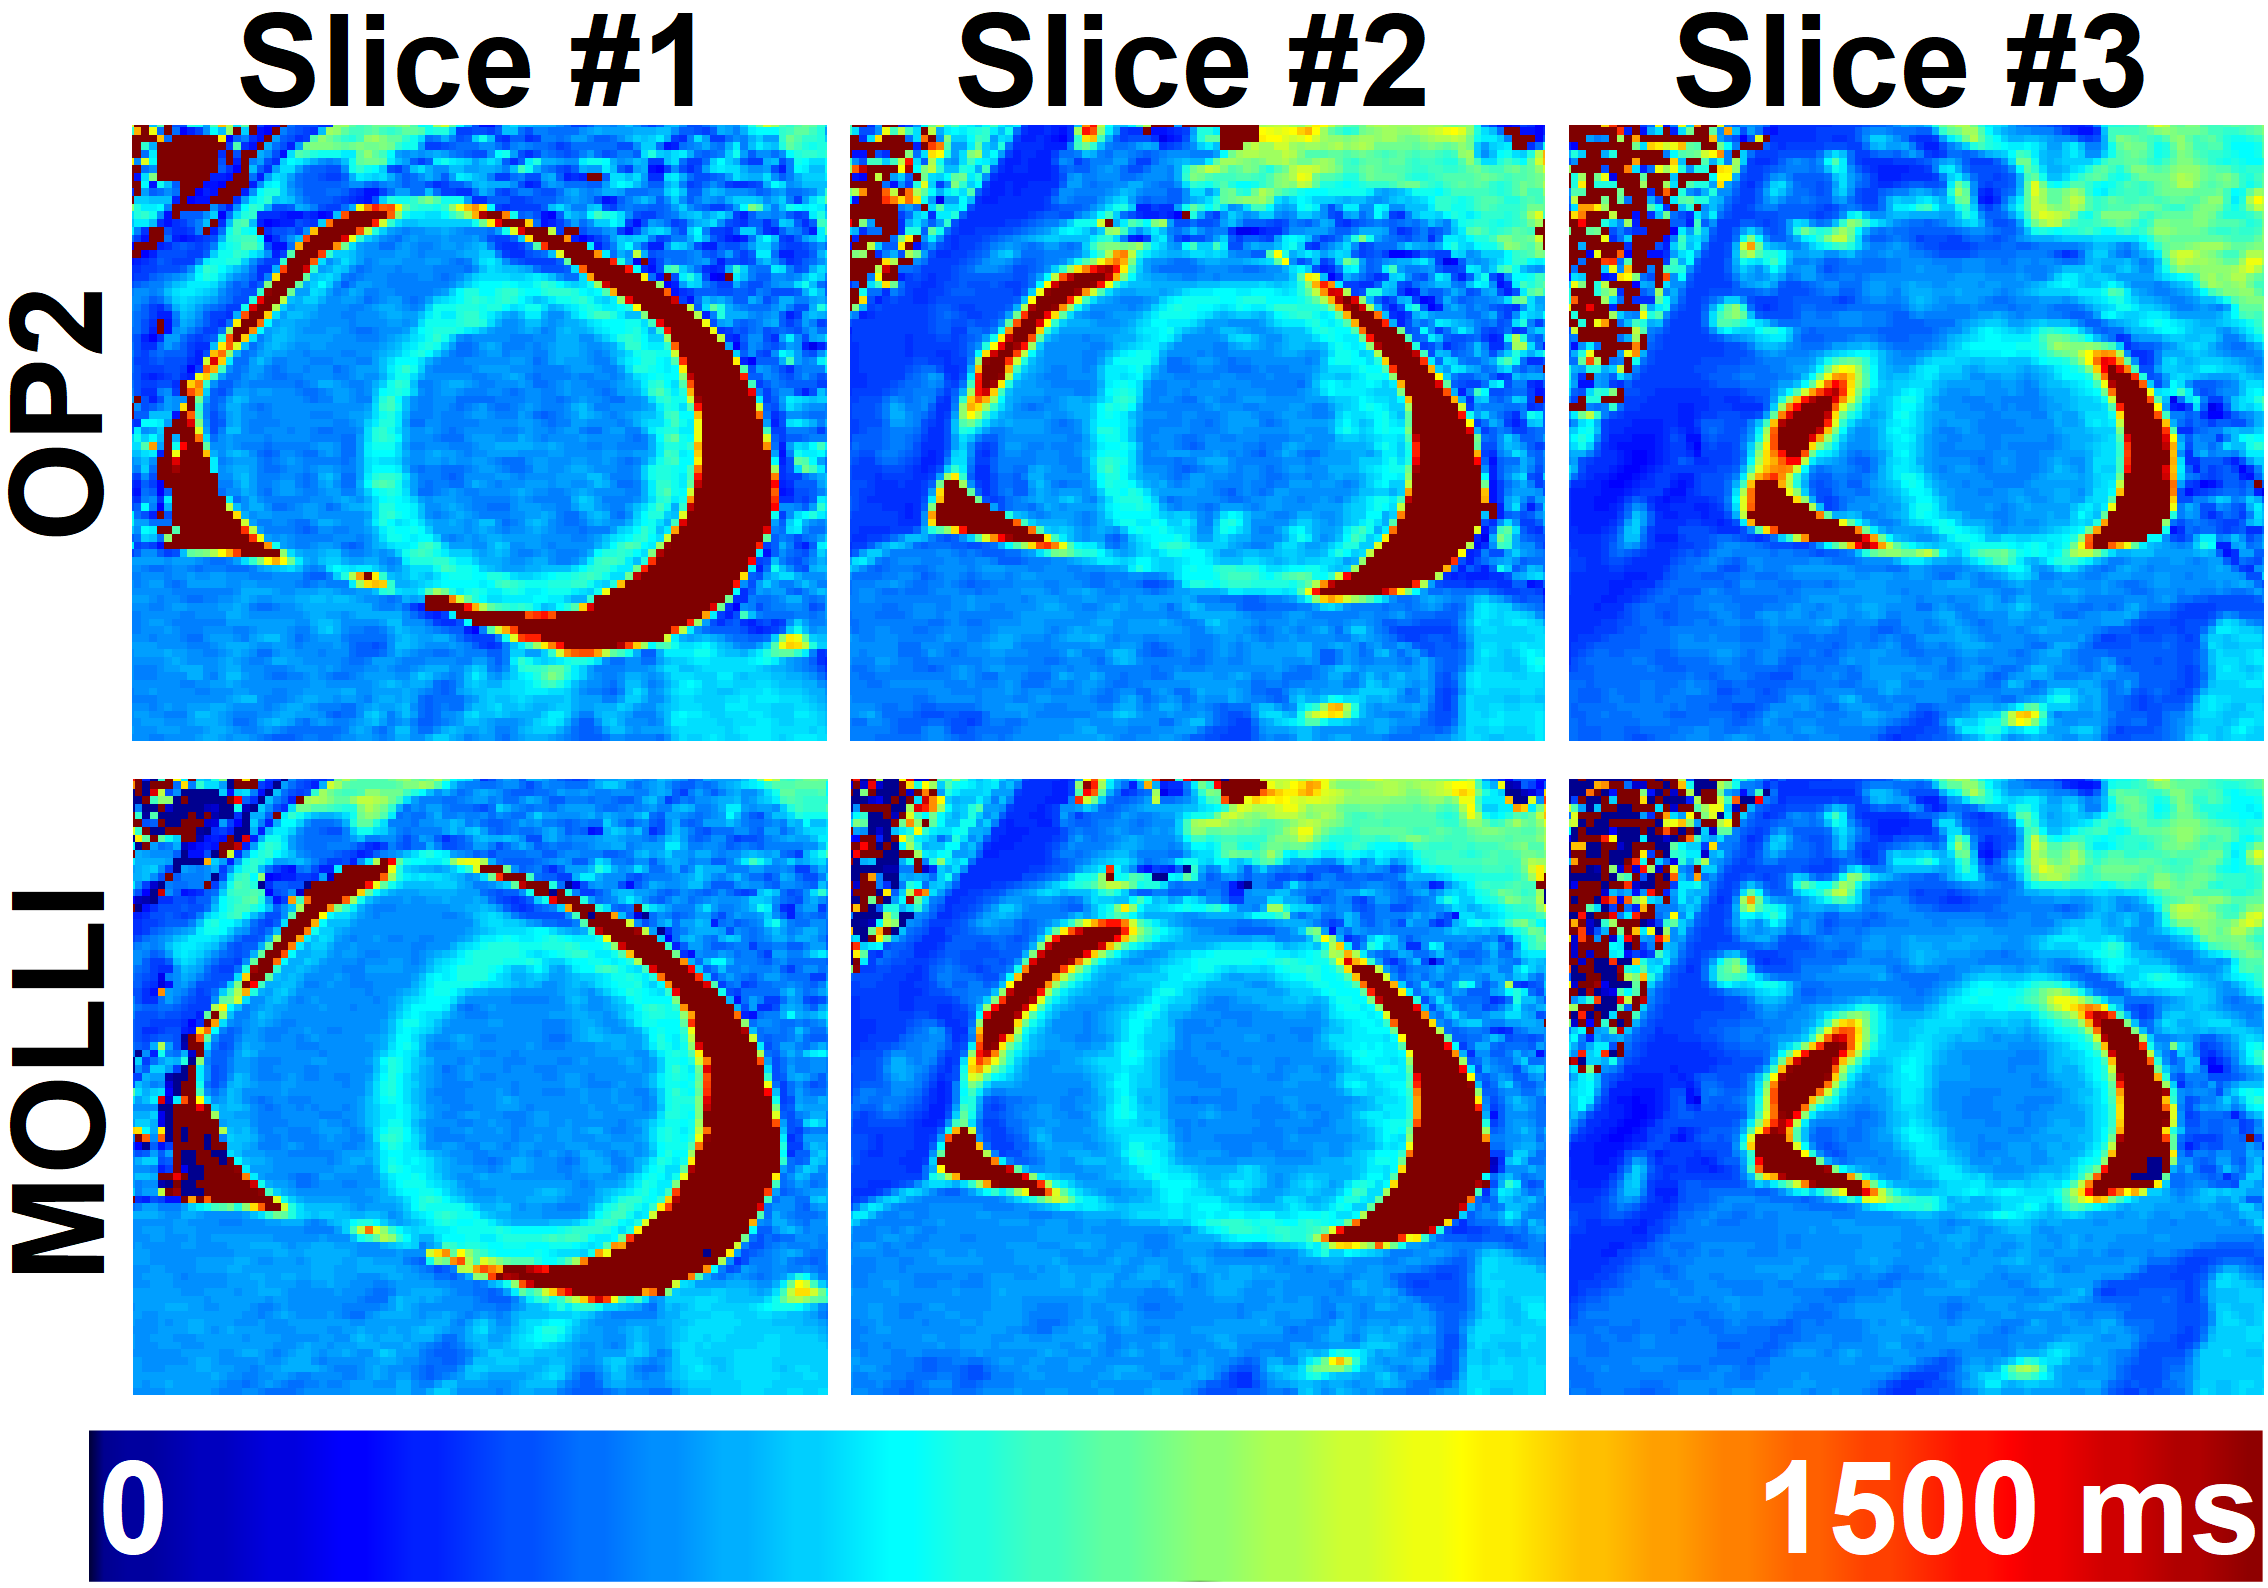
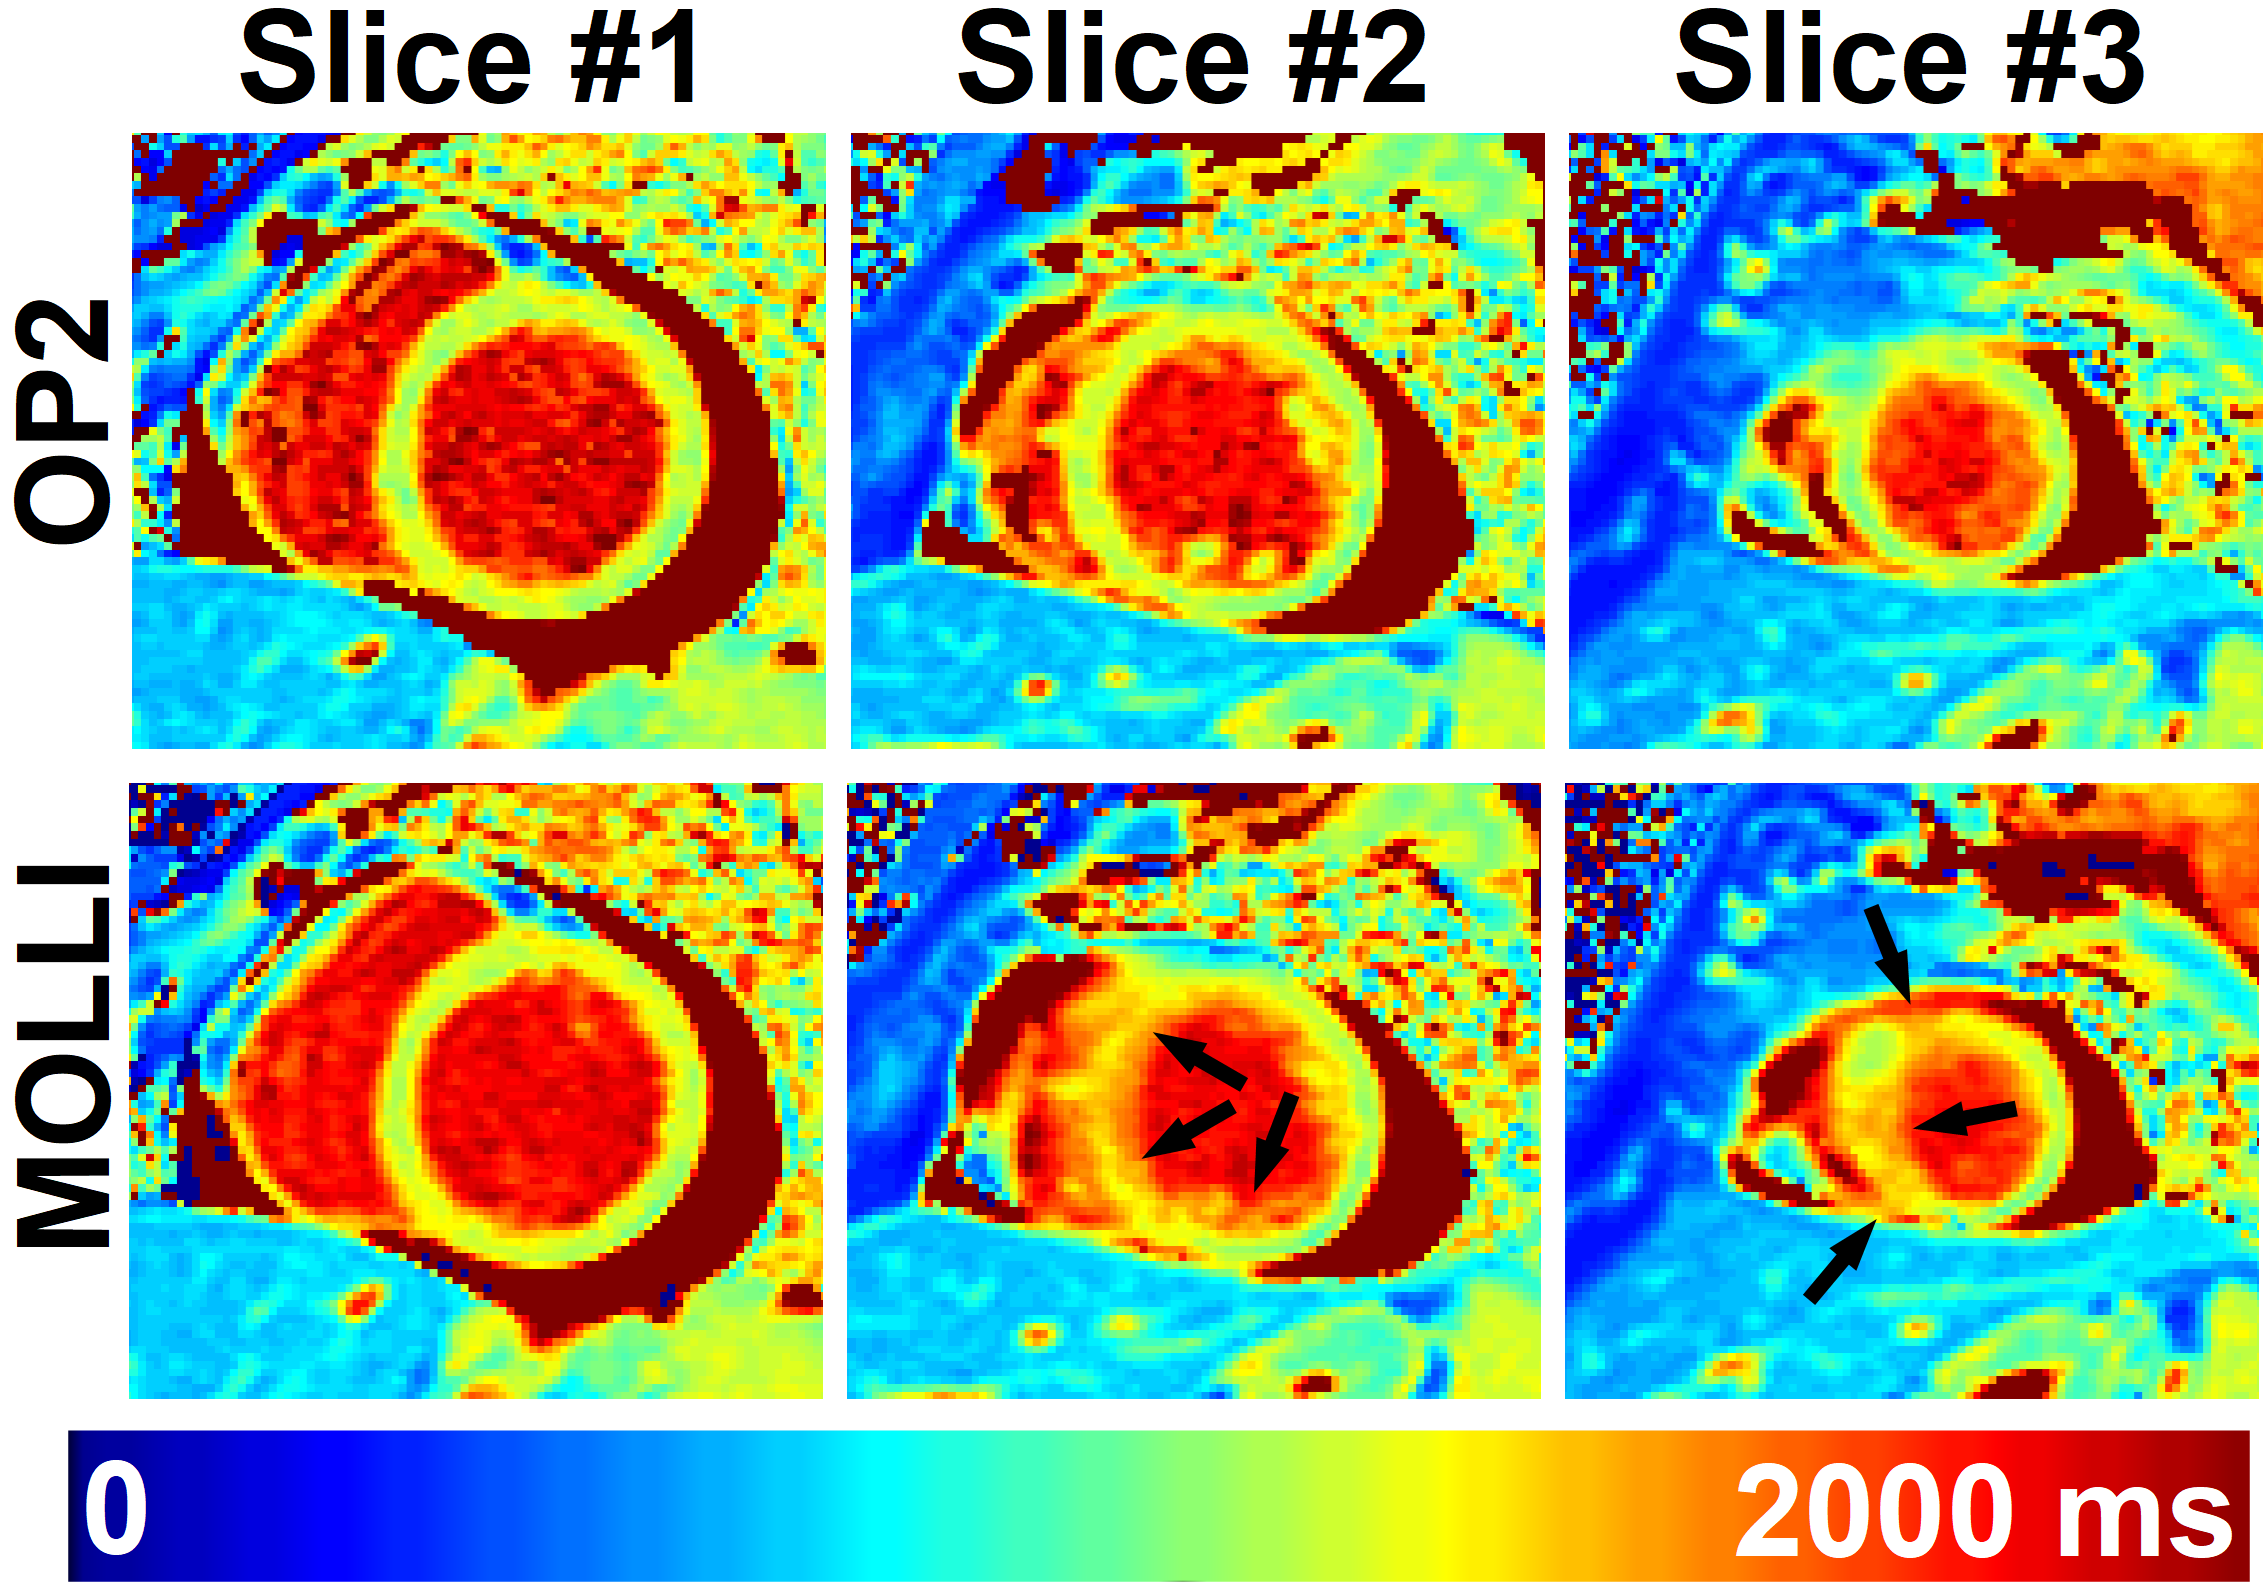
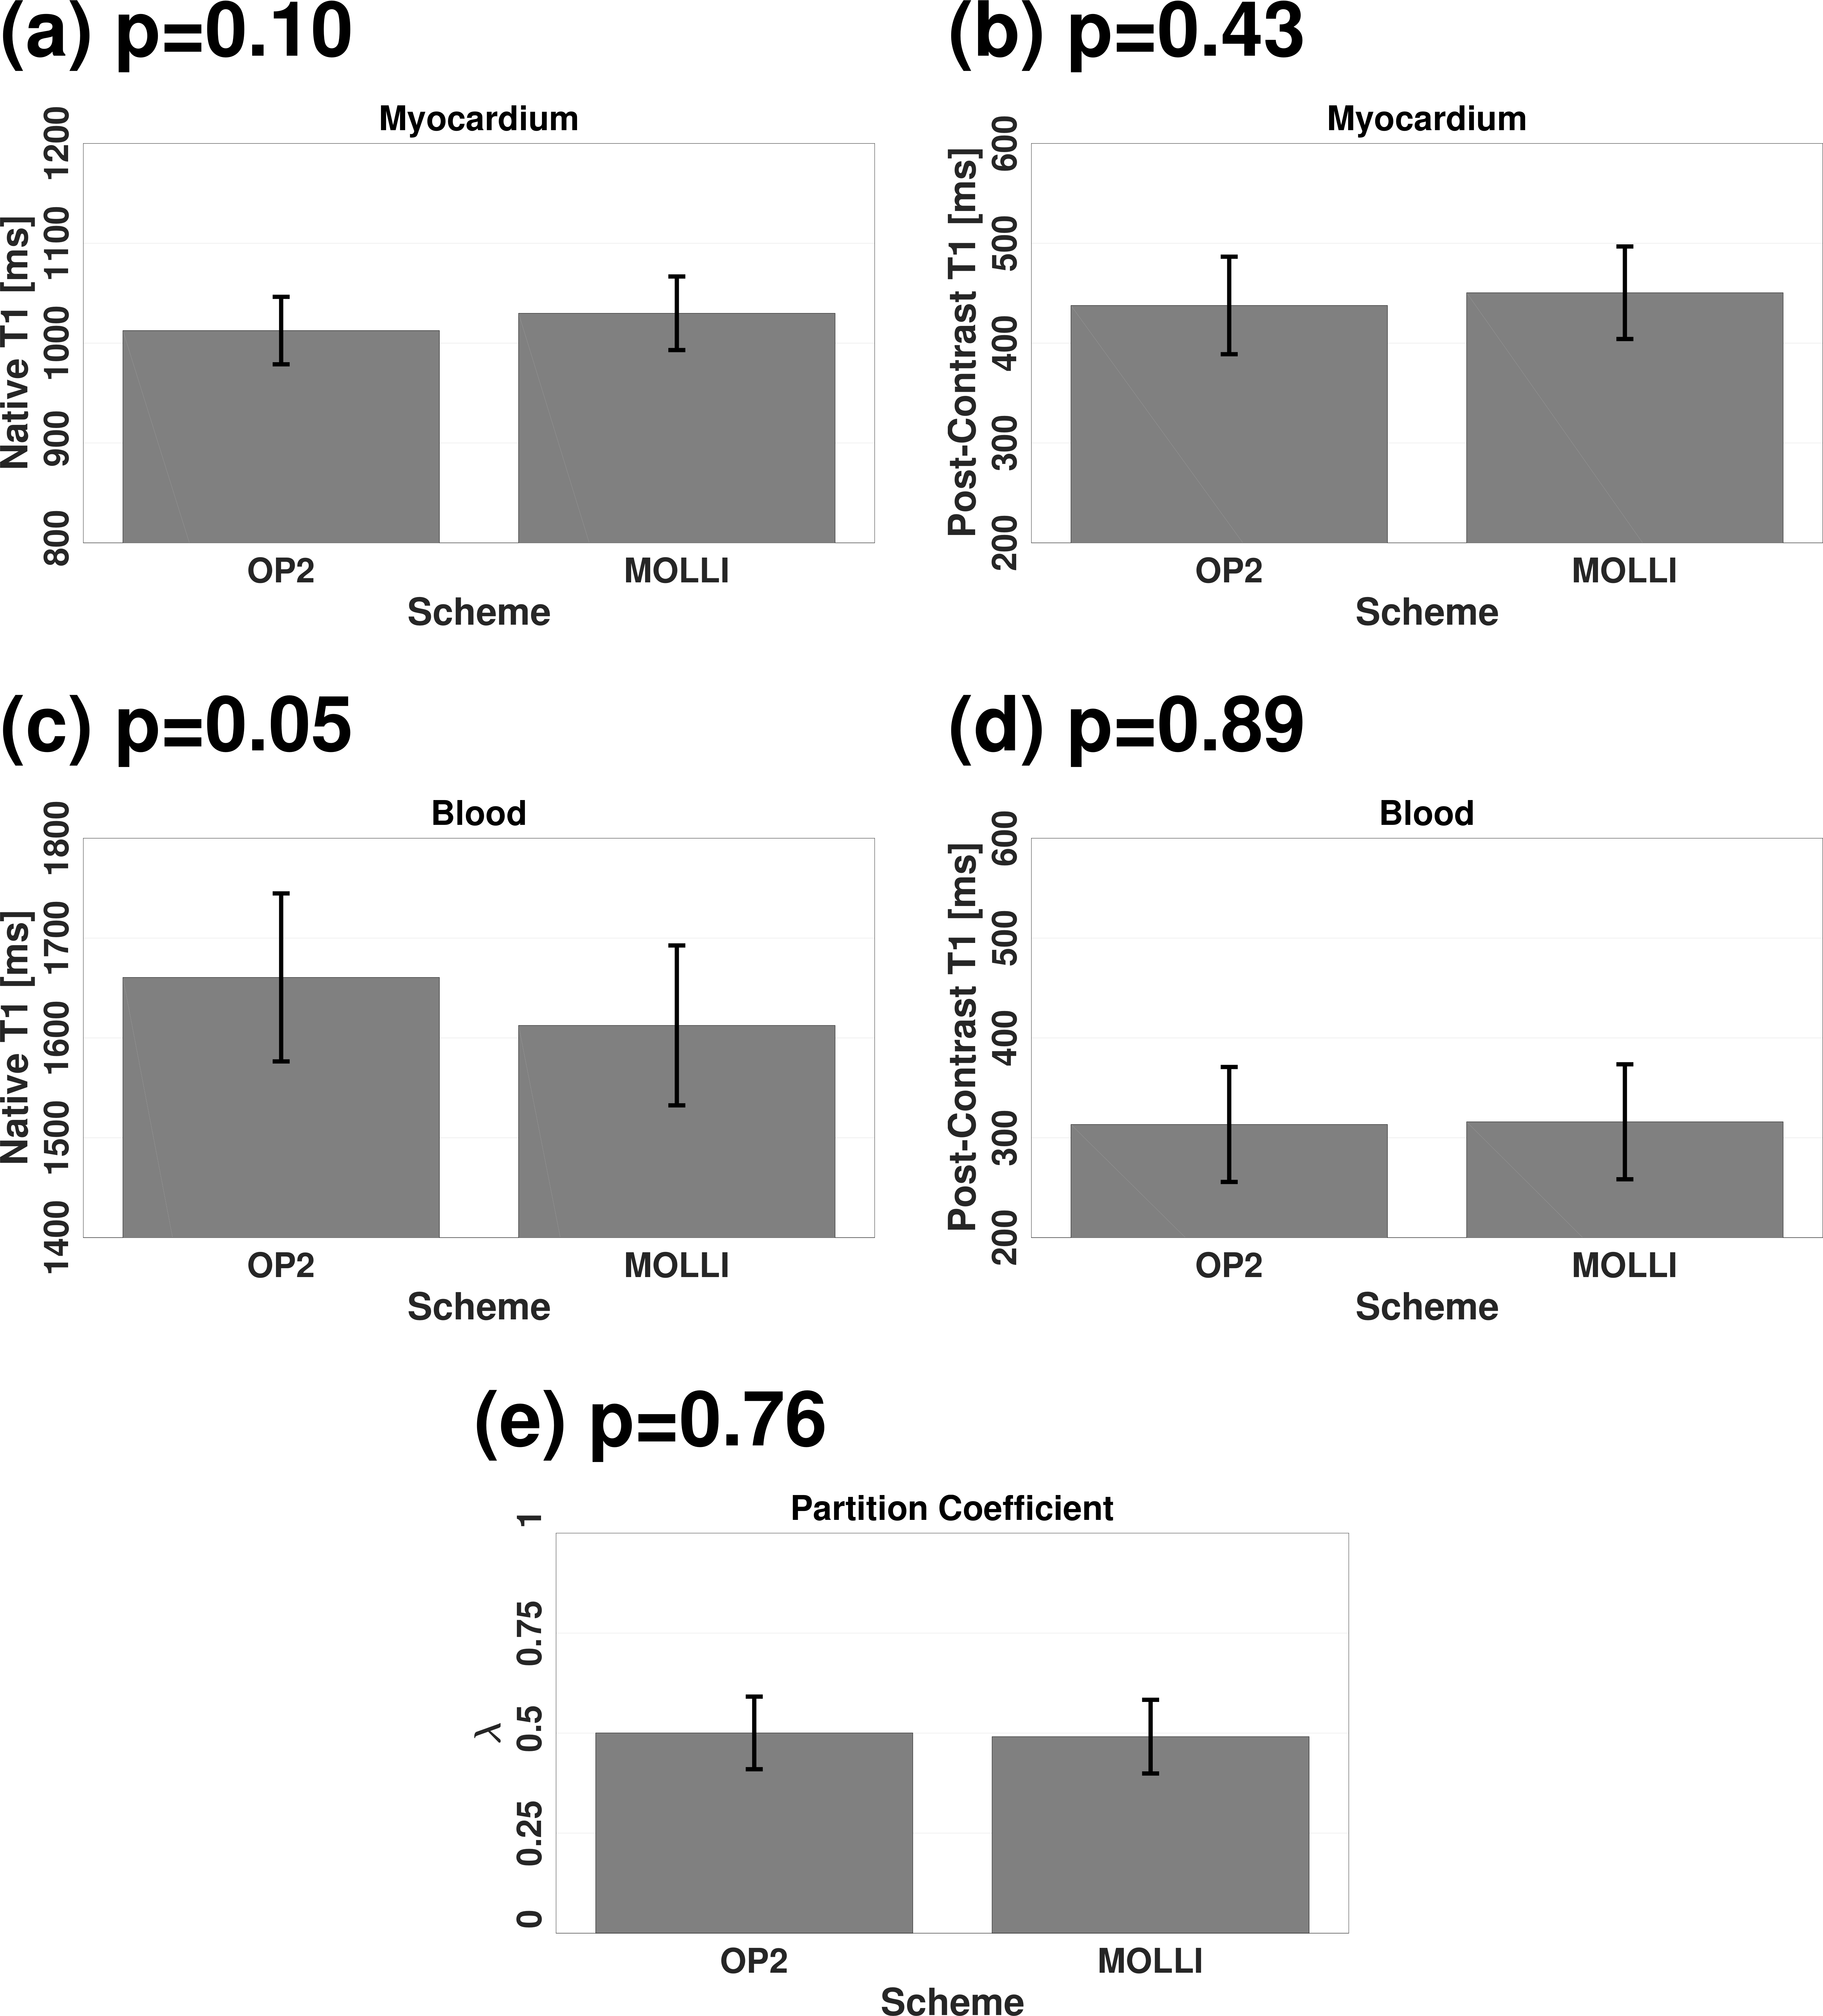
Fig. 1 and Fig. 2 show representative example native and post-contrast T1 maps obtained using both techniques, respectively. Despite the limited increase of noise using OP2, both techniques resulted in similar visual map quality and T1 ranges. Fig. 3 presents the superiority of OP2 to MOLLI in a patient with breathhold failure. Through all 144 T1 maps, OP2 led to similar subjective map quality rating as MOLLI (4.3±0.5 vs. 4.4±0.5, p=1.00). Compared to MOLLI, OP2 yielded similar (Fig. 4, p≥0.05) and highly linearly correlated (Fig. 5, Pearson correlation coefficient≥0.81) native/post-contrast myocardial/blood T1 times and partition coefficients.Discussion
To avoid bias introduced using different amounts of T1-weighted images in both approaches, retrospective motion correction was excluded in this work. The proposed OP2 showed potential to increase patient comfort and reduce total scan time. Future studies in a larger patient cohort are now warranted.Conclusion
In this work, clinical feasibility of the proposed two-heartbeat inversion-recovery-based myocardial T1 mapping was evaluated in patients. Compared to MOLLI, the proposed approach led to mild noise enhancement, similar subjective map quality and highly linearly correlated T1 times as well as partition coefficients.Acknowledgements
This work was supported by the Health Innovation Challenge Fund (grant number HICF-R10-698), a parallel funding partnership between the Department of Health and the Wellcome Trust, the Wellcome Engineering and Physical Sciences Research Council (EPSRC) Centre for Medical Engineering at King's College London (WT 203148/Z/16/Z) and the EPSRC grant (EP/R010935/1). This research was also supported by the National Institute for Health Research (NIHR) Biomedical Research Centre based at Guy's and St Thomas' National Health Service (NHS) Foundation Trust in partnership with King's College London, and by the NIHR Healthcare Technology Co-operative for Cardiovascular Disease at Guy’s and St Thomas' NHS Foundation Trust. The views expressed are those of the authors and not necessarily those of the NHS, the NIHR or the Department of Health.References
- Moon JC, Messroghli DR, Kellman P, Piechnik SK, Robson MD, Ugander M, Gatehouse PD, Arai AE, Friedrich MG, Neubauer S, Schulz-Menger J, Schelbert EB. Myocardial T1 mapping and extracellular volume quantification: a Society for Cardiovascular Magnetic Resonance (SCMR) and CMR Working Group of the European Society of Cardiology consensus statement. J Cardiovasc Magn Reson. 2013;15(1):92.
- Messroghli DR, Radjenovic A, Kozerke S, Higgins DM, Sivananthan MU, Ridgway JP. Modified Look-Locker inversion recovery (MOLLI) for high-resolution T1 mapping of the heart. Magn Reson Med. 2004;52(1):141-146.
- Messroghli DR, Niendorf T, Schulz-Menger J, Dietz R, Friedrich MG. T1 mapping in patients with acute myocardial infarction. J Cardiovasc Magn Reson. 2003;5(2):353-359.
- Roujol S, Weingärtner S, Foppa M, Chow K, Kawaji K, Ngo LH, Kellman P, Manning WJ, Thompson RB, Nezafat R. Accuracy, precision, and reproducibility of four T1 mapping sequences: a head-to-head comparison of MOLLI, ShMOLLI, SASHA, and SAPPHIRE. Radiology. 2014;272(3):683-689.
- Kellman P, Hansen MS. T1-mapping in the heart: accuracy and precision. J Cardiovasc Magn Reson. 2014;16(1):2.
- Weingärtner S, Meßner NM, Budjan J, Loßnitzer D, Mattler U, Papavassiliu T, Zöllner FG, Schad LR. Myocardial T 1-mapping at 3T using saturation-recovery: reference values, precision and comparison with MOLLI. J Cardiovasc Magn Reson. 2017;18(1):84.
- Piechnik SK, Ferreira VM, Dall'Armellina E, Cochlin LE, Greiser A, Neubauer S, Robson MD. Shortened Modified Look-Locker Inversion recovery (ShMOLLI) for clinical myocardial T1-mapping at 1.5 and 3 T within a 9 heartbeat breathhold. J Cardiovasc Magn Reson. 2010;12(1):69.
- Marks B, Mitchell DG, Simelaro JP. Breath-holding in healthy and pulmonary-compromised populations: effects of hyperventilation and oxygen inspiration. J Magn Reson Imaging. 1997;7(3):595-597.
- Kellman P, Herzka DA, Hansen MS. Adiabatic inversion pulses for myocardial T1 mapping. Magn Reson Med. 2014;71(4):1428-1434.
- Xue H, Greiser A, Zuehlsdorff S, Jolly MP, Guehring J, Arai AE, Kellman P. Phase-sensitive inversion recovery for myocardial T1 mapping with motion correction and parametric fitting. Magn Reson Med. 2013;69(5):1408-1420.
- Kellman P, Wilson JR, Xue H, Ugander M, Arai AE. Extracellular volume fraction mapping in the myocardium, part 1: evaluation of an automated method. J Cardiovasc Magn Reson. 2012;14:63.
- Cerqueira MD, Weissman NJ, Dilsizian V, Jacobs AK, Kaul S, Laskey WK, Pennell DJ, Rumberger JA, Ryan T, Verani MS. Standardized myocardial segmentation and nomenclature for tomographic imaging of the heart. A statement for healthcare professionals from the Cardiac Imaging Committee of the Council on Clinical Cardiology of the American Heart Association. Circulation. 2002;105(4):539-542.
Figures