2049
Initial Utility of Cardiac Magnetic Resonance Fingerprinting for Quantitative T1/T2 Parametric Mapping in Hypertrophic Cardiomyopathy1Harrington Heart and Vascular Institute (Cardiology), University Hospitals Cleveland Medical Center, Cleveland, OH, United States, 2Department of Biomedical Engineering, Case Western Reserve University, Cleveland, OH, United States, 3Radiology, University Hospital Policlinico “Tor Vergata”, Rome, Italy, 4Radiology, University Hospitals Cleveland Medical Center, Cleveland, OH, United States, 5Harrington Heart & Vascular Institute, Departments of Medicine and Radiology, University Hospitals Cleveland Medical Center, Cleveland, OH, United States
Synopsis
The performance of cardiac Magnetic Resonance Fingerprinting (cMRF) in tissue characterization in patients with hypertrophic cardiomyopathy (HCM) is not known. In this study, we report our experience in a small cohort of patients with HCM who have undergone cMRF and standard techniques for imagine acquisition of T1/T2 Mapping and extracellular volume (ECV) estimation.
Introduction
Hypertrophic cardiomyopathy (HCM) is a genetic disorder leading to abnormal myofibrillar proteins that result in profound alterations in myocardial architecture and fibrosis, potentially resulting to sudden cardiac death. There is substantial phenotypic variation in the amount of fibrosis (and propensity for sudden cardiac death), that necessitate quantitative fibrosis measures that are accurate, concordant and reproducible across scanners and field strengths. Traditional parametric mapping approaches such as native pre-contrast T1 as well as estimation of extracellular volume (ECV) fraction using late gadolinium enhancement (LGE) are promising methods to assess fibrosis. The use of cardiac Magnetic Resonance Fingerprinting (cMRF) approaches may offer some unique advantages over traditional methodologies for parametric mapping including stability over a range of heart rates that may translate into more reproducible values in clinical practice.1
Aim
The purpose of this study was to compare parametric values of T1 and T2 in patients with HCM versus healthy controls using cMRF.Methods
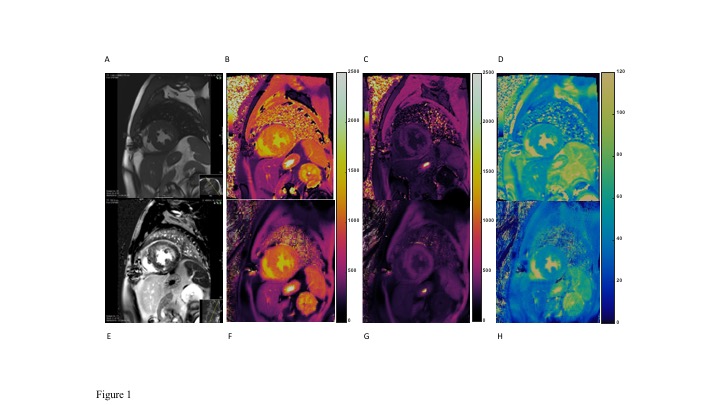
cMRF sequence was performed at 1.5T (Siemens Aera) in a prospective cohort of six HCM patients with either genetically confirmed or strong clinical suspicion based on diagnostic criteria. HCM patients were compared with twelve age- and sex-balanced control subjects without HCM or hypertrophy. The cMRF pulse sequence was performed as previously described.2 Briefly, a15-heartbeat cMRF sequence was used to acquire data at end-diastole with ECG triggering during a breath-hold. An inversion pulse was employed in the first heartbeat; T2-preparation pulses were employed in the third, fourth, and fifth heartbeats with echo times of 30ms, 50ms, and 80ms. No magnetization preparation pulse was used in the second heartbeat. This 5-heartbeat scheme was repeated three times resulting in an acquisition with a total of 15-heartbeats. A constant TR of 5.1ms and ramped flip angles between 4° to 25° were used. 50 excitations were collected in each heartbeat, leading to an acquisition window of ~255ms. FOV was 300×300 mm2; matrix size was 192×192; and slice thickness was 8mmA 15-heartbeat. No corrections for slice profile or inversion efficiency were included in the cMRF dictionary. Conventional mapping was performed during the same scan session using Modified Look Locker Imaging (MOLLI) and T2-prepared balanced SSFP, which are part of the Siemens MyoMaps Package. Myocardial pre- and post-contrast T1 and T2 values were measured by placing a ROI within each myocardial segment derived from the standard AHA model at a midventricular slice level. Pre- and post-contrast blood T1 values were measured by placing ROIs at the level of the blood pool in same slice used for the T1 and T2 estimation.Results
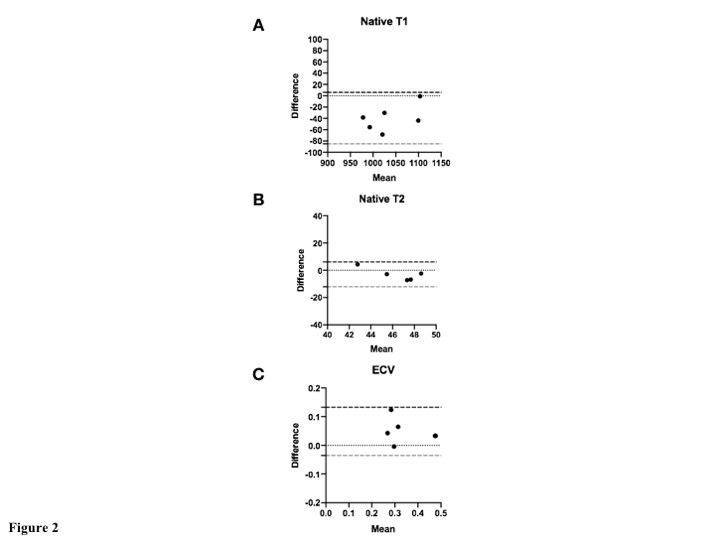
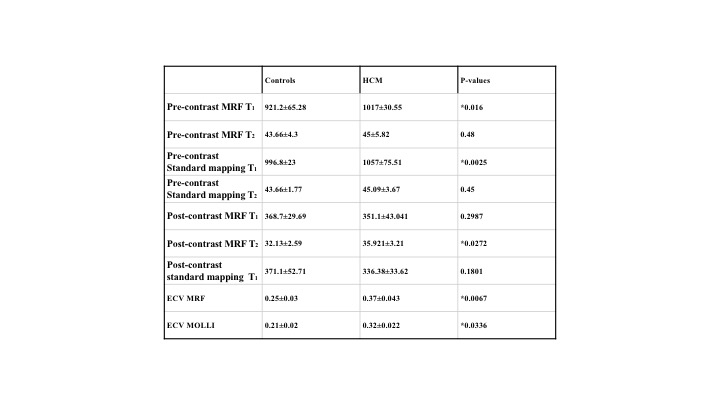
There were significant differences between control and clinical HCM in native T1 and ECV values when using both MOLLI and cMRF (Table 1).There was significance noted for post contrast T2 with cMRF sequences. However, there was no significant difference in pre-contrast T2 values for either T2-prepared bSSFP or cMRF. A Bland Altman analysis showed agreement between cMRF and conventional mapping from T1, T2 and ECV in HCM patients. (Figure 2).Discussion
Our findings demonstrate significantly different pre-contrast T1 and ECV values in a clinical cohort of HCM patients using both MOLLI and cMRF. Increases in native T1 and ECV in HCM as surrogates for fibrosis have indeed been noted in prior studies, including a linear relationship between myocardial collagen content derived from biopsy and post-contrast myocardial T1 time in HCM.3Conclusion
T1 and ECV were significantly higher in HCM compared to control subjects for both MOLLI and cMRF. No significant differences between groups were seen with pre-contrast T2. The T1 values with cMRF were consistently lower than MOLLI. These findings suggest that cMRF can reliably measure T1, T2, ECV values in HCM population. Future studies may need to investigate the utility of cMRF in fibrosis quantification and indeed the ability of this technique in advancing standardized values for mapping that are independent of MRI scanner.Acknowledgements
No acknowledgement found.References
1. Hamilton JI, Jiang Y, Chen Y, Ma D, Lo WC, Griswold M, Seiberlich N. MR fingerprinting for rapid quantification of myocardial T1, T2, and proton spin density. Magn. Reson. Med. 2017;77:1446–1458. doi: 10.1002/mrm.262162.
2. Hamilton JI, Jiang Y, Ma D, Pahwa S, Chen Y, Lo W-C, Griswold MA, Seiberlich N. A Comparison of 5-Heartbeat vs. 15-Heartbeat Cardiac MR Fingerprinting Sequences in Normal Volunteers. ISMRM Workshop. MRF 2017.3.
3. Ho CY, Abbasi SA, Neilan TG, Shah RV, Chen Y, Heydari B, et al. T1 measurements identify extracellular volume expansion in hypertrophic cardiomyopathy sarcomere mutation carriers with and without left ventricular hypertrophy. Circ Cardiovasc Imaging. 2013;6(3):415-22.
Figures