2048
Navigator Gated Cardiac Quantitative Susceptibility Mapping for Differential Oxygen Saturation Quantification: Initial Validation via Invasive Catheterization1Meinig School of Biomedical Engineering, Cornell University, New York, NY, United States, 2Radiology, Weill Cornell Medicine, New York, NY, United States, 3Radiology, Memorial Sloan Kettering Cancer Center, New York, NY, United States, 4Medicine, Weill Cornell Medicine, New York, NY, United States
Synopsis
The feasibility of measuring differential RV-to-LV oxygen saturation with cardiac quantitative susceptibility mapping (QSM) has been demonstrated in healthy volunteers; here, we present our initial validation of cardiac QSM based oxygenation measurement in patients through comparison with gold standard right heart catheter measurements.
INTRODUCTION
Differential right ventricle (RV) to left ventricle (LV) oxygen saturation ($$${\Delta}SaO_2$$$) measures the oxygenation difference between the blood in RV and LV, which can be an important indicator of cardiopulmonary function for assessing cardiac function in heart failure patients, and to measure shunt fractions in patients with congenital or acquired heart disease. Cardiac quantitative susceptibility mapping (QSM) is an emerging technique for non-invasive quantification of $$${\Delta}SaO_2$$$. In this work, we present our initial validation of QSM based oxygenation measurement through comparison with invasive right heart catheter measurements in patients.METHODS
Cardiac QSM was acquired in 26 patients via an ECG-triggered navigator-gated free-breathing multi-echo 3D GRE sequence at 20-30 min post gadolinium administration (typical resolution=1.5x1.5x5 mm3, R=2 parallel imaging acceleration). 9 of the patients also underwent right heart catheter measurement (RHC), from which a reference $$${\Delta}SaO_2$$$ was obtained for validation.
QSM maps were reconstructed by first preparing the total field via graph cut phase unwrapping1, and performing water/fat separation2 with chemical shift update3, followed by a field to source inversion using the preconditioned total field inversion method (pQSM)4. In this work, additional regularizations were added to the inversion to restrict the susceptibility variations within both the right and left ventricle blood pools (pQSM+0)5:
$$y^*=argmin_y\frac{1}{2}{\parallel}w(f-d{\otimes}Py){\parallel}^2_2+{\lambda\parallel}M_G{\triangledown}Py{\parallel}_1+{\lambda_{RV}\parallel}M_{RV}P(y-\overline{y}^{RV}){\parallel}^2_2+{\lambda_{LV}\parallel}M_{LV}P(y-\overline{y}^{LV}){\parallel}^2_2$$
The first two terms are the data fidelity term and structure consistency regularization term, respectively. The last two terms constrain the susceptibility variation in the RV and the LV blood pools, where $$$\lambda_{RV}$$$ and $$$\lambda_{LV}$$$ are the regularization parameters, $$$M_{RV}$$$ and $$$M_{LV}$$$ are the mask for RV and LV obtained through manual segmentation on the GRE images, and $$$\overline{y}^{RV}$$$ and $$$\overline{y}^{LV}$$$ are the average susceptibility over the RV and LV blood pools, respectively. The QSM map, $$$\chi$$$, is then $$$\chi=Py^*$$$. The RV-to-LV susceptibility difference in QSM was converted to $$${\Delta}SaO_2$$$ as described in our previous work6.
RESULTS
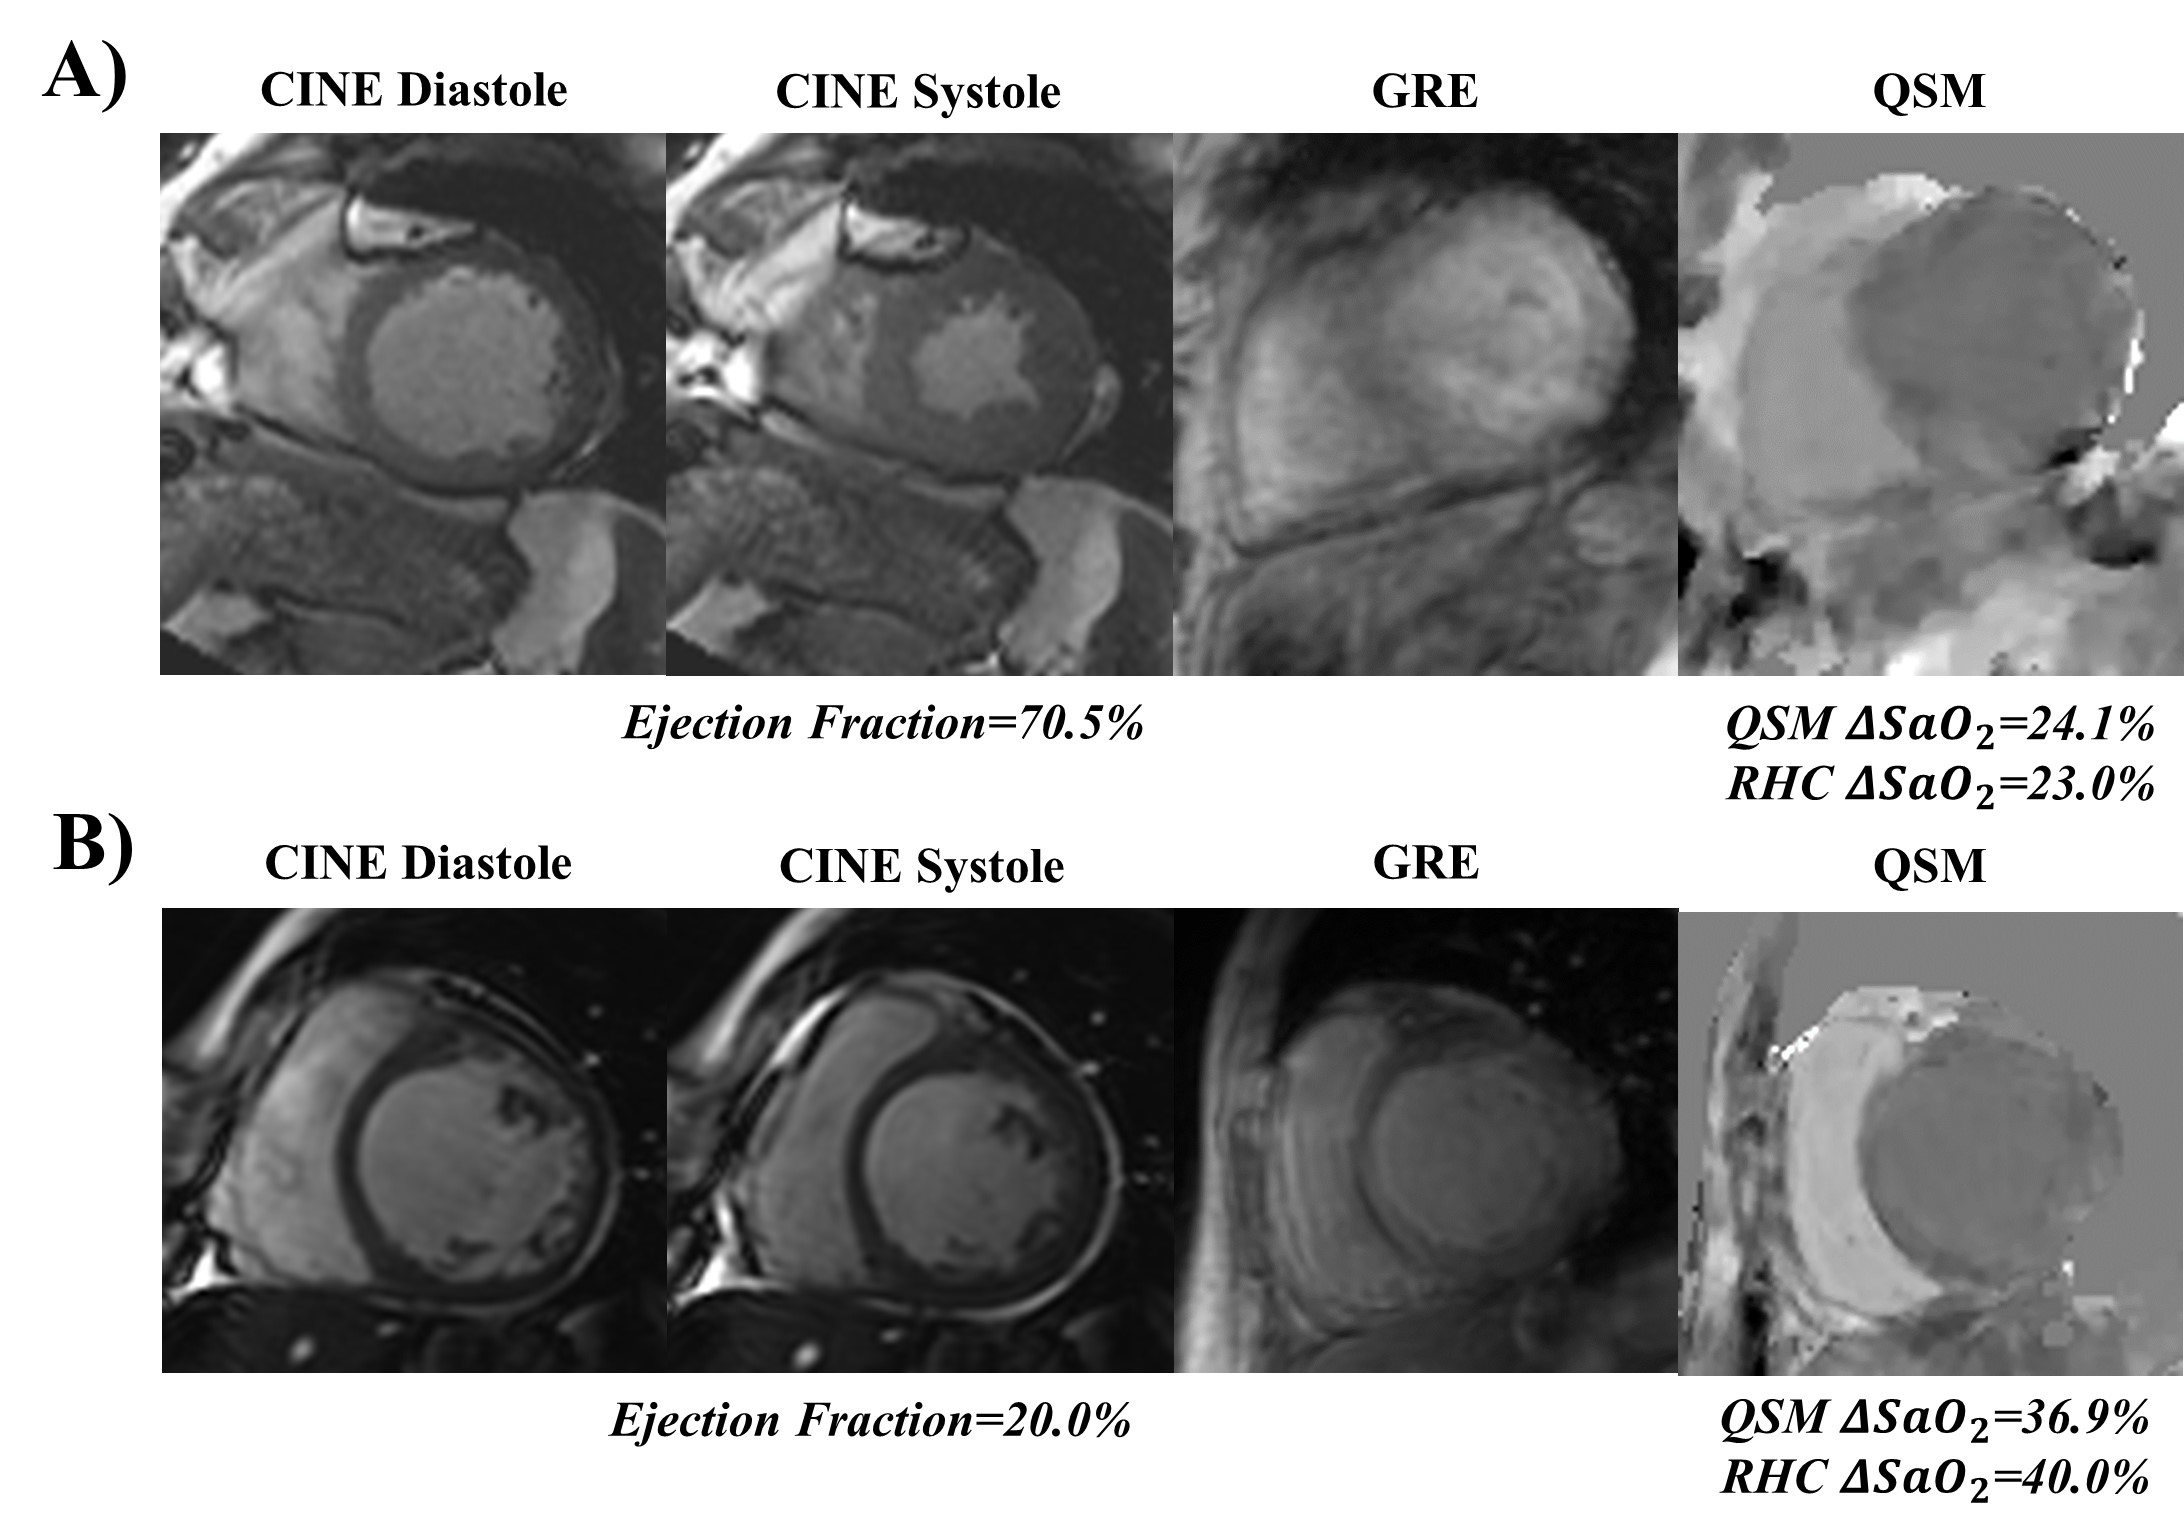
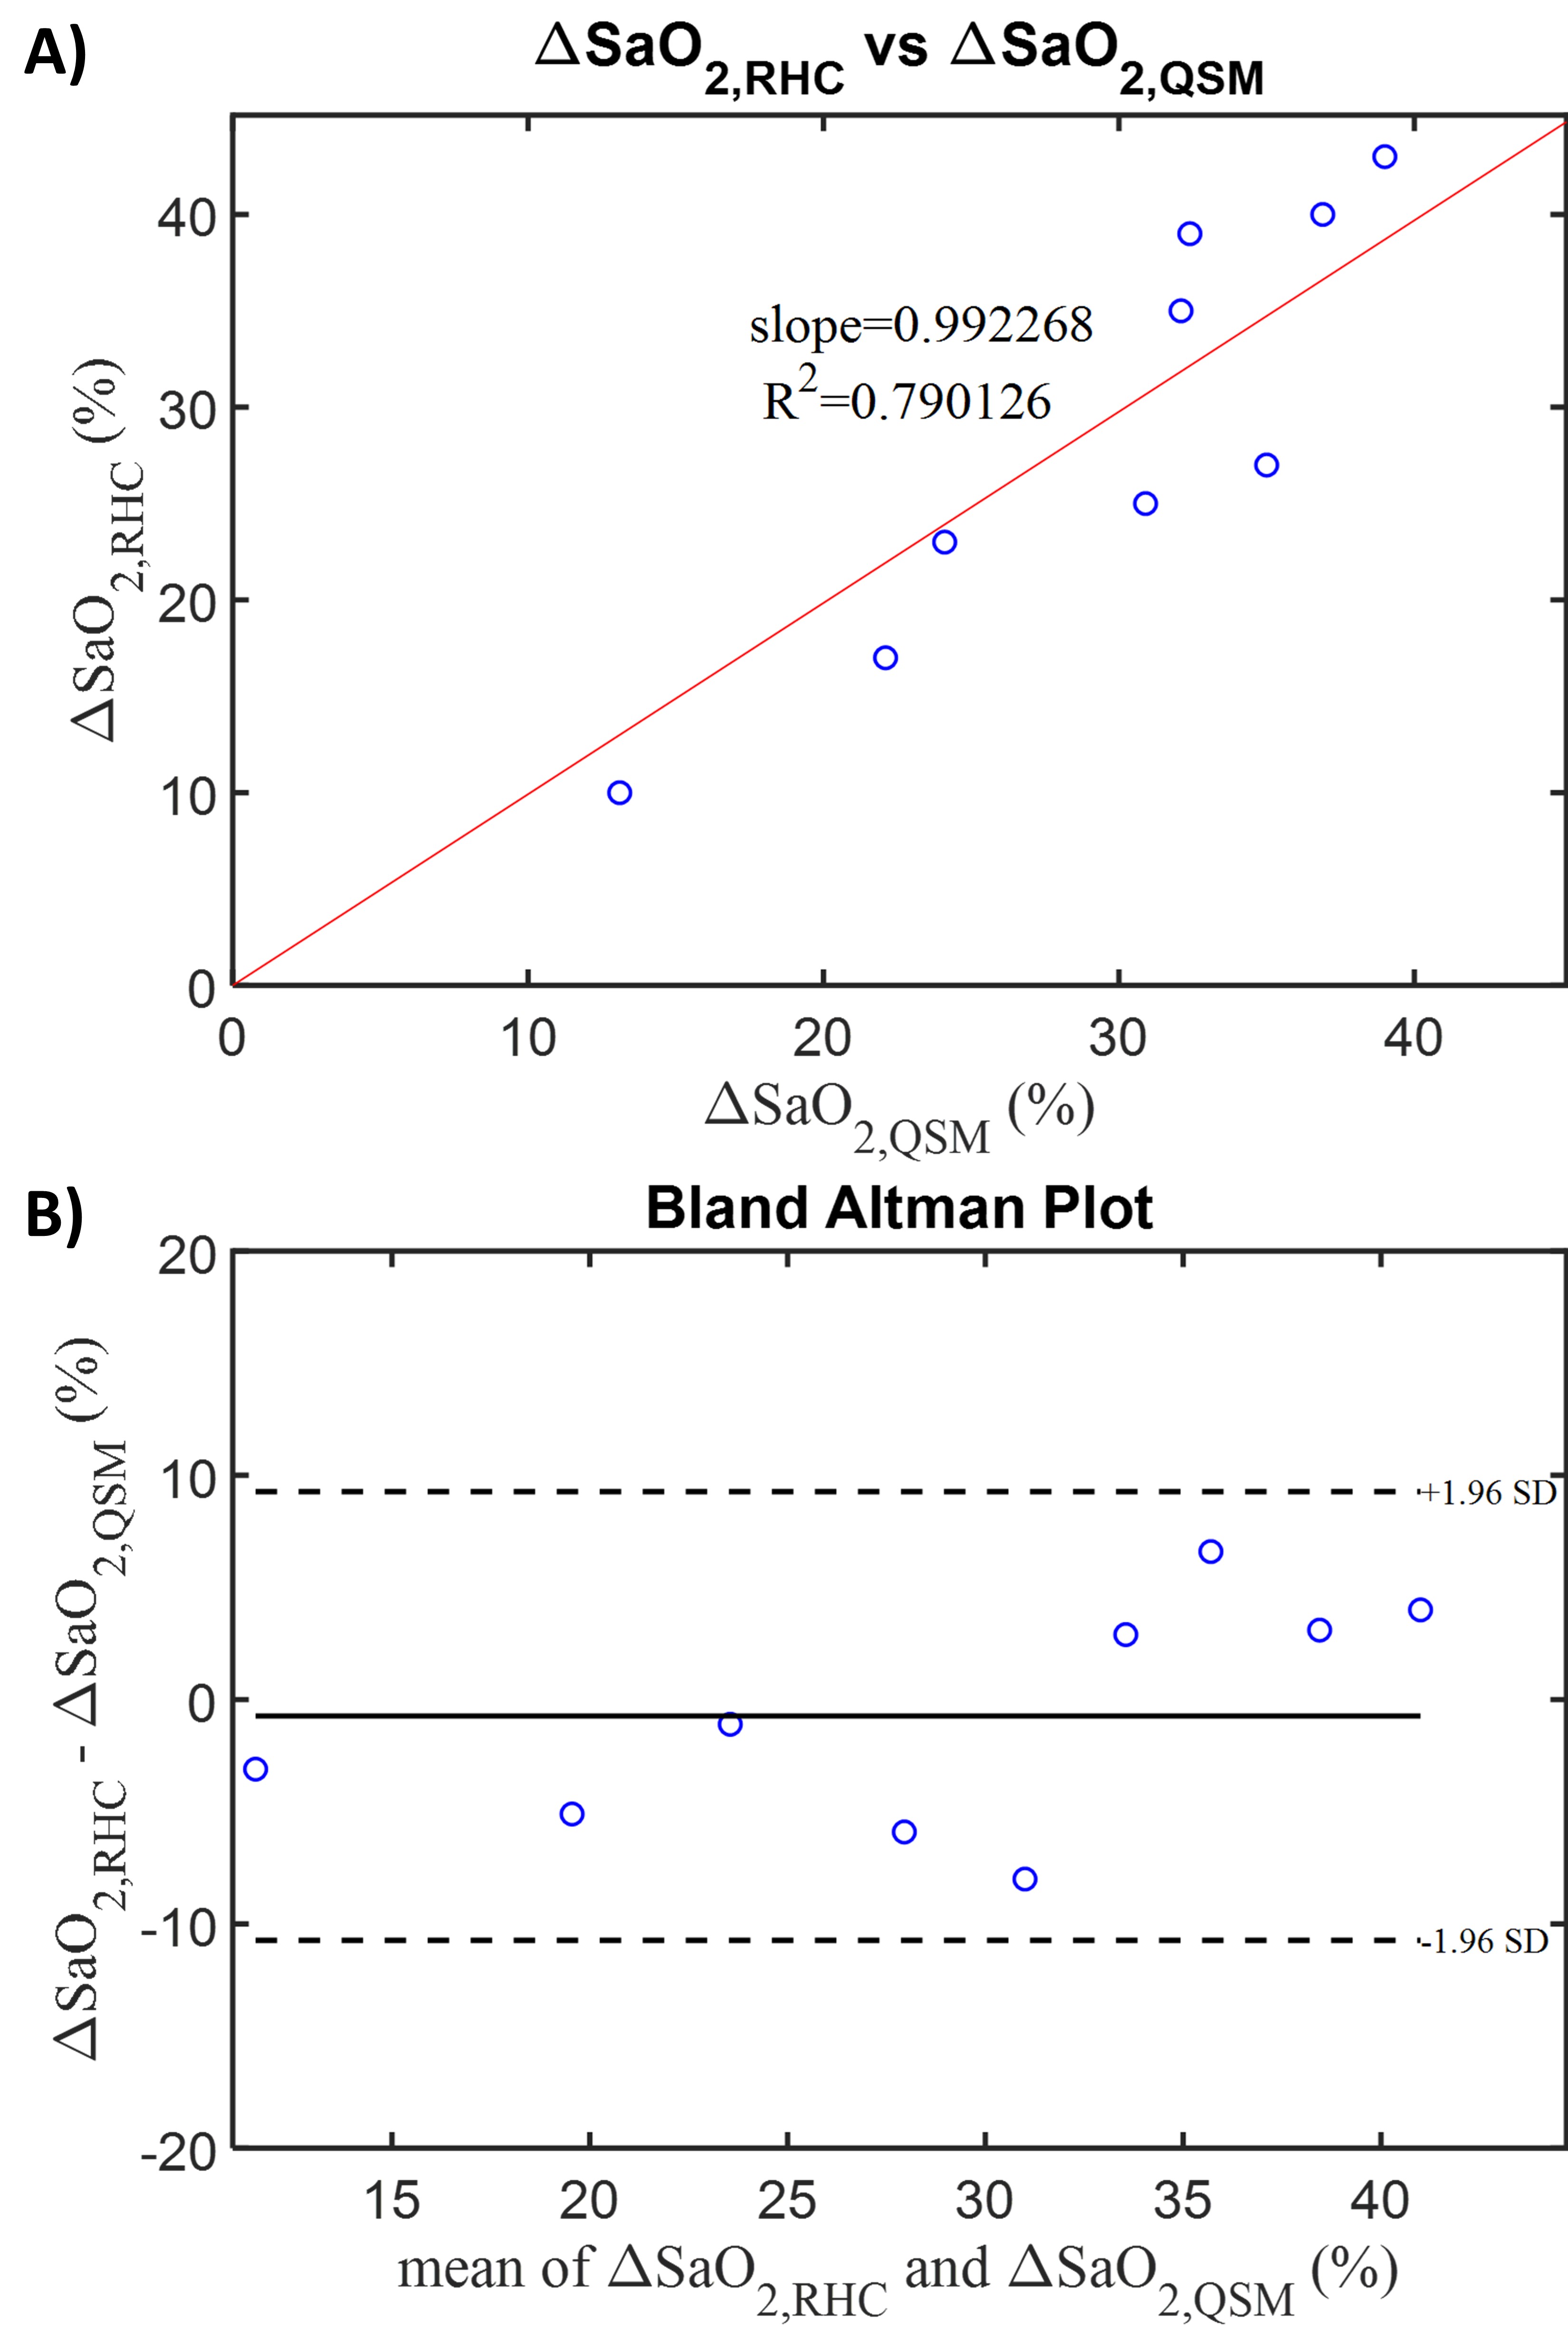
Cardiac QSM was obtained successfully in 85% (22/26) of the patients. Figure 1 shows two representative RHC patient cases, where patient A has normal cardiac function (EF=70.5%), and QSM measured a normal $$${\Delta}SaO_2$$$ which also agreed well with the RHC measurement (24.1% vs. 23.0%). In patient B, who has weak cardiac function (EF=20.0%), QSM measured a high $$${\Delta}SaO_2$$$ that also agreed well with the RHC measurement (36.9% vs. 40.0%). In the 9 RHC patients, the QSM based $$${\Delta}SaO_2$$$ demonstrated a good agreement with the reference RHC measurements ($$${\Delta}SaO_{2,RHC}=.99*{\Delta}SaO_{2,QSM}+0.00$$$, R2=.79), and the Bland Altman plot showed a small bias (-0.7±10.0%) between the two $$${\Delta}SaO_2$$$ measurement methods (Figure 2). In the rest of the 13 successful cases QSM measured an average 23.8±6.1% $$${\Delta}SaO_2$$$.DISCUSSION
The current approach to cardiac QSM observed an 85% success rate in patients, and the average scan time was 433±142.8s. In the patients, QSM was able to measure a large range of $$${\Delta}SaO_2$$$ (from 13.1% to 39%), and the QSM based $$${\Delta}SaO_2$$$ showed an excellent agreement with the RHC measurements with a small bias between the two oxygenation measurement approaches. In the rest of the non-RHC patients, the average QSM based $$${\Delta}SaO_2$$$ was within the physiologically feasible range.
CONCLUSION
Navigator Gated Cardiac QSM was successfully obtained in a substantial proportion of patients undergoing contrast-enhanced CMR, and the QSM based agreed well with invasive RHC measurements. These preliminary findings suggest that cardiac QSM has the potential to become a non-invasive alternative to current catheter-based heart chamber oxygenation measurements.Acknowledgements
This work was supported in part from NIH grant R01HL128278, R01NS072370, R01NS090464, R01NS095562, R01CA181566, and SCMR Seed Grant.References
1. Dong, J., et al., Simultaneous Phase Unwrapping and Removal of Chemical Shift (SPURS) Using Graph Cuts: Application in Quantitative Susceptibility Mapping. IEEE Transactions on Medical Imaging, 2015. 34(2): p. 531-540.
2. Reeder, S.B., et al., Multicoil Dixon chemical species separation with an iterative least-squares estimation method. Magnetic Resonance in Medicine, 2004. 51(1): p. 35-45.
3. Dimov, A.V., et al., Joint estimation of chemical shift and quantitative susceptibility mapping (chemical QSM). Magnetic Resonance in Medicine, 2015. 73(6): p. 2100-2110.
4. Liu, Z., et al., Preconditioned total field inversion (TFI) method for quantitative susceptibility mapping. Magnetic Resonance in Medicine, 2016: p. doi:10.1002/mrm.26331.
5. Liu, Z., et al., MEDI+0: Morphology enabled dipole inversion with automatic uniform cerebrospinal fluid zero reference for quantitative susceptibility mapping. Magnetic Resonance in Medicine: 79: 2795-2803. doi:10.1002/mrm.26946.
6. Wen, Y., et al., Cardiac quantitative susceptibility mapping (QSM) for heart chamber oxygenation. Magnetic Resonance in Medicine.79: 1545-1552. doi:10.1002/mrm.26808
Figures