2047
Epicardial fat imaging with diffusion weighted MRI1Anatomy and Medical Imaging, University of Auckland, Auckland, New Zealand
Synopsis
Epicardial fat is associated with the development of metabolic syndrome and higher cardiovascular risk profile. Excessive fat can cause ventricular arrhythmias and alter repolarization. Fat is typically quantified with the Dixon technique, adding extra scan time. The microstructure of fat can also be differentiated with non-Gaussian diffusion weighting because the size of adipocytes differ from myocytes. Our automatic segmentation of the fat has 0.99 in accuracy and specificity compared with the Dixon technique. Further studies are required to associate myofibre misalignment with fat response in pathological hearts. Our technique can address both of these measures.
Introduction
Epicardial fat is associated with the development of metabolic syndrome$$$^1$$$ and higher cardiovascular risk profile. Excessive fat can cause ventricular arrhythmias and alter repolarization$$$^2$$$. Epicardial fat accumulates at LV-RV junctions from base to apex and along coronary artery branches, with similar quantity on both ventricles. Consequently, there is three times more fat per gram of the RV than LV myocardium$$$^3$$$. At the micro scale, fat appears in the cleavage planes$$$^4$$$ in order to respond to immediate changes in myocytes metabolism and to act as inflammatory mediators$$$^5$$$.
Quantification of epicardial fat by MR imaging requires dedicated sequences such as the multi-echo Dixon method, adding extra scan time during a typical imaging examination$$$^6$$$. For imaging examinations where diffusion-based techniques are being used, the diffusion images can provide information to differentiate fat and lean tissues. We hypothesize that the fat can be differentiated with non-Gaussian diffusion weighting.
Method
A healthy, formalin-fixed, ex vivo sheep heart specimen was scanned at 3T using a spin echo diffusion sequence with monopolar diffusion gradients. A Cube Sphere diffusion sampling was used$$$^9$$$, consisting of an inner shell with 32 diffusion directions set at $$$b=800s/mm^2$$$ and an outer shell with 32 diffusion directions projected back onto the TE cube$$$^9$$$. Tetrahedral and hexahedral diffusion sampling (4 corners and 6 edges of the TE cube) were also added, resulting in 74 measured diffusion directions. Acquisition parameters were: TR=2s, TE=56.88ms, $$$voxel=2×2×4mm^3$$$ and 8 slices. At $$$b<1500s/mm^2$$$, the bi-exponential diffusion model is used to isolate the formalin similarly to the Pasternak’s method$$$^{10}$$$ (equation1). At $$$b>1500s/mm^2$$$, DKI-bi-exponential model satisfies the non-Gaussian diffusion approximation to isolate the fat (equation2).
equation1:$$\frac{S(b)}{S0}=(1-f)e^{-b∙D_{iso}}+f e^{-b∙D_{heart_{app}}+\frac{1}{6}b^2∙D_{heart_{app}}^2 ∙K_{app}}$$
equation2: $$f e^{-b∙D_{heart_{app}}+\frac{1}{6}b^2∙D_{heart_{app}}^2 ∙K_{app}}=(1-f_{fat})e^{-b∙D_{myo}}+f_{fat} e^{-b∙D_{fat_{app}}+\frac{1}{6}b^2∙D_{fat_{app}}^2 ∙K_{fat_{app}}}$$
where S(b) and $$$S_0$$$ are the signal with and without diffusion weighting, f is the volume fraction of tissue, $$$D_{iso}$$$ is the isotropic diffusion of the formalin, and $$$D_{heart_{app}}$$$ and $$$K_{app}$$$ are the apparent diffusion coefficient of the myocytes and the apparent diffusional kurtosis, respectively. We used a three-point Dixon sequence$$$^{6,11}$$$ (TR=12.1ms, TE1=1.4ms, $$$voxel=2×2×4mm^3$$$ and 8 slices) as the ground-truth for fat/myocardium delineation. Dixon images were co-registered with the diffusion weighted images using a rigid transformation. Voxel-wise accuracy and specificity were compared between the fat mapping from the DKI-bi-exponential diffusion model and the intensity values threshold of the segmented fat in DWI.
Results
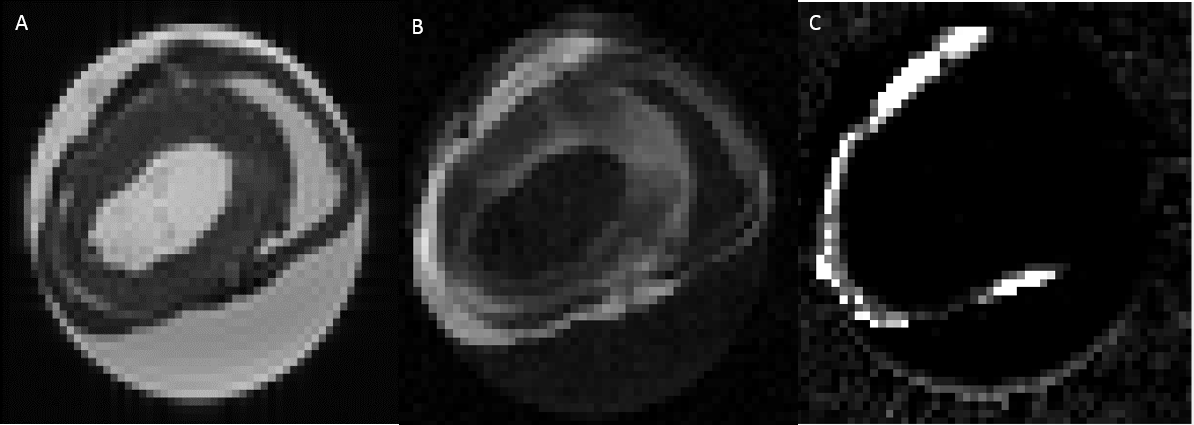
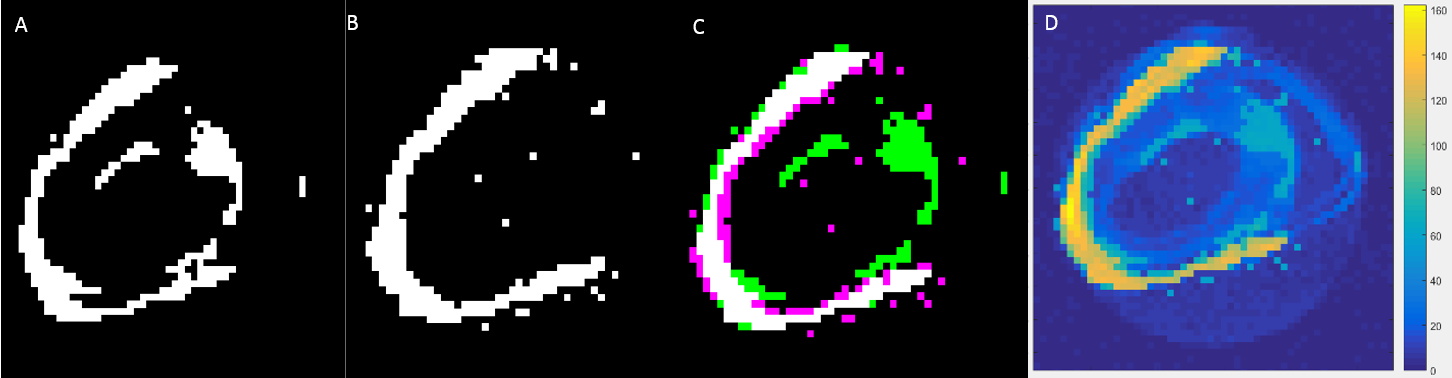
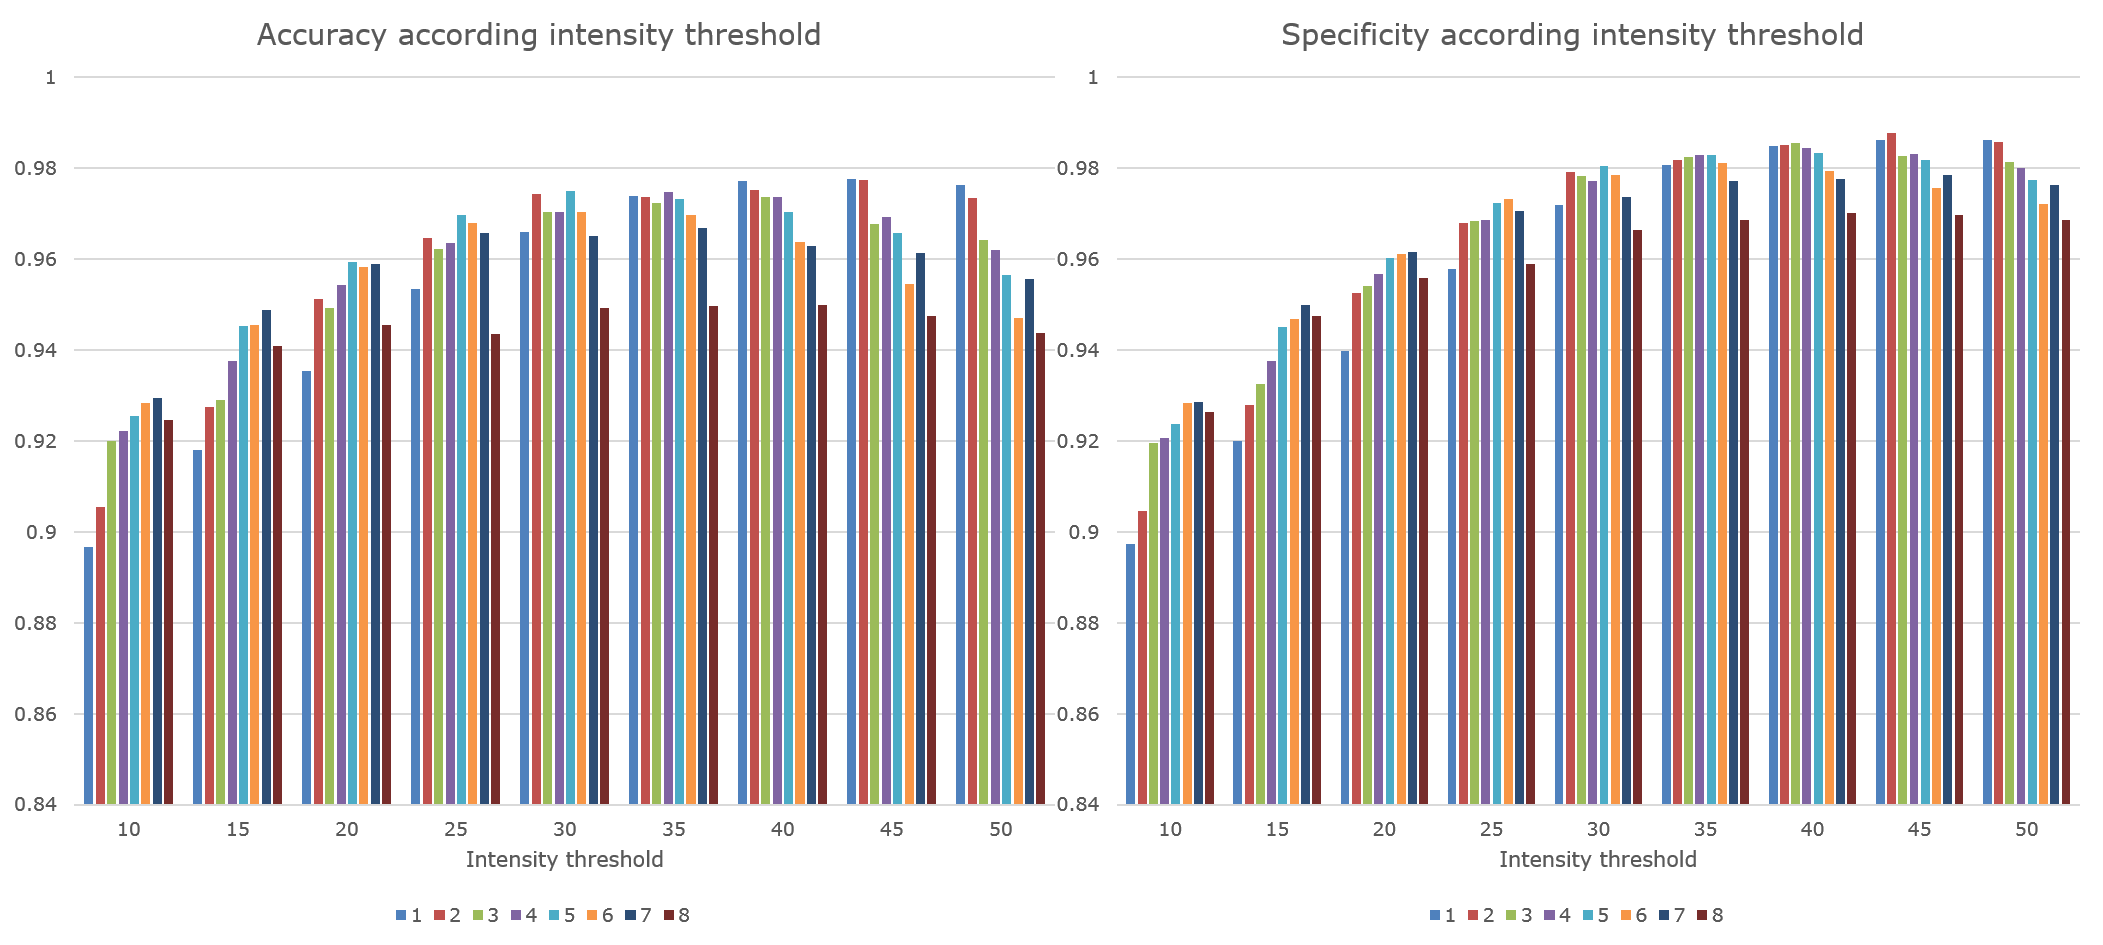
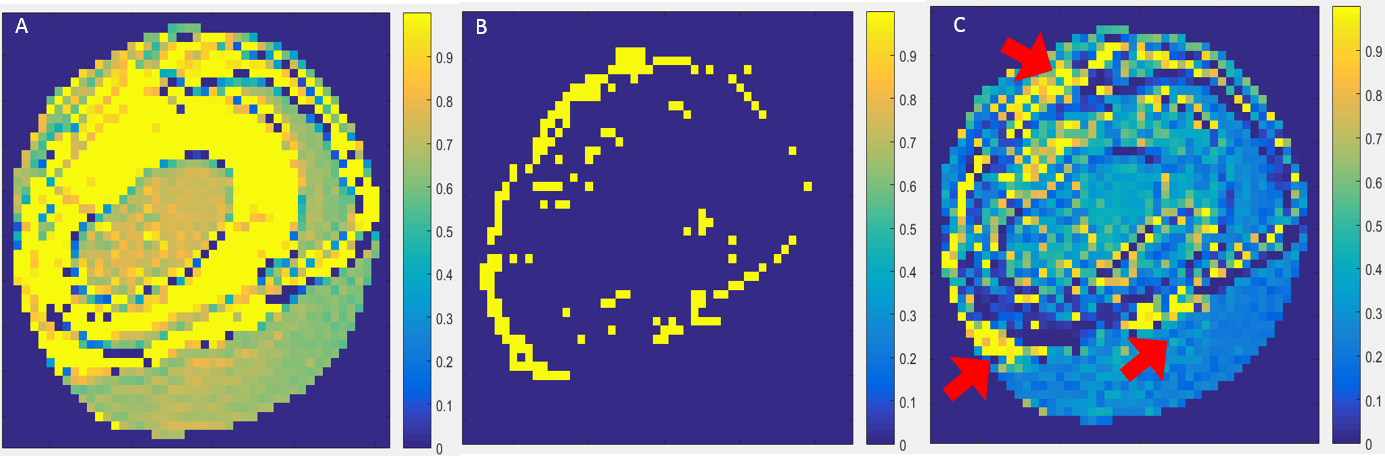
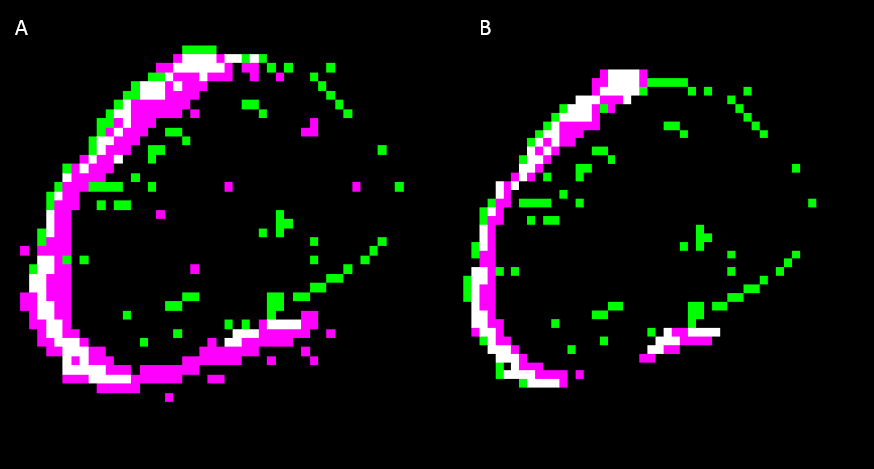
Figure1 shows a short-axis cross-section of the heart specimen at $$$b=0s/mm^2$$$(A) and $$$b=2500s/mm^2$$$(B) compared with the fat image produced by the Dixon scan(C). The regions of restricted diffusion tend to align with those tissues found to be fat in the Dixon images. Figure2 shows the intensity threshold of DWI at $$$b=2500s/mm^2$$$ (A) and the dixon image(B) registered with DWI in (C). At $$$b=2500s/mm^2$$$, the myocardium shows restricted diffusion in the septum (fig2-A) that does not correspond to the fat, affecting the accuracy and specificity of the intensity threshold method (figure3). Similarly thresholding based on the mean diffusivity shows poor accuracy and specificity because the fat does not have a uniform diffusivity. Figure4 and 5 show that the fat can be segmented from the myocardium using its non-Gaussian diffusivity with an accuracy of 0.9969//0.9998 and a specificity of 0.9985//0.9999 in comparison with Dixon image threshold at 0//20 intensity, respectively. The validation is limited by the accuracy of the Dixon technique to detect fat as the ground truth and to define the intensity threshold for Dixon image.
Conclusion
We demonstrated that non-Gaussian diffusion weighting can be used to quantify epicardial fat in comparison with the Dixon method. DWI is used primarily in cardiac DTI to assess fibre and sheetlet orientations$$$^{12−17}$$$. Fibre remodelling occurs in infarct and remote areas$$$^{18,19}$$$. Congenital heart disease (CHD) such as tetralogy of Fallot and single ventricle have lower helix angles with altered sheet angles$$$^{20}$$$. The abnormal configuration of fibres in either infarct or CHD involve a change in the metabolism of the myocytes. Consequently, the reconfiguration of the myocardium affects the location and function of the fat which is in turn associated with inflammation, and myocardial fibrillation$$$^{21}$$$. Previous studies have shown an increased epicardial fat volume in single ventricle physiology after Fontan palliation and with repaired TOF, and this was associated with lower ventricular ejection fraction and cardiac index$$$^{22}$$$. The ratio of fat to myocardium in the RV is three times higher than the LV, thus systemic RV pathologies may be more subject to the influence of fat than systemic LV pathologies. Further studies are required to associate myofibre misalignment with fat response in CHD and other pathologies. Our technique can address both of these measures.Acknowledgements
No acknowledgement found.References
[1] S. M. Grundy, H. B. Brewer, J. I. Cleeman, S. C. Smith, and C. Lenfant, “Definition of Metabolic Syndrome,” Circulation, vol. 109, no. 3, pp. 433–438, Jan. 2004.
[2] R. K. G Caffier, “Action of free fatty acids on contractility and action potential of the heart,” Cell. Mol. Asp. Regul., 1982.
[3] G. Iacobellis, D. Corradi, and A. M. Sharma, “Epicardial adipose tissue: anatomic, biomolecular and clinical relationships with the heart,” Nat. Clin. Pract. Cardiovasc. Med., vol. 2, no. 10, pp. 536–543, Oct. 2005.
[4] I. Mirea, “Analysis of the 3D microstructure of the human cardiac tissue using Xray phase contrast microtomography.” 2017.
[5] Mazurek, “Human epicardial adipose tissue is a source of inflammatory mediators,” Circulation, 2003.
[6] P. Kellman, D. Hernando, S. Shah, S. Zuehlsdorff, R. Jerecic, C. Mancini, Z.-P. Liang, and A. E. Arai, “Multiecho dixon fat and water separation method for detecting fibrofatty infiltration in the myocardium,” Magn. Reson. Med., vol. 61, no. 1, pp. 215–221, Jan. 2009.
[7] C. Bambace, M. Telesca, E. Zoico, A. Sepe, D. Olioso, A. Rossi, F. Corzato, V. Di Francesco, A. Mazzucco, F. Santini, and M. Zamboni, “Adiponectin gene expression and adipocyte diameter: a comparison between epicardial and subcutaneous adipose tissue in men,” Cardiovasc. Pathol., vol. 20, no. 5, pp. e153–e156, Sep. 2011.
[8] R. H. Anderson, D. Sanchez-Quintana, P. Niederer, and P. P. Lunkenheimer, “Structural–functional correlates of the 3-dimensional arrangement of the myocytes making up the ventricular walls,” J. Thorac. Cardiovasc. Surg., vol. 136, no. 1, pp. 10–18, Jul. 2008.
[9] B. Scherrer and S. K. Warfield, “Parametric Representation of Multiple White Matter Fascicles from Cube and Sphere Diffusion MRI,” PLoS One, vol. 7, no. 11, p. e48232, Nov. 2012.
[10] O. Pasternak, N. Sochen, Y. Gur, N. Intrator, and Y. Assaf, “Free water elimination and mapping from diffusion MRI,” Magn. Reson. Med., vol. 62, no. 3, pp. 717–730, Sep. 2009.
[11] C. Nguyen, M. Lu, Z. Fan, X. Bi, P. Kellman, S. Zhao, and D. Li, “Contrast-free detection of myocardial fibrosis in hypertrophic cardiomyopathy patients with diffusion-weighted cardiovascular magnetic resonance,” J. Cardiovasc. Magn. Reson., vol. 17, no. 1, p. 107, Dec. 2015.
[12] T. G. Reese, R. M. Weisskoff, R. N. Smith, B. R. Rosen, R. E. Dinsmore, and V. J. Wedeen, “Imaging myocardial fiber architecture in vivo with magnetic resonance,” Magn. Reson. Med., vol. 34, no. 6, pp. 786–791, Dec. 1995.
[13] D. F. Scollan, A. Holmes, R. Winslow, and J. Forder, “Histological validation of myocardial microstructure obtained from diffusion tensor magnetic resonance imaging.,” Am. J. Physiol., vol. 275, no. 6 Pt 2, pp. H2308-18, Dec. 1998.
[14] E. W. Hsu, A. L. Muzikant, S. A. Matulevicius, R. C. Penland, and C. S. Henriquez, “Magnetic resonance myocardial fiber-orientation mapping with direct histological correlation.,” Am. J. Physiol., vol. 274, no. 5, pp. H1627–H1634, May 1998.
[15] J. Dou, T. G. Reese, W. Y. I. Tseng, and V. J. Wedeen, “Cardiac diffusion MRI without motion effects,” Magn. Reson. Med., vol. 48, no. 1, pp. 105–114, Jul. 2002.
[16] W. Y. I. Tseng, V. J. Wedeen, T. G. Reese, R. Neal Smith, and E. F. Halpern, “Diffusion tensor MRI of myocardial fibers and sheets: Correspondence with visible cut-face texture,” J. Magn. Reson. Imaging, vol. 17, no. 1, pp. 31–42, Jan. 2003.
[17] D. F. Scollan, A. Holmes, J. Zhang, and R. L. Winslow, “Reconstruction of Cardiac Ventricular Geometry and Fiber Orientation Using Magnetic Resonance Imaging,” Ann. Biomed. Eng., vol. 28, no. 8, pp. 934–944, Aug. 2000.
[18] A. Galli and F. Lombardi, “Postinfarct Left Ventricular Remodelling: A Prevailing Cause of Heart Failure,” Cardiol. Res. Pract., vol. 2016, pp. 1–12, 2016.
[19] D. E. Sosnovik, C. Mekkaoui, S. Huang, H. H. Chen, G. Dai, C. T. Stoeck, S. Ngoy, J. Guan, R. Wang, W. J. Kostis, M. P. Jackowski, V. J. Wedeen, S. Kozerke, and R. Liao, “Microstructural impact of ischemia and bone marrow-derived cell therapy revealed with diffusion tensor magnetic resonance imaging tractography of the heart in vivo,” Circulation, vol. 129, no. 17, pp. 1731–1741, Apr. 2014.
[20] C. Tous, A. A. Young, T. Gentles, and B. P. Pontre, “Assessing myocardial fibre architecture in ex vivo specimens of congenital heart,” Cardivascular Magn. Reson., pp. 0–1, 2018.
[21] A. C. T. Ng, M. Strudwick, R. J. van der Geest, A. C. C. Ng, L. Gillinder, S. Y. Goo, G. Cowin, V. Delgado, W. Y. S. Wang, and J. J. Bax, “Impact of Epicardial Adipose Tissue, Left Ventricular Myocardial Fat Content, and Interstitial Fibrosis on Myocardial Contractile Function,” Circ. Cardiovasc. Imaging, vol. 11, no. 8, Aug. 2018.
[22] A. M. Lubert, J. C. Lu, A. P. Rocchini, M. D. Norris, S. Yu, P. P. Agarwal, M. Ghadimi Mahani, and A. L. Dorfman, “Relation of Increased Epicardial Fat After Fontan Palliation to Cardiac Output and Systemic Ventricular Ejection Fraction,” Am. J. Cardiol., vol. 121, no. 7, pp. 862–866, Apr. 2018.
Figures