2046
Ex-vivo Diffusion Tensor Imaging of the Porcine Heart at Ultra High Field Strength - 7T: Impacts of Tissue Fixation Duration and Stimulated Echo Mixing Time1Chair of Cellular and Molecular Imaging, Comprehensive Heart Failure Center (CHFC), University Hospital Wuerzburg, Wuerzburg, Germany, 2Chair of Tissue Engineering and Regenerative Medicine (TERM), University Hospital Wuerzburg, Wuerzburg, Germany, 3Translational Center Regenerative Therapies (TLC-RT), Fraunhofer Institute for Silicate Research (ISC), Wuerzburg, Germany
Synopsis
Diffusion time dependent changes of ADC, FA, HA were analyzed in two fixed, excised porcine hearts using a stimulated echo approach at 7T with mixing times 50-1000ms. A standard SE-method was used as a reference and SNR differences were evaluated using the multiple image method. The data will allow better comparison of in-vivo measurements using SE- and STE-approaches. Ex-vivo measurements, which can provide high fidelity data at resolutions unachievable in-vivo, are usually performed on fixed tissue. We therefore assessed the impact of tissue fixation on T2 and T2* at 7T, which will allow optimization of future acquisition protocols.
INTRODUCTION
There has been a growing interest in cardiac diffusion tensor imaging. The two main sequences used to acquire in-vivo diffusion data of the heart are a motion and velocity compensated spin-echo (SE) sequence and a stimulated echo acquisition mode approach (STE). In-vivo studies analyzing differences in performance and accuracy between the two showed that MD was significantly lower, and FA significantly higher using the stimulated echo approach (1,2). The long diffusion time in the STE-sequence allows water molecules to diffuse longer distances and therefore increases interactions with local microstructure (3). Primary aim of this study was to assess changes in diffusion metrics using varying diffusion times in a STE-approach at 7T at different time points after tissue fixation. Secondary aim was to assess myocardial T2 and T2* at pre and post fixation states at 7T.METHODS
Measurements were performed on 7T whole-body MRI system (Siemens MAGNETOM™ Terra) using a 1Tx/32Rx head coil. Two porcine hearts were imaged in physiological saline solution. Initial relaxometry measurements prior to fixation were performed 45-90 minutes after excision and were followed by emersion fixation in 10% neutral buffered formalin and storage at room temperature. Measurements for T2 and T2* were repeated after 4 days and complete tissue fixation. Relaxometry and diffusion data were measured for a basal, a mid-ventricular and an apical slice.
T2* was evaluated based on a 2D gradient multi-echo sequence with the following imaging parameters: slice thickness: 5 mm, matrix size: 68 × 176, field of view (FOV): 131mm × 169mm, interpolated in-plane resolution: 1mm, number of averages: 8, TR: 150ms. Nine echoes per excitation were acquired with TE values between 2.07ms and 18ms.
Measurements for T2 evaluation were performed using a multi-echo spin echo sequence acquiring 4 averages with TR: 2000ms. 32 contrasts with TE values between 7.5ms and 240ms were measured. Other measurement parameters remained identical to T2* acquisitions.
After tissue fixation was complete, diffusion data was measured for slices identical to T2 and T2* acquisitions using a SE-sequence (TE:44ms) and a STE-sequence(TE:32ms) (4) with 1 mm in-plane resolution. Further measurement parameters for the 2 averages were: TR: 3500ms, diffusion directions (b=1000s/mm2): 30, reference images (b=150s/mm2): 5, acceleration: R=3 (GRAPPA). ADC and FA were calculated using DSI Studio (5) and the Helix angle (6) determined using Matlab. The STE-sequence was repeated using mixing times [ms]: 50, 100, 200, 400, 600, 800, and 1000. SNR of the SE- and STE (TMix=100ms) was assessed using 30 reference images (b=0 s/mm2) and the multiple image method (7).
RESULTS
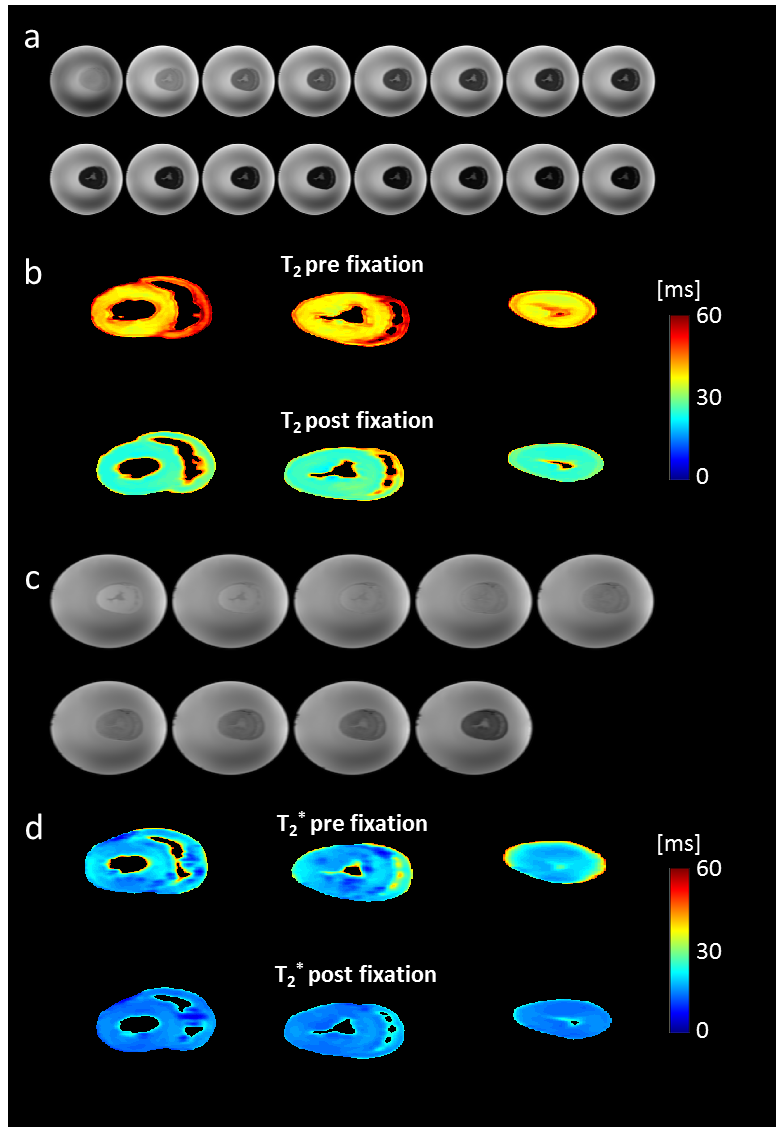
Figure 1 shows measured images for T2 and T2* evaluation and the resulting parameter maps for three slices of one heart. Average T2 [ms] was 48.4±6.5 and 42.0±6.4 prior to fixation and 29.7±4.6 and 28.8±5.8 post fixation, while average T2* [ms] was 21.0±3.5 and 19.2±3.7 prior and 16.2±2.1 and 15.5±2.6 post fixation.
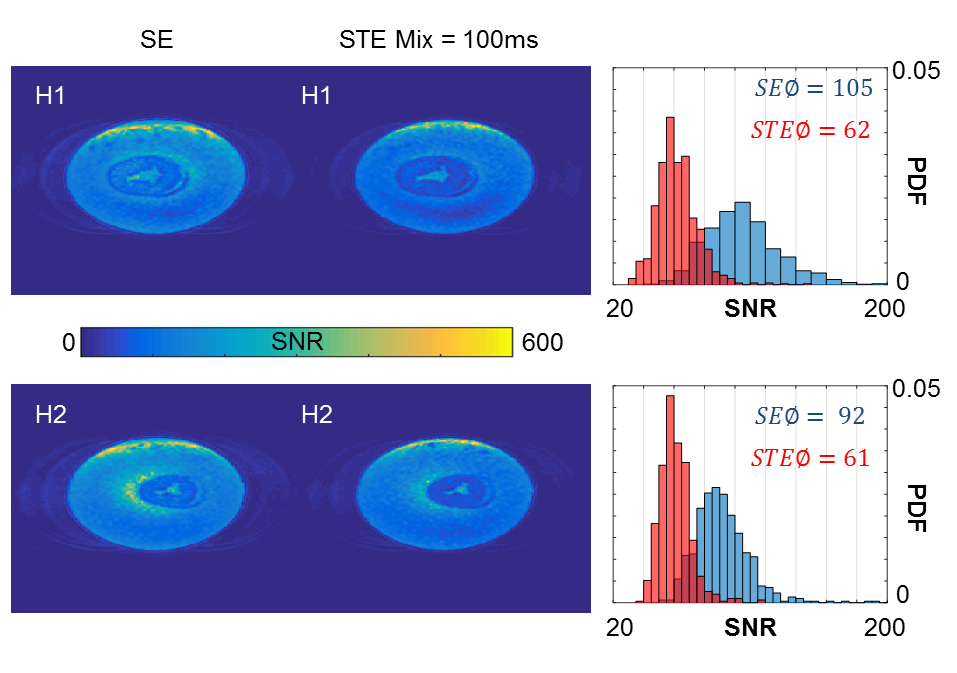
Figure 2 displays SNR comparison for the SE- and STE-sequence. The use of a stimulated echo approach resulted in a loss of 34-40% SNR and a less broad distribution of SNR over the myocardium.
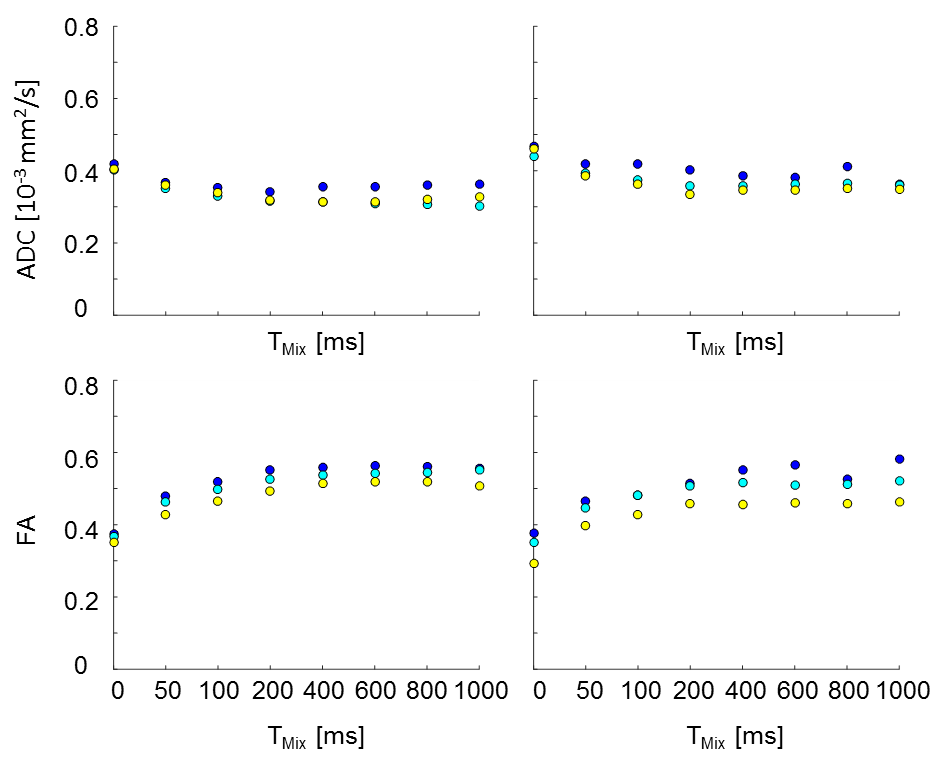
Diffusion time dependent changes in ADC and FA are shown in Figure 3. Average changes in ADC and FA are ~20% and 50%, respectively, for a 1000ms difference in diffusion time.
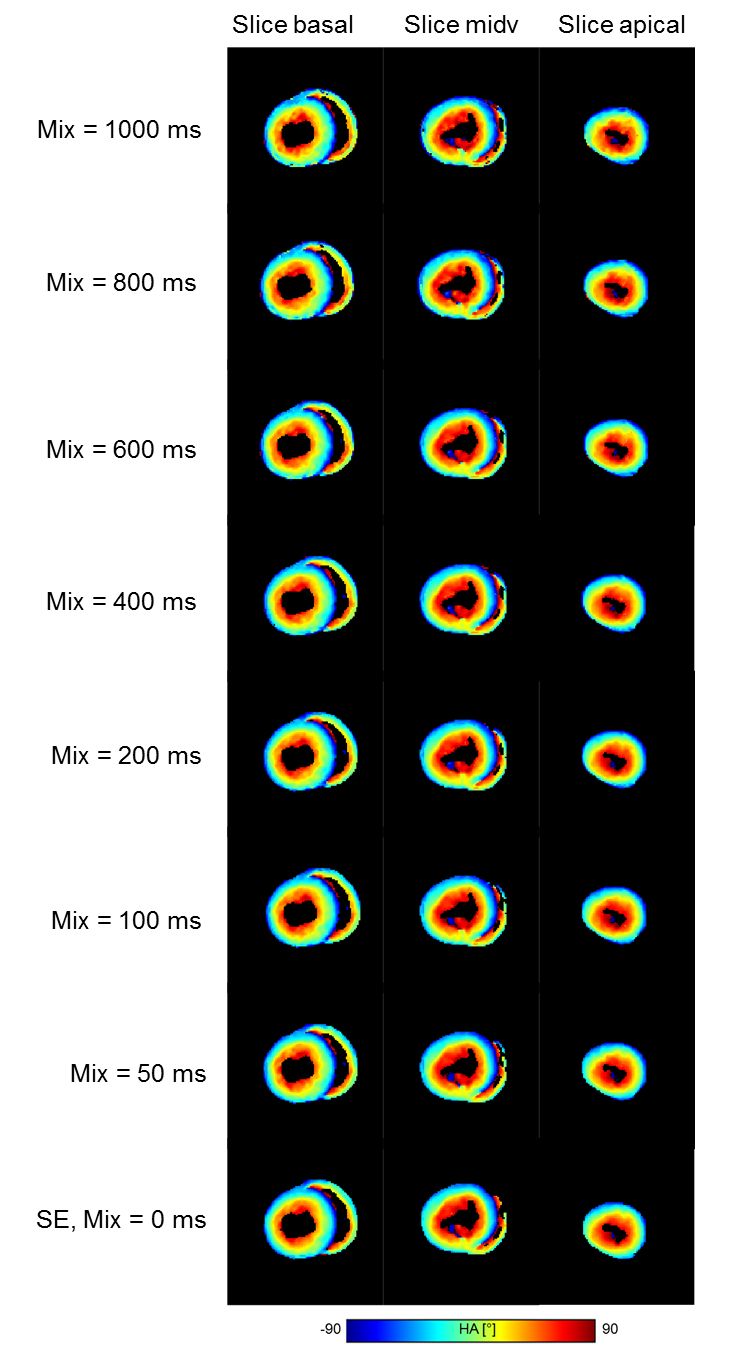
Diffusion time dependent changes in HA are shown in Figure 4. Maps appear slightly patchier for very long diffusion times (≥800ms).
DISCUSSION
Tissue fixation results in significantly shorter transverse and effective transverse relaxation times, which makes a stimulated echo approach with shortened echo times appealing for ex vivo imaging at 7T, particularly for diffusion times that are long compared to T2 (8). Avoiding 180° pulses seems to additionally enhance signal homogeneity, allowing more consistent SNR within the analyzed tissue. The application of the STE-approach at 7T benefits from increased T1 at ultrahigh field strengths, decreasing SNR losses for long diffusion times. Whether this effect outweighs SNR losses due to lower T2* is yet unclear. The observed diffusion time dependent changes of ADC and FA are in agreement with literature values (3) reported for the calf heart. Differences in ADC and FA for the three analyzed regions may be caused by the inclusion of the right ventricle and will be subject to further investigation.CONCLUSION
Diffusion time dependent changes of ADC, FA, HA using a stimulated echo approach were assessed at 7T for the first time, demonstrating that the STE-approach is less susceptible to B1 limitations at ultra-high field strengths than the SE-approach, while simultaneously offering lower TEs.Acknowledgements
Financial support: German Ministry of Education and Research (BMBF, grants: 01EO1004, 01E1O1504).
We thank Siemens Healthineers for providing source code of diffusion imaging pulse sequences.
References
1. von Deuster C, Stoeck CT, Genet M, Atkinson D, Kozerke S. Spin echo versus stimulated echo diffusion tensor imaging of the in vivo human heart. Magnetic resonance in medicine 2016;76(3):862-872. 2. Scott AD, Nielles-Vallespin S, Ferreira PF, Khalique Z, Gatehouse PD, Kilner P, Pennell DJ, Firmin DN. An in-vivo comparison of stimulated-echo and motion compensated spin-echo sequences for 3 T diffusion tensor cardiovascular magnetic resonance at multiple cardiac phases. Journal of Cardiovascular Magnetic Resonance 2018;20:1.
3. Kim S, Chi-Fishman G, Barnett AS, Pierpaoli C. Dependence on diffusion time of apparent diffusion tensor of ex vivo calf tongue and heart. Magnetic resonance in medicine 2005;54(6):1387-1396.
4. Paul Kinchesh MK, Karla L Miller, Sean Smart. Minimizing Diffusion Encoding of Slice Selection in Stimulated Echo Imaging. Proc Intl Soc Mag Reson Med 2015;23.
5. http://dsi-studio.labsolver.org. Accessed June 22.
6. Ferreira PF, Kilner PJ, McGill LA, Nielles-Vallespin S, Scott AD, Ho SY, McCarthy KP, Haba MM, Ismail TF, Gatehouse PD, de Silva R, Lyon AR, Prasad SK, Firmin DN, Pennell DJ. In vivo cardiovascular magnetic resonance diffusion tensor imaging shows evidence of abnormal myocardial laminar orientations and mobility in hypertrophic cardiomyopathy. Journal of cardiovascular magnetic resonance : official journal of the Society for Cardiovascular Magnetic Resonance 2014;16:87.
7. Reeder SB, Wintersperger BJ, Dietrich O, Lanz T, Greiser A, Reiser MF, Glazer GM, Schoenberg SO. Practical approaches to the evaluation of signal-to-noise ratio performance with parallel imaging: Application with cardiac imaging and a 32-channel cardiac coil. Magnetic resonance in medicine 2005;54(3):748-754.
8. Lundell H, Alexander DC, Dyrby TB. High angular resolution diffusion imaging with stimulated echoes: compensation and correction in experiment design and analysis. NMR in biomedicine 2014;27(8):918-925.
Figures