2044
Ultrafast Reconstruction of UnderSampled (URUS) 3D Late Gadolinium Enhancement Imaging using Deep Complex Network1Department of Medicine, Beth Israel Deaconess Medical Center and Harvard Medical School, Boston, MA, United States, 2Department of Radiology, Beth Israel Deaconess Medical Center and Harvard Medical School, Boston, MA, United States
Synopsis
A new framework based on
Introduction
Over the past decade, there have been numerous advances in 3D cardiac imaging. However, 3D imaging has long scan and reconstruction time, hampering its clinical adoption. Accelerated imaging such as compressed sensing (CS) has been extensively used to reduce the scan time [1]. Despite excellent image quality and high achievable acceleration factors, the reconstruction time remains very long [2,3]. In this study, we sought to develop an Ultrafast Reconstruction of UnderSampled k-space data (URUS) based on deep complex neural network for 3D Late Gadolinium Enhancement (LGE).Methods
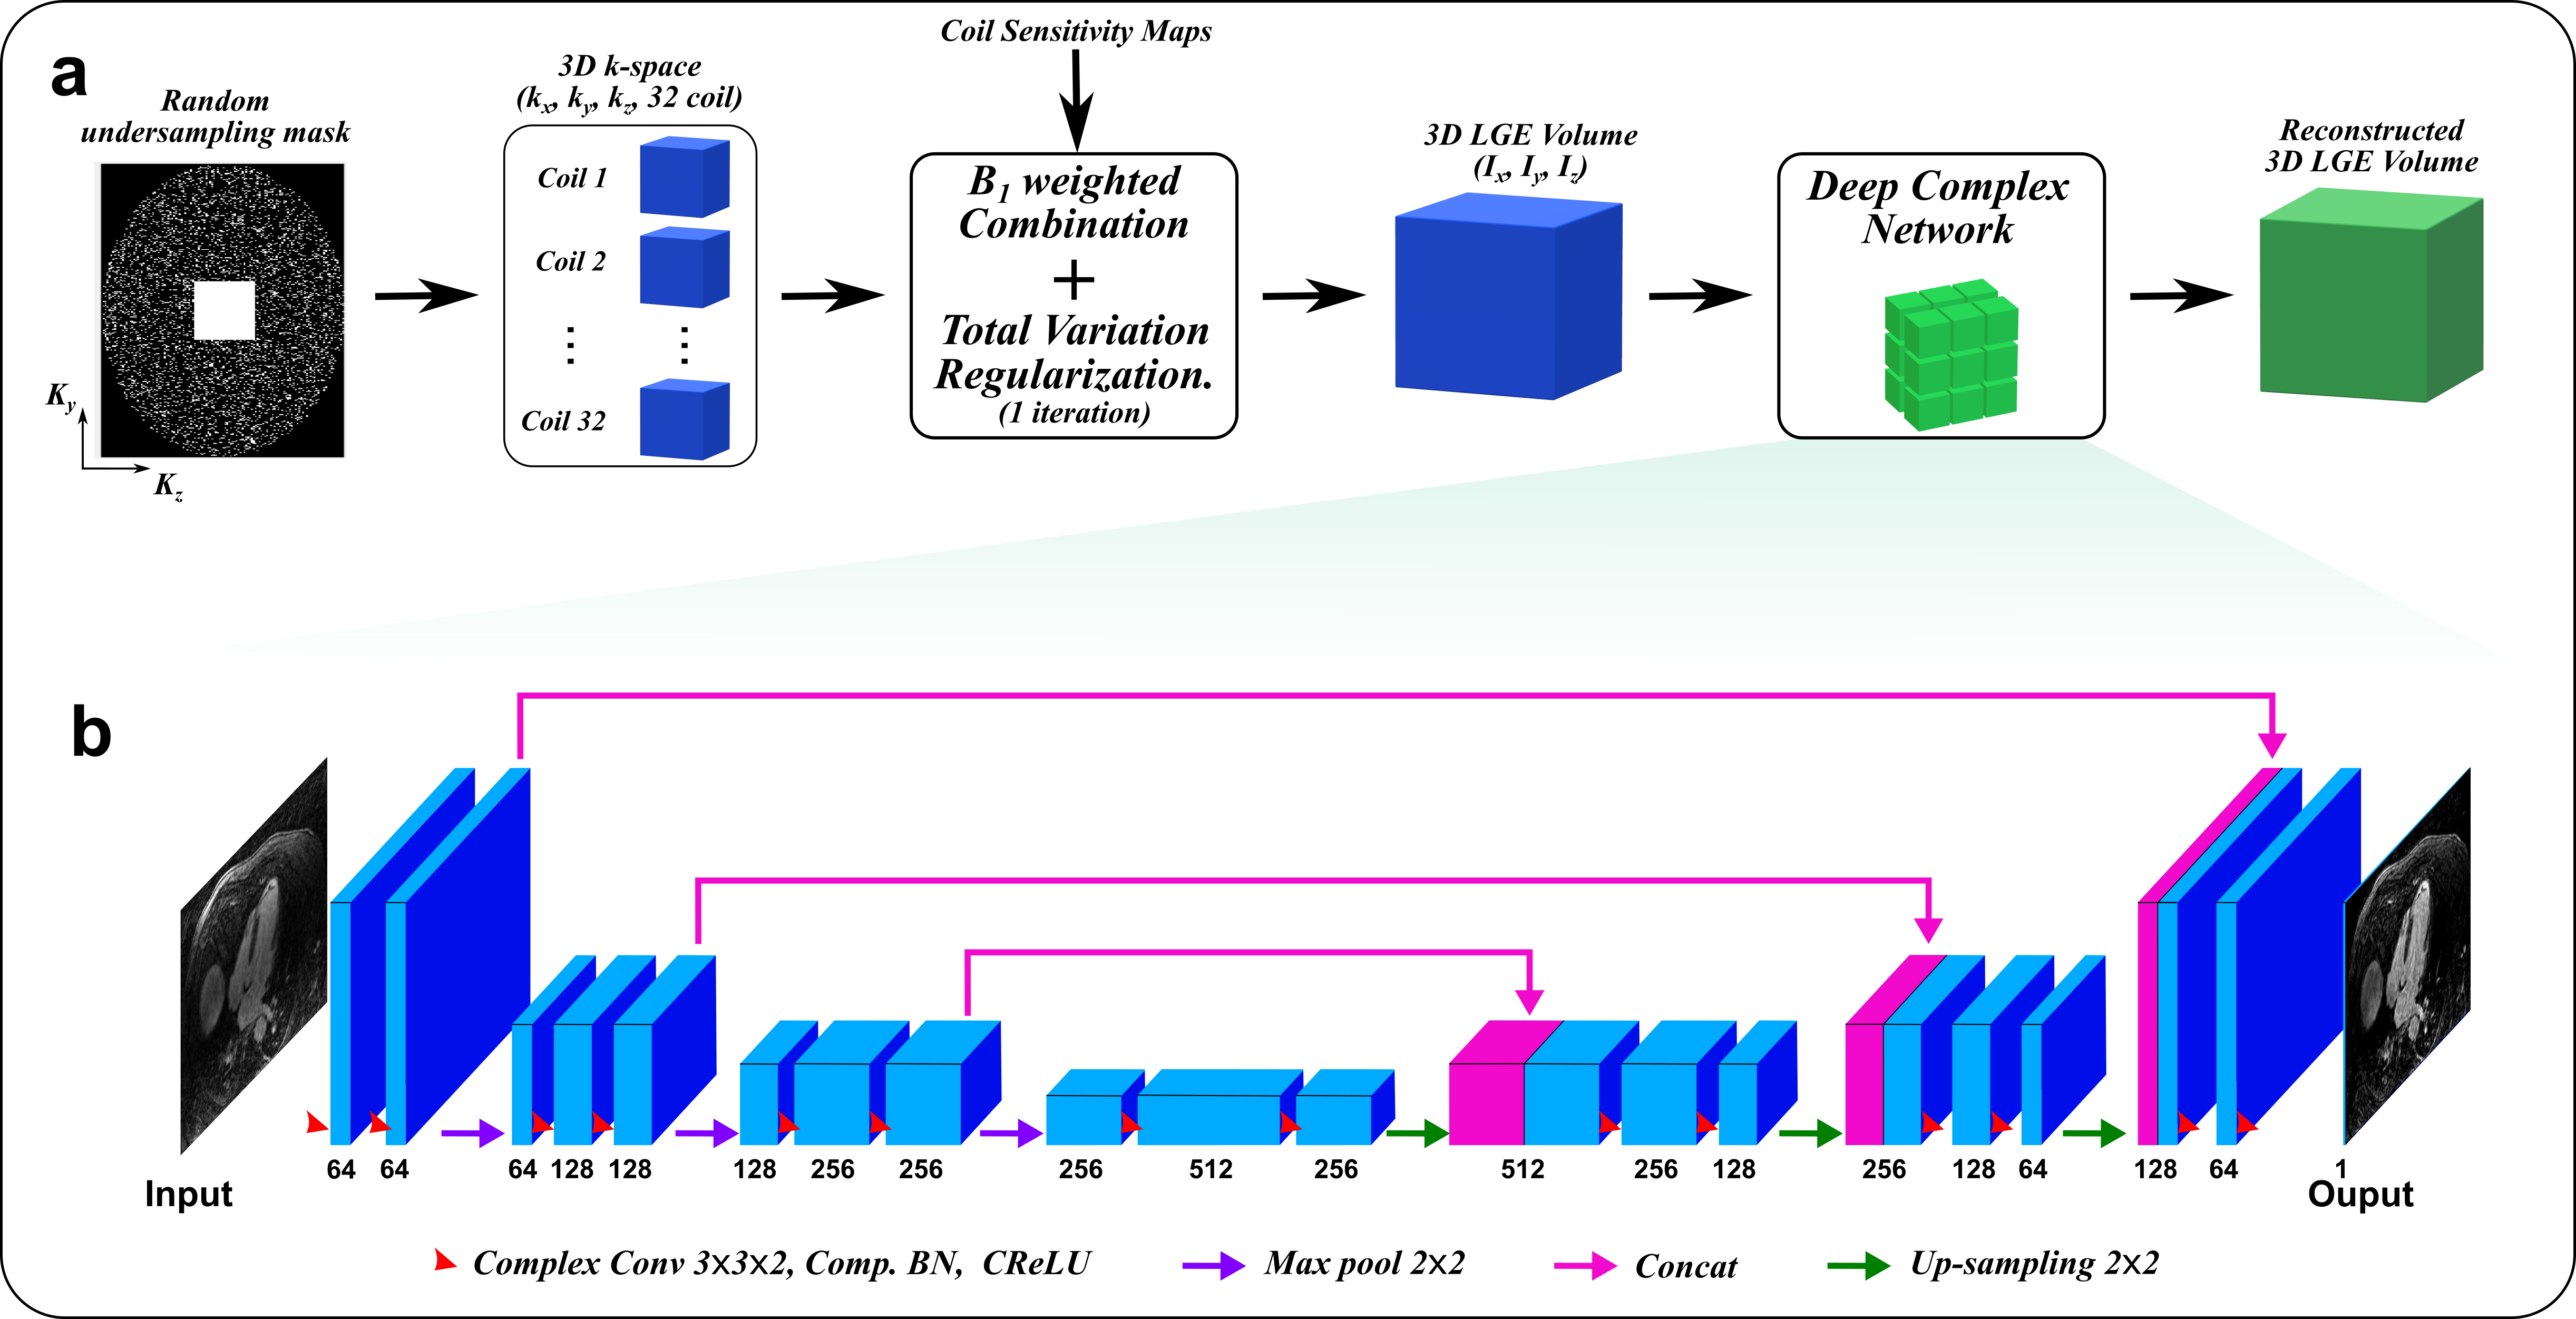
The proposed URUS reconstruction algorithm utilizes complex deep network to create artifact-free MRI images from the acquired undersampled complex k-space data (Fig. 1). The acquired 3D multi-coil k-space data was zero-filled, transformed to image space using FFT, combined using B1-weighted combination and 1 iteration of total variation minimization was performed to reduce the noise level in the input images [4]. This 3D dataset was sliced in the z-direction to multiple 2D-slices of size (N×N×2) and successively fed into 2D complex convolutional network of U-net architecture. Each 2D input image was destructed into basic components using two complex convolutional layers, each of 64 (3x3x2) filters. The complex convolution operations were performed using real-valued arithmetic convolution, where the complex convolution of an image, w: CNxN, and filter, h: CKxK can be represented as:
Real(w * h) = wr * hr - wi * hi
Imag(w * h) = wr * hi + wi * hr
Where * and * stand for complex and real-valued convolution operation, respectively. wr and hr are the real parts of the image and filter, and similarly wi and hi are imaginary parts of image and filter, respectively. Each convolution layer is followed by radial batch normalization layer that standardize the complex data, so that its magnitude has standard distribution of both mean and standard deviation equal 1, and unchanged phase. In addition, Complex ReLU was applied for both real and imaginary parts of the data. A contracting path with three stages of downsampling were performed to increase the receptive field of the network so that artifacts removal on larger scale is enabled. Two convolutional layers followed each downsampling stage to extract higher order features on larger scale. Similarly, an expansive path was utilized to upsample the produced feature maps to reach the original image size using bilinear interpolation. The output maps were reconstructed using two convolution layers to form the output image. In training, mean-squared error function was minimized, so the network learn a mapping function between the aliased complex input and Low-dimensional-structure self-learning and thresholding compressed-sensing (LOST) reconstructed magnitude images [5]. To evaluate the performance of the proposed reconstruction technique, 3D LGE images were acquired in 217 patients using a randomly prospective undersampled k-space with acceleration factors: 3 (n=130), 4 (n=24), and 5(n=63) [3]. 3D LGE images were acquired with spatial resolution of 1.0-1.5 mm3, with 100-120 slices. The dataset was randomly divided into training (70%) and testing (30%) subsets. To quantify the scare volume, the left ventricular myocardium was manually extracted from each 2D slices in all patients with scar in the testing dataset for URUS and LOST reconstructed images. Full-width half-maximum and 6 standard deviations-based methods were used to automatically quantify the scar volume within the extracted myocardium. To investigate higher undersampling rates, each acquired k-space data was further undersampled with 2 higher factors, so that acceleration factors ranging from 5 to 7 were achieved (i.e. all data acquired with rate 3 was under sampled to rate 5, and similarly rates 4 and 5 were undersampled to rates 6 and 7, respectively). This model was implemented using PyTorch and tested on PC equipped with 12GB NVIDIA Xp GPU.
Results
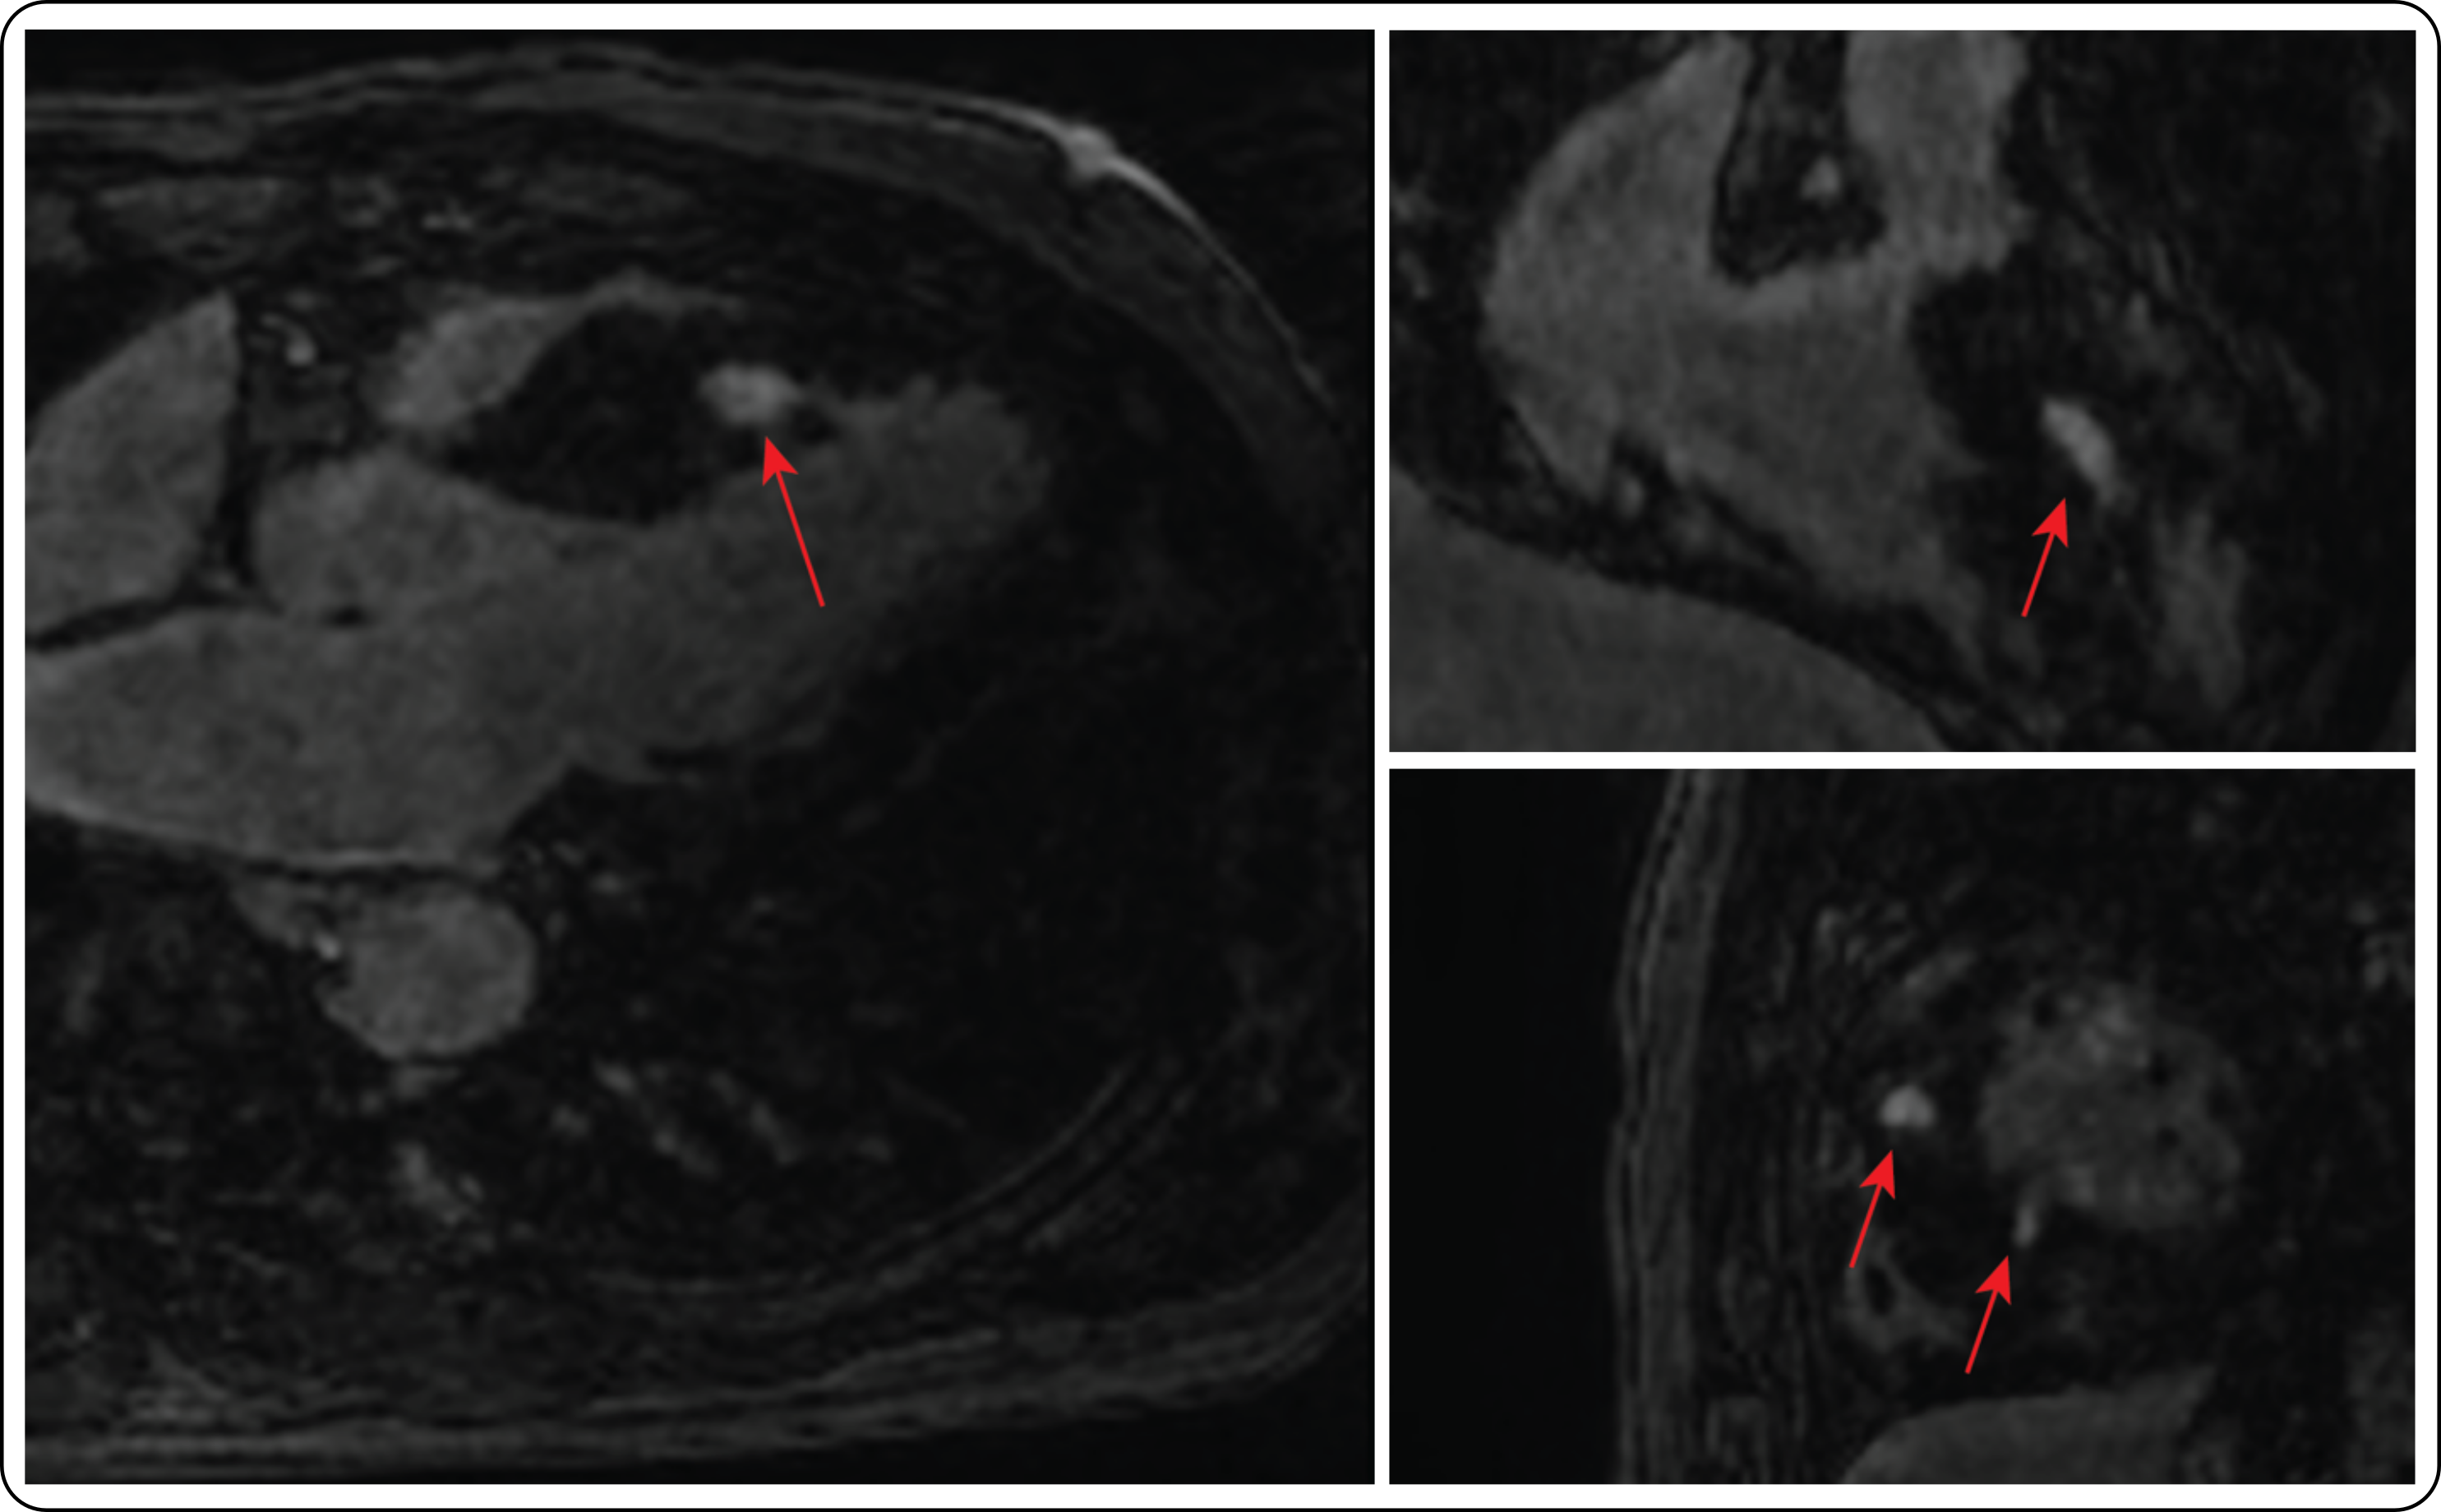
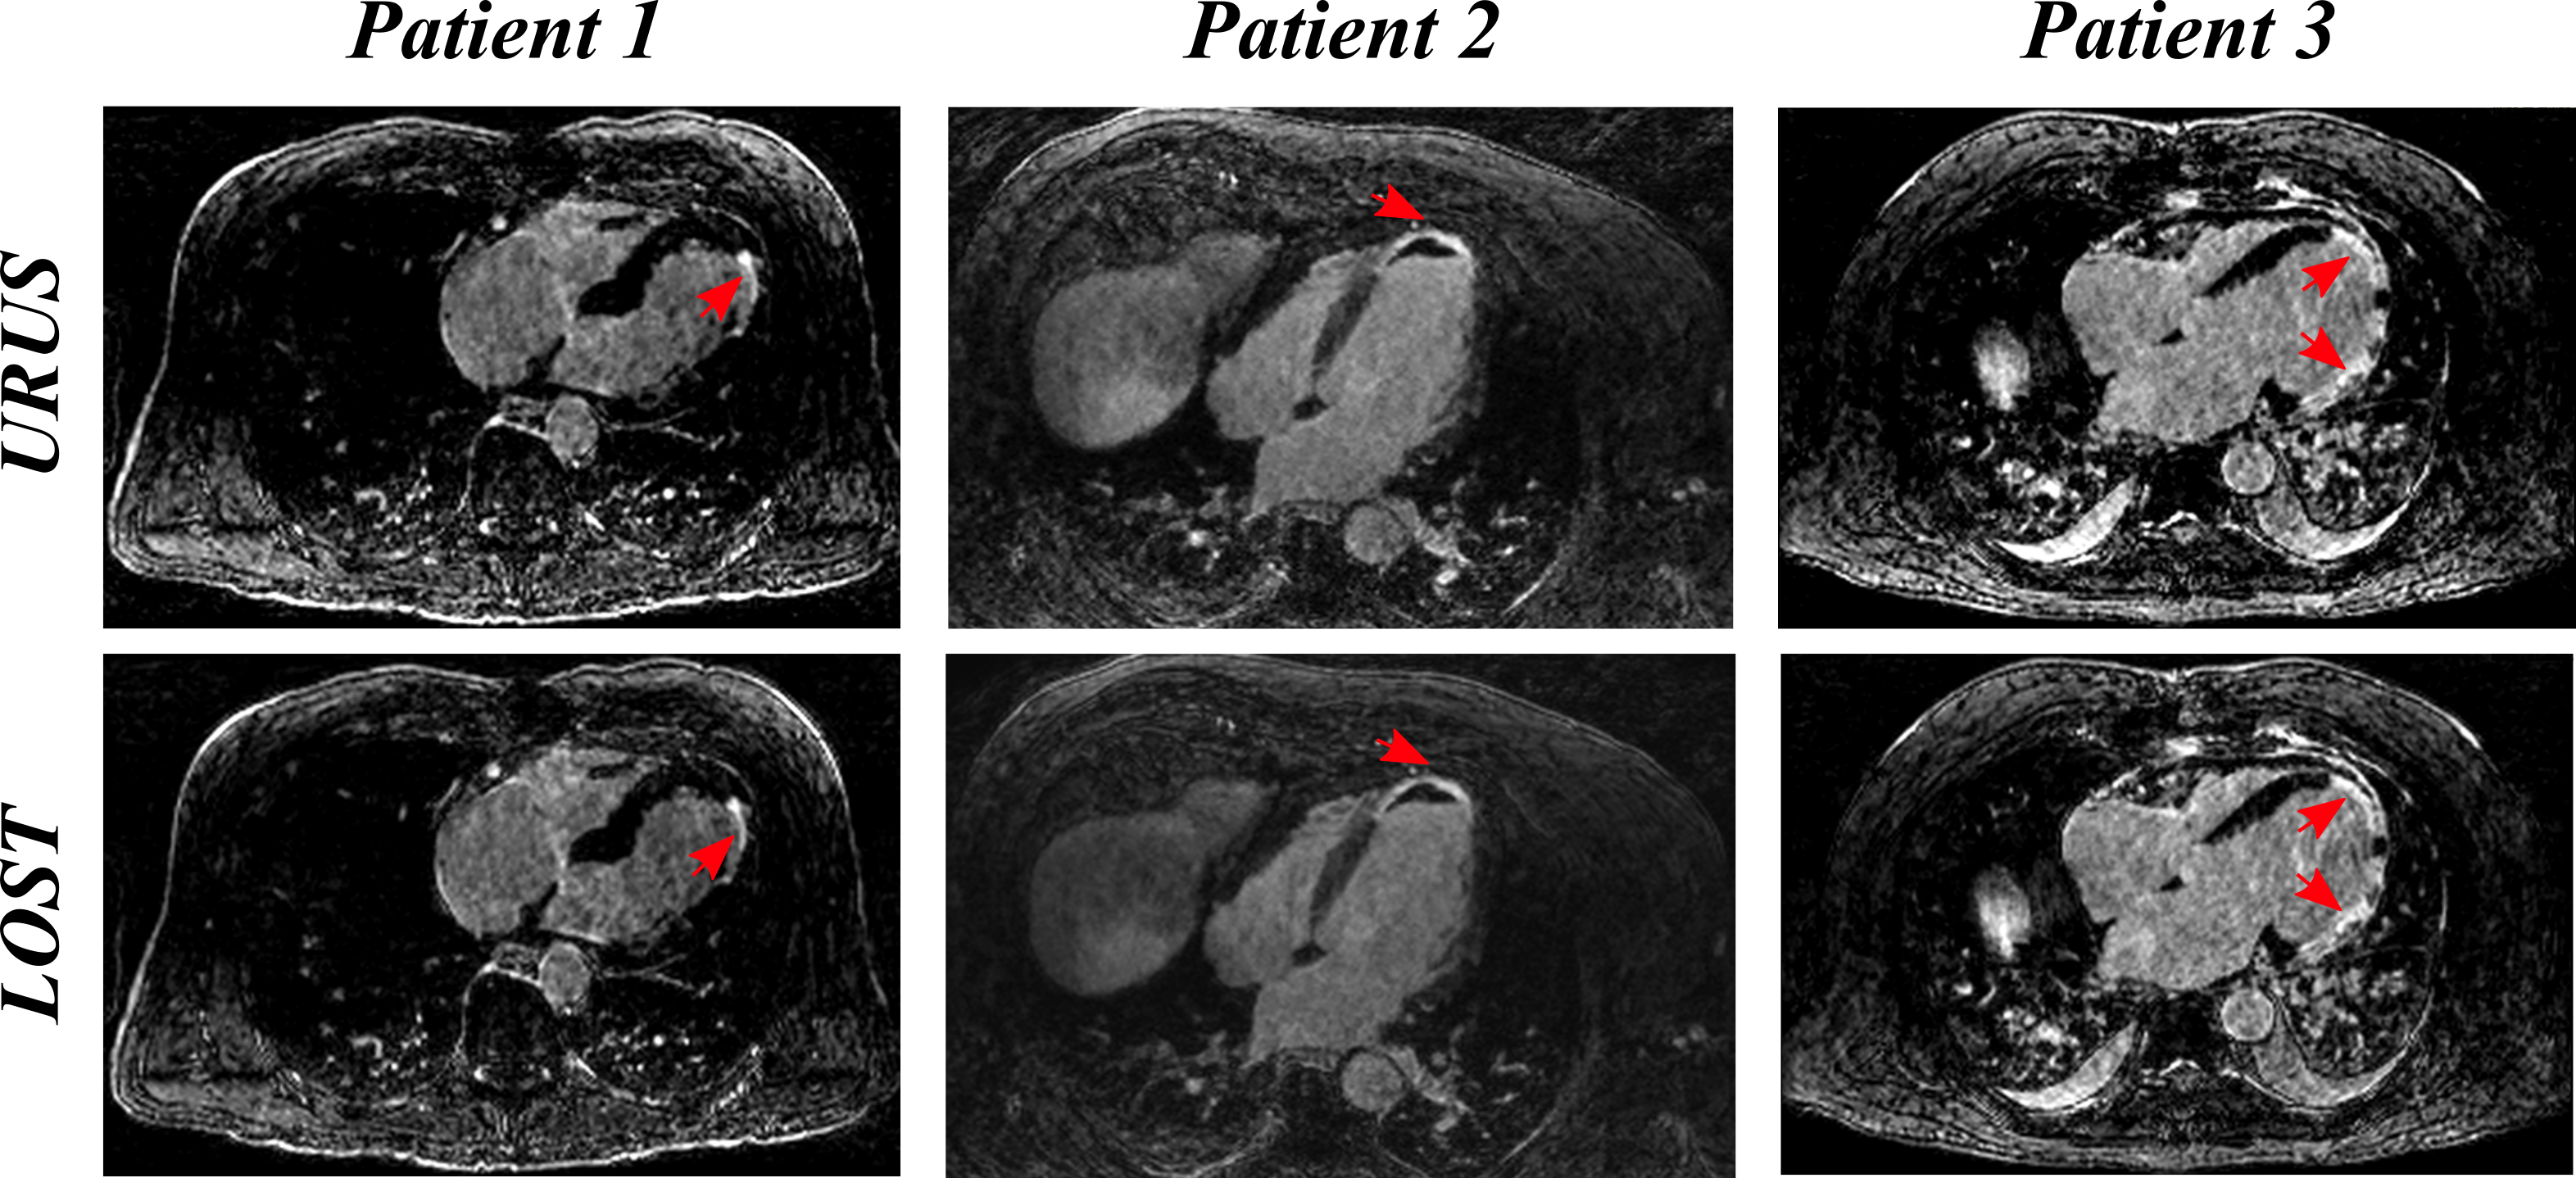
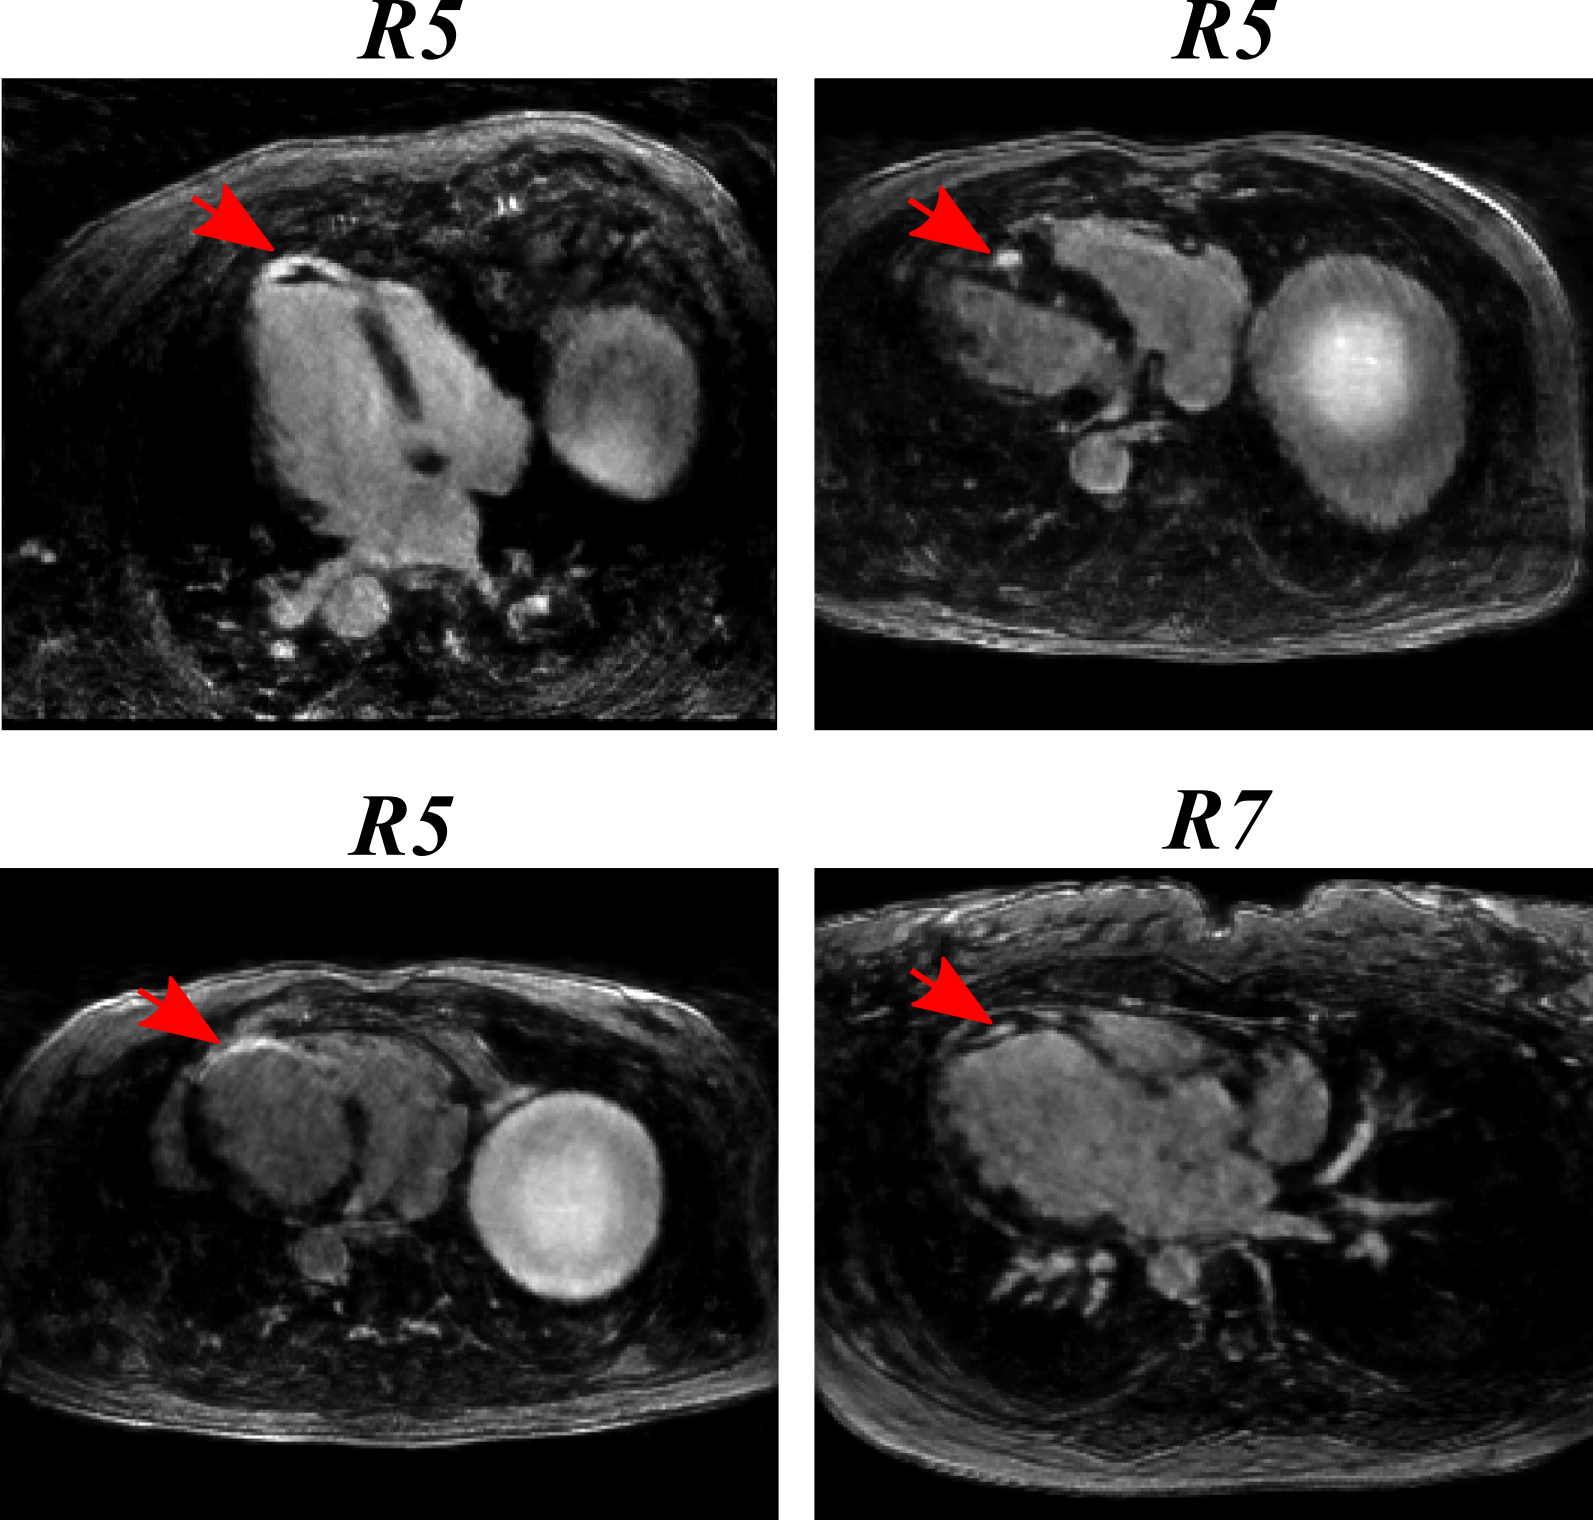
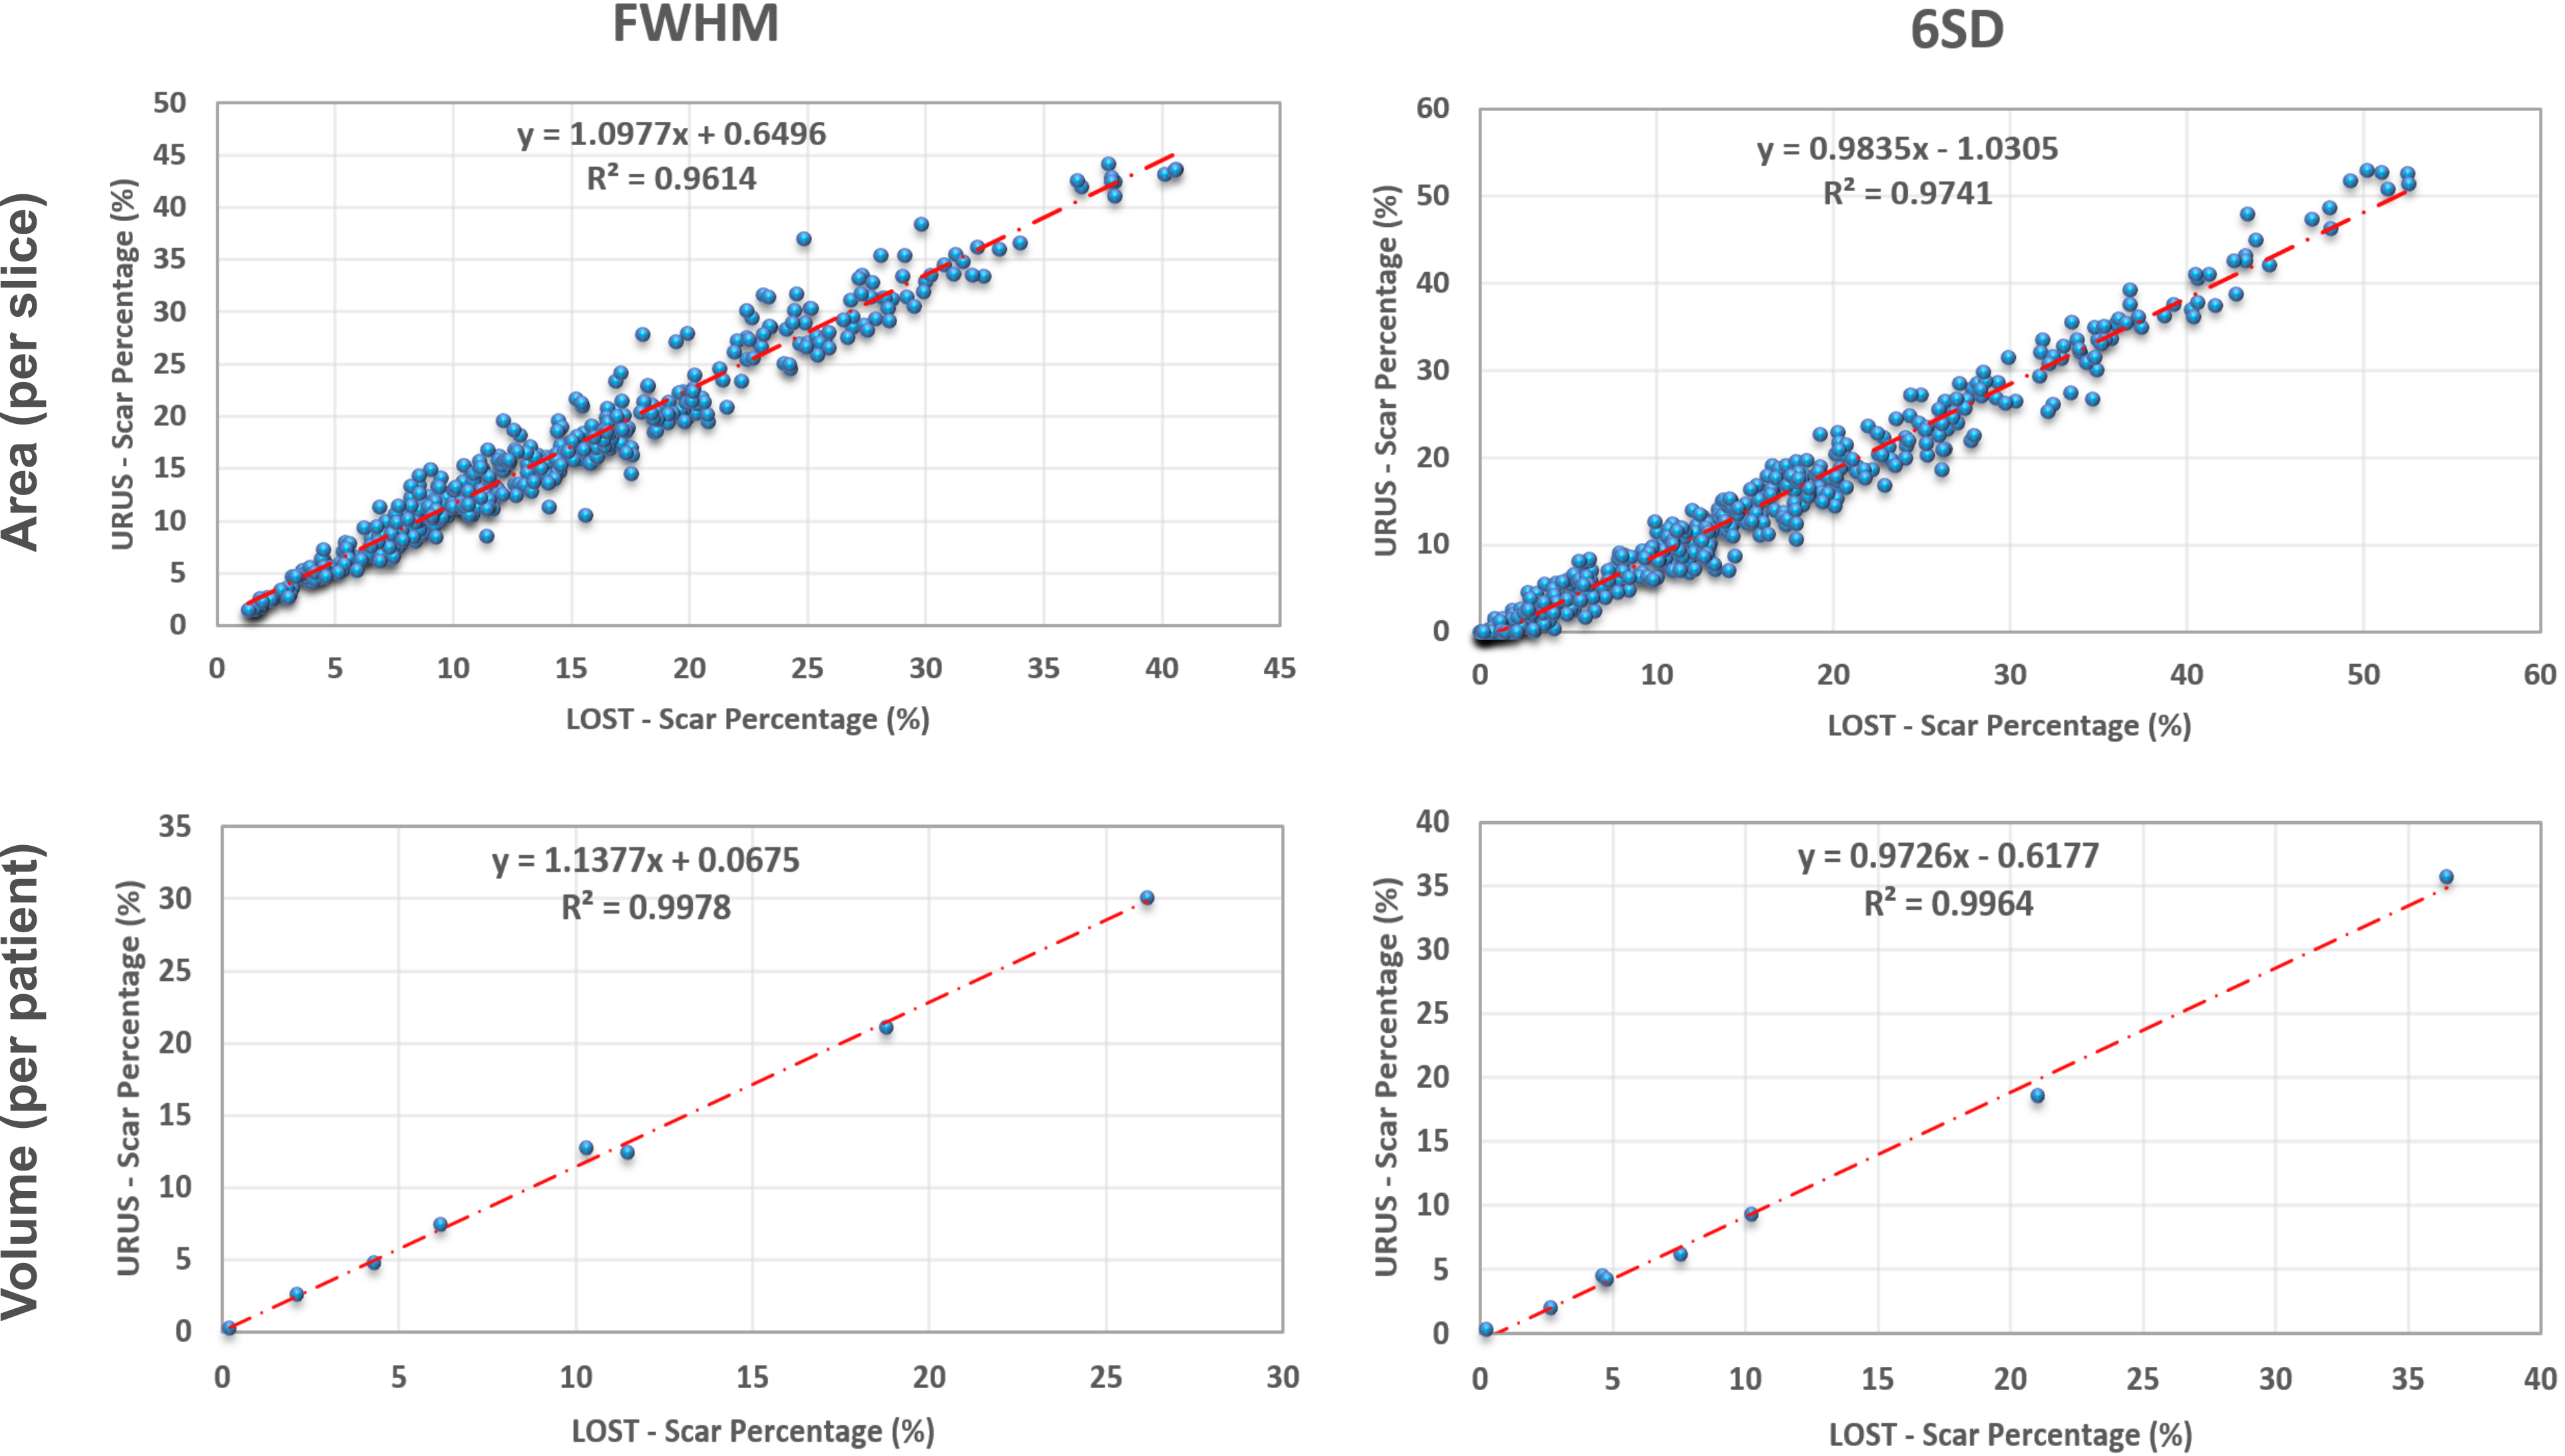
Figure 2 shows reformatted 3D LGE images (acceleration factor of 5) with isotropic spatial resolution of 1.4 mm3 reconstructed using the proposed reconstruction algorithm in a patient with hypertrophic cardiomyopathy. Figure 3 shows example images for URUS- and LOST-reconstructed images for patients with scars. Figure 4 shows example images for reconstructed images from retrospectively undersampled data at acceleration factors 5 and 7. The reconstruction time was ~1 min for URUS vs. 1 hour for LOST. The structure similarity index and peak signal-to-noise ratios significantly increased for URUS output (0.876±0.034 and 11.63±1.48) compared to the input (0.794±0.060 and 6.42±1.3, respectively; P<0.001 for both). Figure 5 shows high correlation of the percentage scar area (per slice) and volume (per patient) between URUS and LOST.Conclusion
URUS enables fast reconstruction of high-resolution accelerated 3D LGE data with reconstruction times in the order of minutes.Acknowledgements
No acknowledgement found.References
1. Vasanawala SS, Alley MT, Hargreaves BA, Barth RA, Pauly JM, Lustig M. Improved Pediatric MR Imaging with Compressed Sensing. Radiology. 2010;256:607–16.
2. Akçakaya M, Rayatzadeh H, Basha TA, Hong SN, Chan RH, Kissinger K V., et al. Accelerated Late Gadolinium Enhancement Cardiac MR Imaging with Isotropic Spatial Resolution Using Compressed Sensing: Initial Experience. Radiology. 2012;264:691–9.
3. Basha TA, Akçakaya M, Liew C, Tsao CW, Delling FN, Addae G, et al. Clinical performance of high-resolution late gadolinium enhancement imaging with compressed sensing. J Magn Reson Imaging. 2017;46:1829–38.
4. Yang J, Zhang Y, Yin W. A fast alternating direction method for TVL1-L2 signal reconstruction from partial Fourier data. IEEE J Sel Top Signal Process. 2010;4:288–97.
5. Akçakaya M, Basha TA, Goddu B, Goepfert LA, Kissinger K V., Tarokh V, et al. Low-dimensional-structure self-learning and thresholding: Regularization beyond compressed sensing for MRI Reconstruction. Magn Reson Med. 2011;66:756–67.
Figures