2036
Fully automated in-vivo DT-CMR analysis with deep learning1Royal Brompton Hospital, London, United Kingdom, 2Imperial College, London, United Kingdom
Synopsis
Currently post-processing of in-vivo DT-CMR data is done off-line as it requires manually input. Two convolutional neural networks (CNN) were trained to classify and segment the LV in order to automate and enable on-the-fly post-processing of DT-CMR data while scanning. The fully automated DT-CMR analysis with deep learning performed effectively with high levels of accuracy when compared to an experienced user.
INTRODUCTION
Diffusion tensor cardiac MR (DT-CMR) is an emerging technique that provides information on myocardial microstructure. Many different diffusion parameters can be extracted from the tensors, including tensor orientation measures which have been shown to relate to the orientation of the local cardiomyocytes and their sheetlet structure1.
Currently, DT-CMR post-processing is done retrospectively, offline. Multiple steps require manual input, including removing frames corrupted by motion artefacts, and thresholding and segmentation of the left ventricular (LV) myocardial wall. Myocardial segmentation is particularly important in order to enable visualisation of the tensor orientation in relation to the local cardiac coordinates defined by the longitudinal, circumferential and radial orthogonal directions. Helix-angle maps, a measure of the orientation of the primary eigenvector in relation to the LV, is a good indicator of scan quality.
In this work we develop and validate a fully automated post-processing framework of in vivo DT-CMR data with deep learning, with the future aim of producing on-the-fly DT-CMR results at the scanner, providing real-time feedback of the scan quality.
METHODS
Two convolutional neural networks (CNN) were trained and tested using previously collected DT-CMR scans, acquired with a STEAM-EPI sequence. The data include a total of 348 healthy and 144 cardiomyopathy patient scans with a total of 26,675 diffusion images. All data had been previously examined for artifacts and segmented by an experienced user. These data were divided 60% for training and 40% for testing sets. MATLAB was used for the deep learning and diffusion tensor post-processing. Class balancing, and data augmentation were used to improve training.
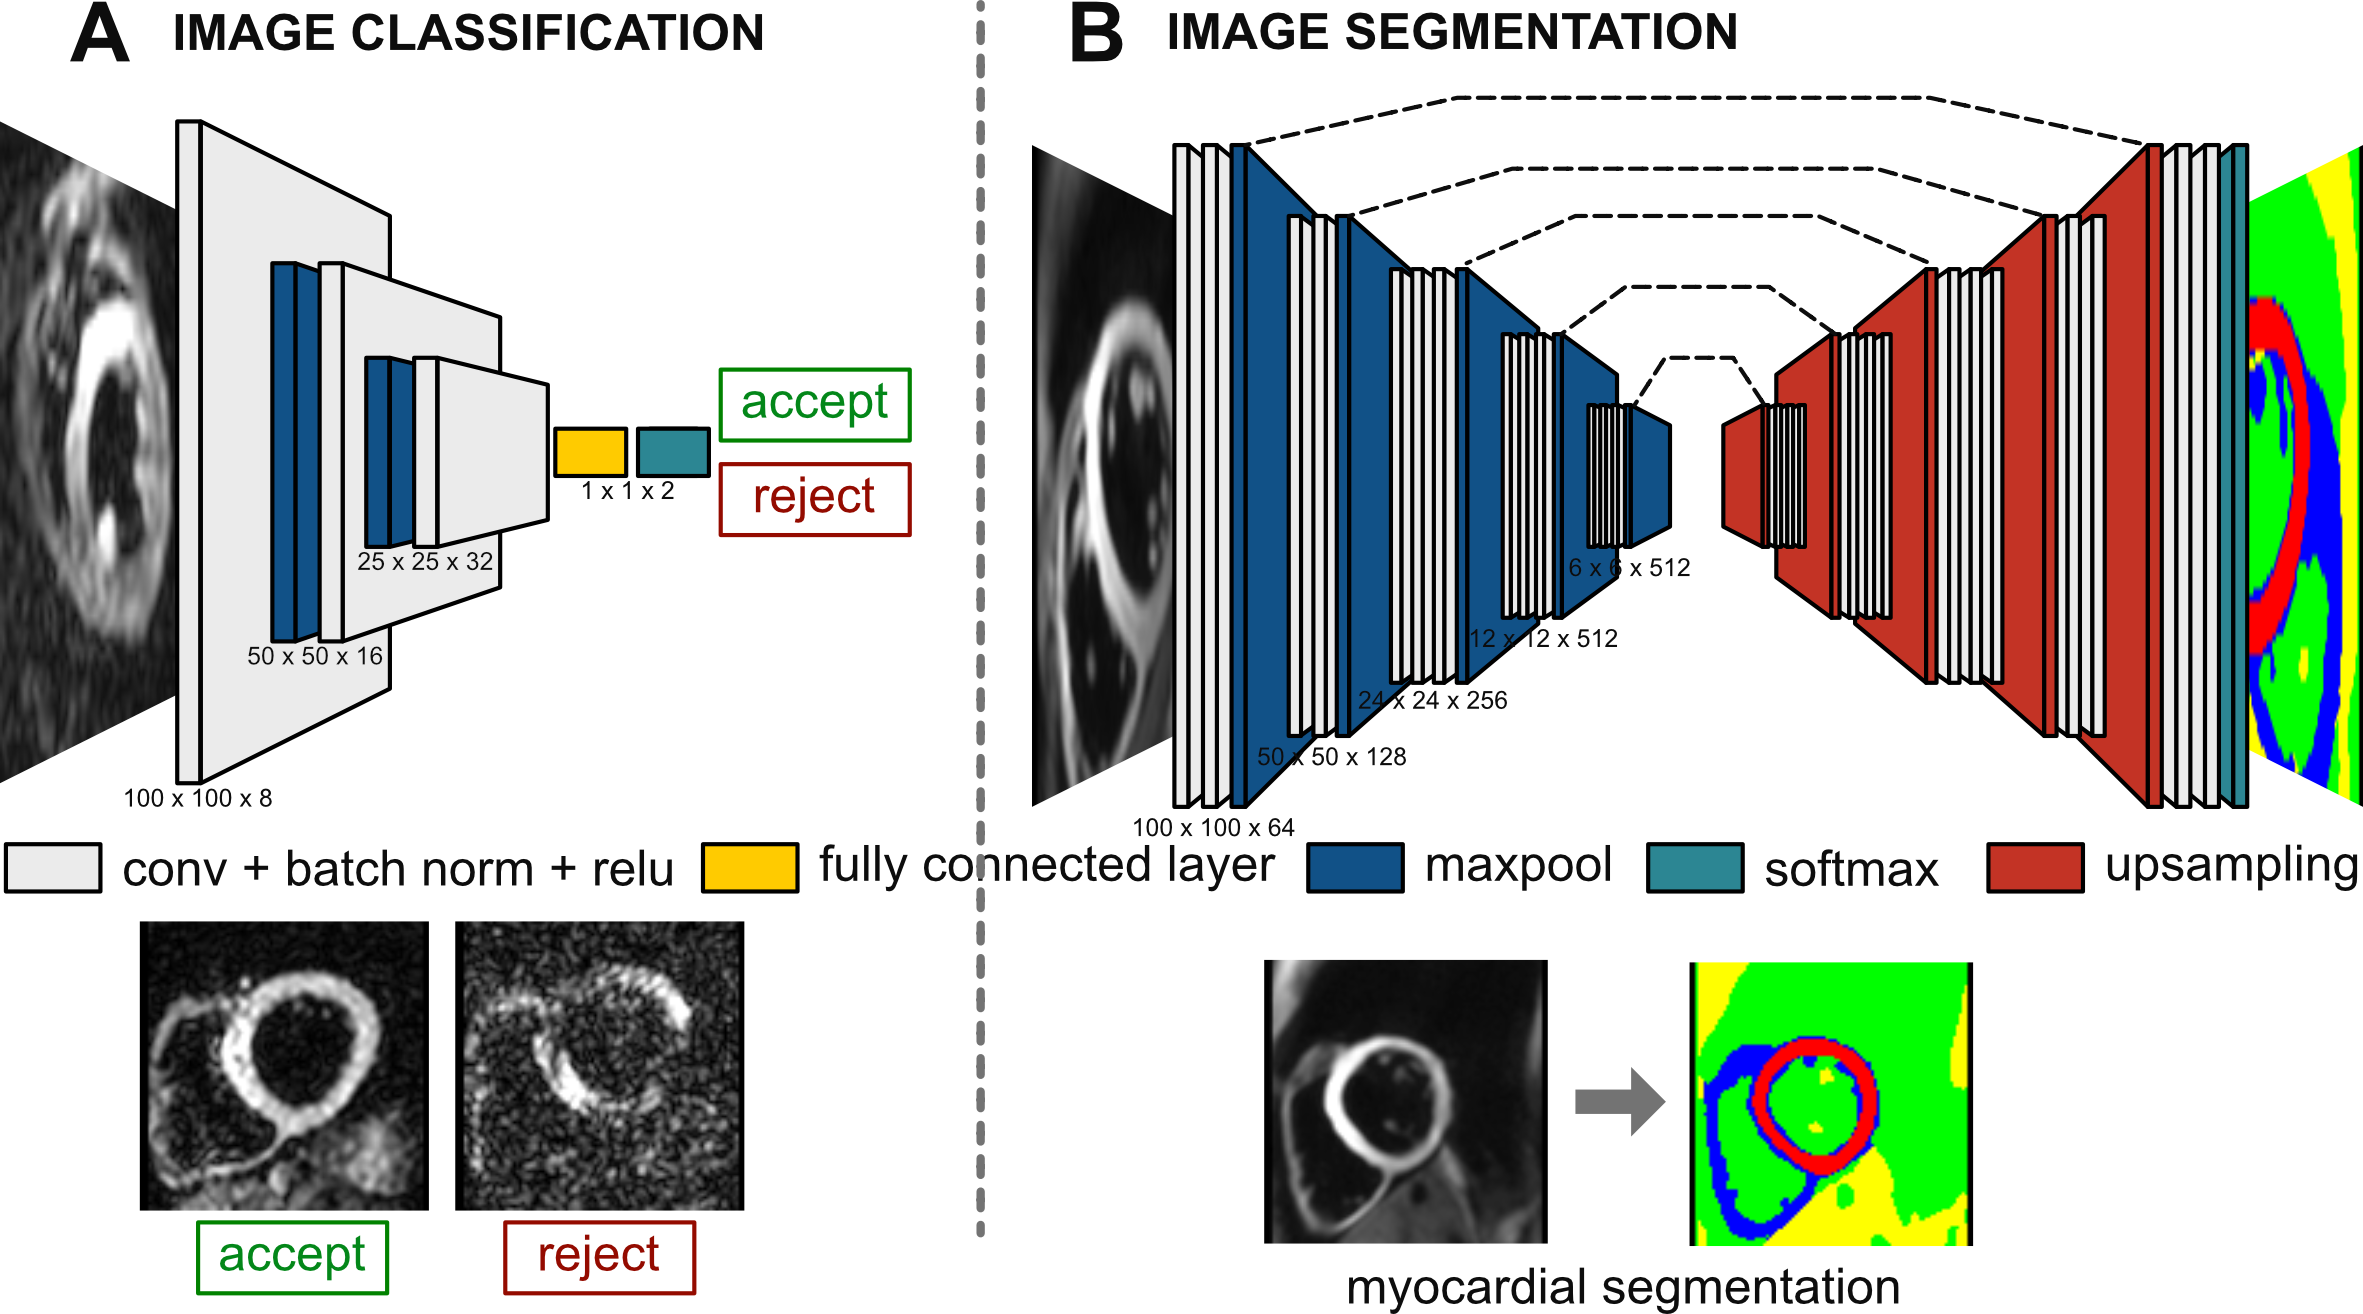
Image classifier: A simplified version of the VGG16 classification CNN2 (figure 1A) was used to detect and reject diffusion frames corrupted by motion artefacts.
Image segmentation: A SegNet CNN3 (figure 1B) was trained to segment the heart and more importantly the LV myocardium. The encoder network is also based on the VGG16 classification network.
After training and testing, the trained-CNNs were integrated within the DTI post-processing pipeline and compared against an experienced user on the test data.
RESULTS
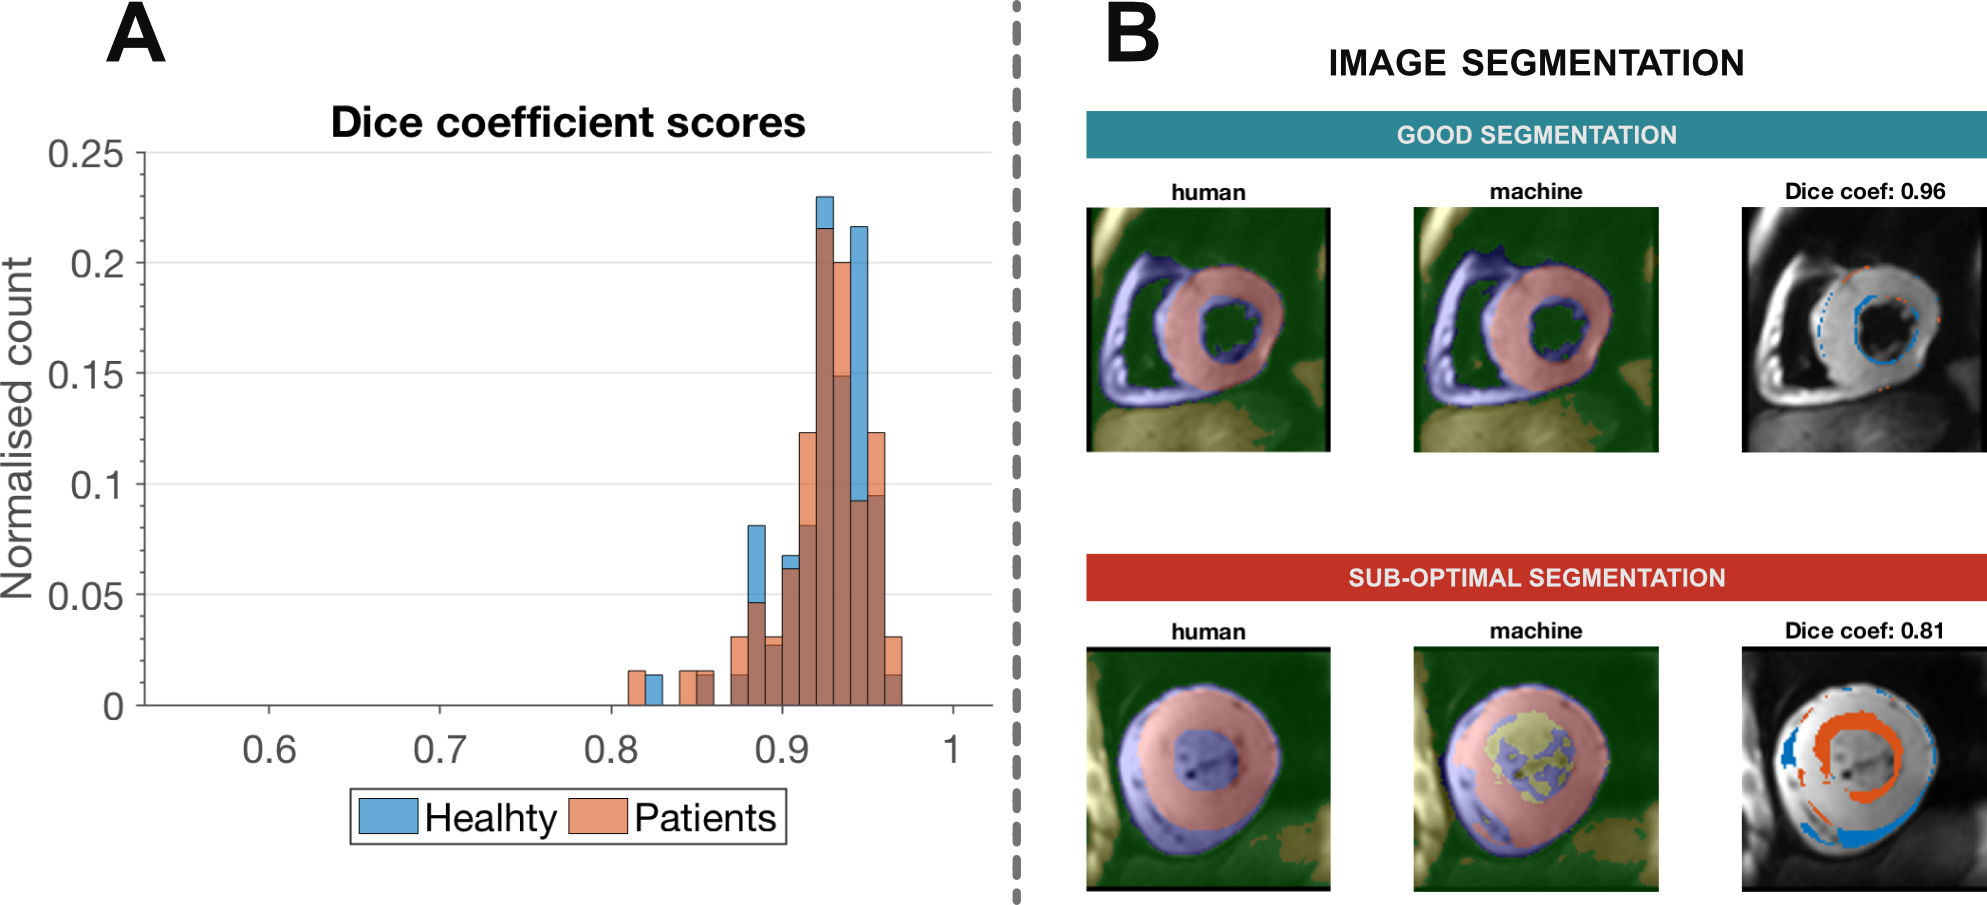
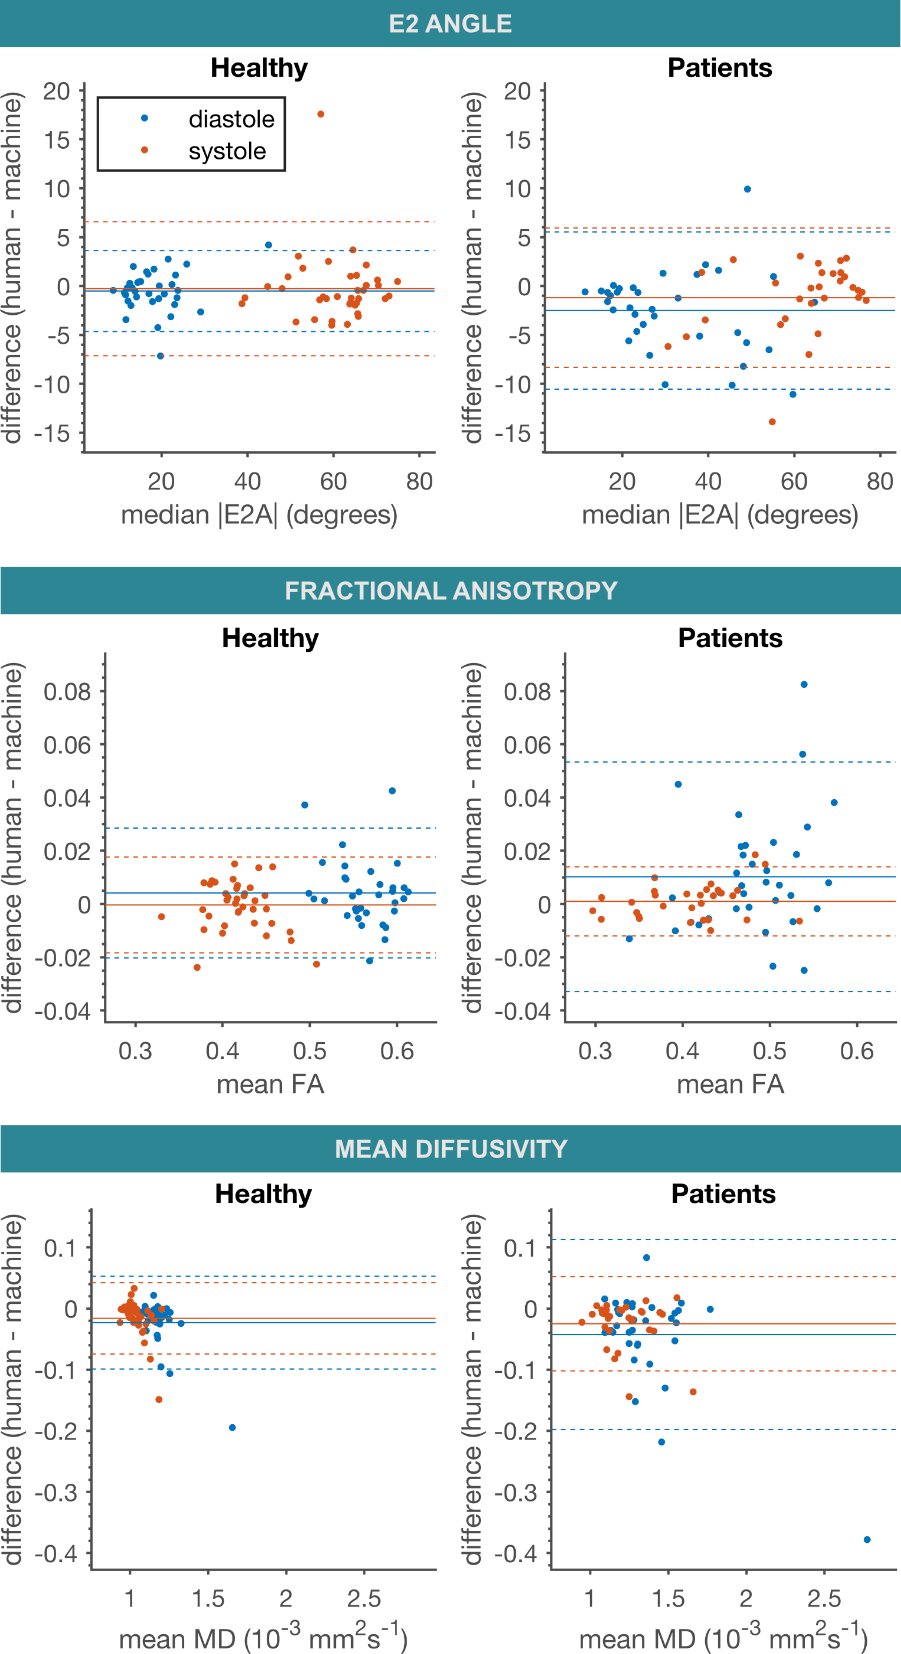
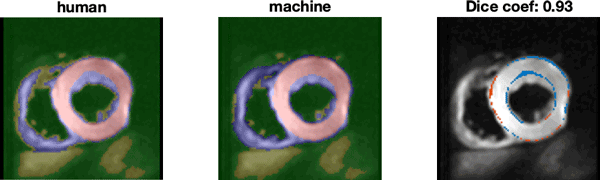
An accuracy of 94% was obtained when detecting corrupted frames. For the myocardial segmentation a global median Dice coefficient of 0.93 was achieved (figure 2). Figure 3 shows Bland-Altman plots comparing deep learning against an experienced user for global values of secondary eigenvector orientation (E2A), fractional anisotropy and mean diffusivity in healthy and patient data. The plots show minimal bias with good limits of agreement, in general slightly broader for the more heterogenous patient data. Figure 4 shows an animation of the segmentation for multiple patient examples.DISCUSSION
The fully automated DT-CMR analysis with deep learning performed effectively with high levels of accuracy when compared to an experienced user. Of note, the myocardial segmentation learned to correctly exclude papillary and right ventricular trabeculation from the LV myocardium, even in patient data with a more varied morphology.
We are currently porting this post-processing pipeline to the Gadgetron [4] framework in order to enable real-time online reconstruction of DT-CMR results for on-the-fly feedback and to be packaged as DICOM files with the rest of the study. Additionally we are comparing SegNet with the more popular U-Net, and using Bayesian optimisation in order to find the optimal CNN and training parameters specific to DT-CMR.
CONCLUSION
Inline real-time post-processing of DT-CMR data is possible with automation enabled by convolutional neural networks.Acknowledgements
The video card Titan Xp used for this research was donated by the NVIDIA Corporation.References
[1] Nielles-Vallespin S, Khalique Z, Ferreira PF, de Silva R, Scott AD, Kilner P, McGill L, Giannakidis A, Gatehouse PD, Ennis D, Aliotta E, Al-Khalil M, Kellman P, Mazilu D, Balaban RS, Firmin DN, Arai AE, Pennell DJ. Assessment of Myocardial Microstructural Dynamics by In Vivo Diffusion Tensor Cardiac Magnetic Resonance. J Am Coll Cardiol. 2017; 69: 661-676.
[2] K. Simonyan and A. Zisserman, “Very deep convolutional networks for large-scale image recognition,” arXiv preprint arXiv:1409.1556, 2014.
[3] Badrinarayanan V, Kendall A, Cipolla R. SegNet: A Deep Convolutional Encoder-Decoder Architecture for Image Segmentation. IEEE Transactions on Pattern Analysis and Machine Intelligence. 2017.
[4] Hansen MS, Sørensen TS. Gadgetron: an open source framework for medical image reconstruction. Magn Reson Med. 2013; 69: 1768-76.
Figures