2033
Analysis and Correction of Off-Resonance Artefacts in Free-Breathing In-Vivo Motion-Compensated Spin-Echo Cardiac Diffusion Tensor Imaging at 3T1Institute for Biomedical Engineering, University and ETH Zurich, Zurich, Switzerland
Synopsis
Cardiac diffusion tensor imaging (cDTI) sequences inherently suffer from low signal-to-noise (SNR) ratios. Although high field strength systems improve SNR, long single-shot readout trains such as echo-planar imaging experience detrimental effects due to changes in magnetic susceptibility at tissue boundaries. Using synthetic and in vivo free-breathing cDTI data, an iterative time-segmented off-resonance correction methodology was implemented and evaluated. Using this approach, the cDTI data was geometrically restored to the original shape, and underlying tensors metrics were corrected. The framework holds potential to aid geometrically accurate in vivo cDTI for multi-contrast and multi-modal imaging studies.
Introduction
Cardiac Diffusion Tensor Imaging (cDTI) is a promising technique to non-invasively probe myocardial microstructure1,2. To improve the inherently low signal-to-noise ratio (SNR) of cDTI sequences3, high field strength (≥3T) MR systems are increasingly used4,5. Single-shot readout methods associated with cDTI sequences, such as echo-planar imaging (EPI) or spiral imaging, require long readout durations. To this end, magnetic susceptibility-related off-resonance effects scaling with the main magnetic field can lead to geometric image distortions and signal pileup and/or attenuation6. Accordingly, robust off-resonance correction methods need to be implemented for in vivo cDTI. The goal of the current work was to analyze off-resonance effects and their correction using a realistic numerical phantom, and to apply off-resonance correction to in vivo cDTI data acquired during free-breathing using spin-echo-based cDTI sequences7.Methods
Numerical simulation
A cDTI extension was implemented for the MRXCAT framework to simulate cardiac diffusion contrast in the myocardium8. A static object image and coil sensitivities were simulated at 0.25x0.25 mm² in-plane resolution. An in vivo 3T field map was resliced and interpolated to match the object geometry. Tensors were simulated with the following properties: helix angle (HA) range 120°, sheet angle (absE2A) 35°, mean diffusivity (MD) 1.45x10⁻³ mm²/s, fractional anisotropy (FA) 0.46. Diffusion contrast was imposed to the object using equation 1:
$$Object\left(\overrightarrow{r}\right)=\left(\rho\left(\overrightarrow{r}\right)\cdot\frac{\left(1-e^{-\frac{TR}{T_{1,tissue}}}\right)}{\left(1-cos(\alpha)\cdot{}e^{-\frac{TR}{T_{1,tissue}}}\right)}\cdot{}sin\left(\alpha\right)\cdot{}e^{-\frac{TE}{T_{2,tissue}}}\right)\cdot{}e^{-b{}\overrightarrow{g}^{T}\overline{D}\left(\overrightarrow{r}\right)\overrightarrow{g}}$$
where$$$\;\rho\;$$$is the proton-density,$$$\;{r}\;$$$spatial position vector,$$$\;TR\;$$$repetition time,$$$\;TE\;$$$echo time,$$$\;T_{1,tissue}\;$$$and$$$\;T_{2,tissue}\;$$$tissue-dependent parameters, $$$\;\alpha\;$$$the flip angle,$$$\;\overline{D}\;$$$the local diffusion tensor,$$$\;b\;$$$the b-value, and$$$\;g\;$$$the diffusion encoding direction.
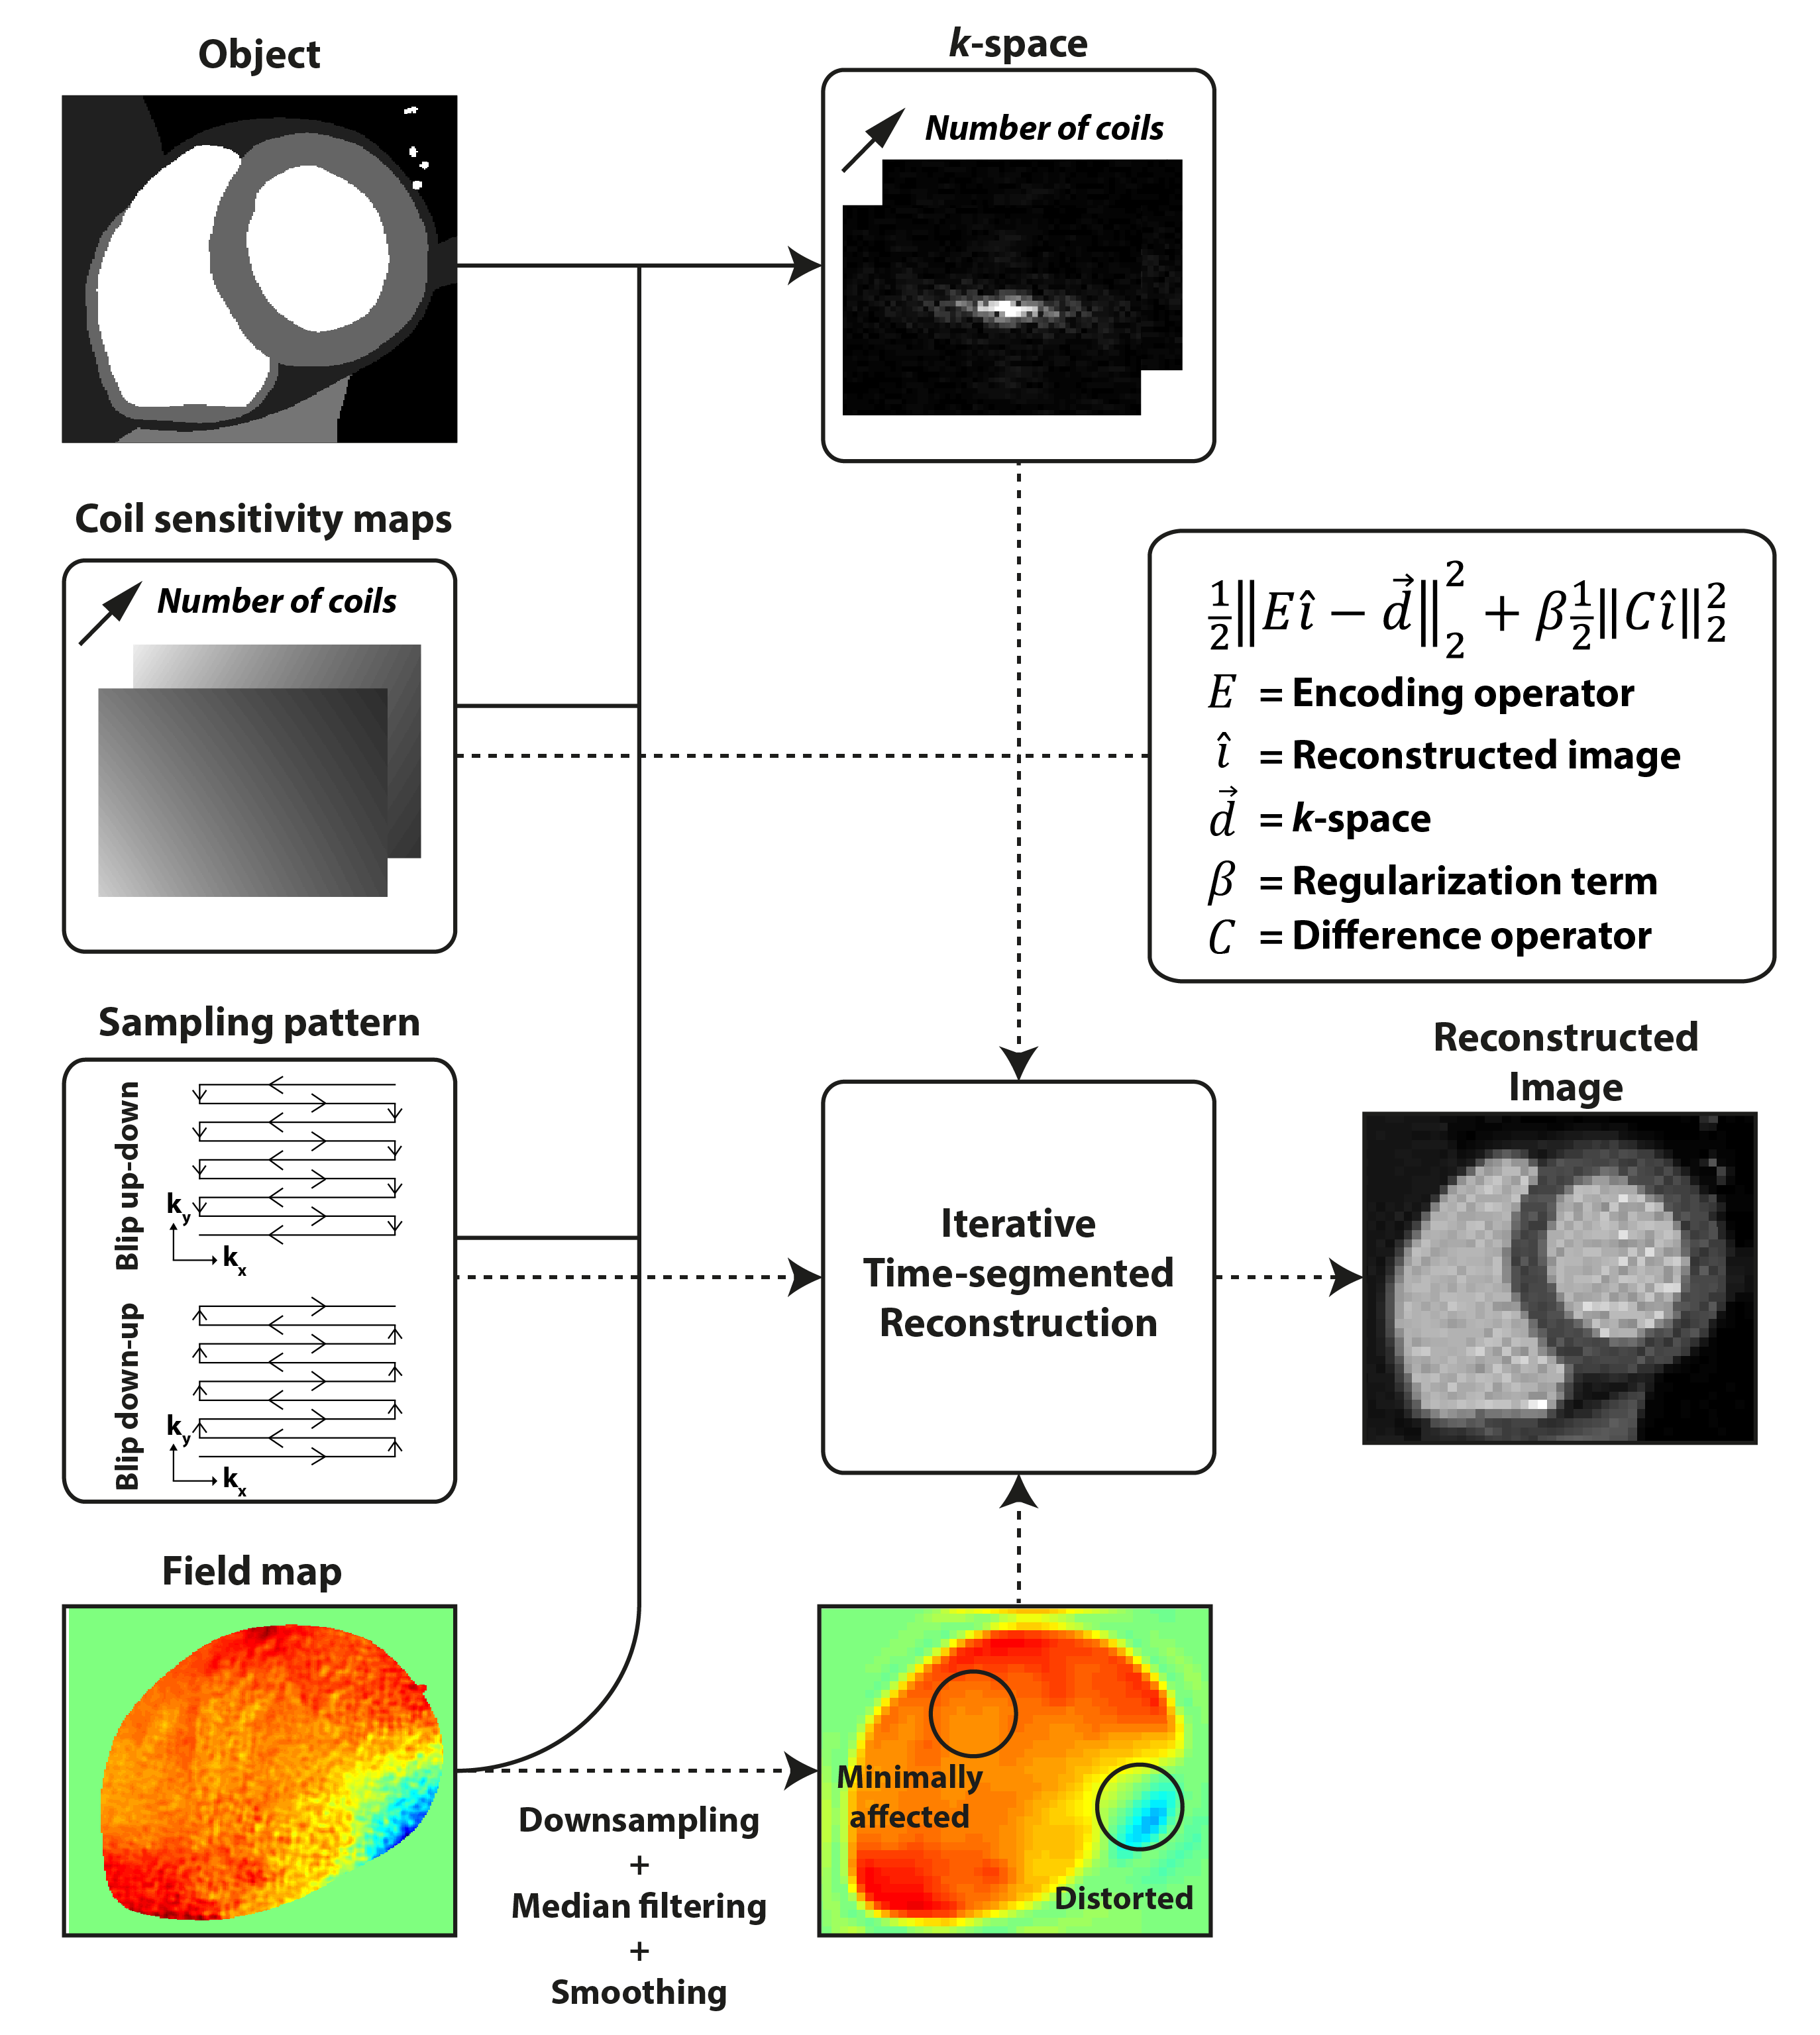
After multiplication with coil-sensitivities$$$\;C$$$, each coil image was encoded with a 2.5x2.5 mm² in-plane resolution to minimize inverse crime-effects9 using the forward model (Figure 1) described by equation 2:
$$S\left(\overrightarrow{k}\right)=\sum_{r}Object\left(\overrightarrow{r}\right)\cdot{}C\left(\overrightarrow{r}\right)\cdot{}e^{-i2\pi\overrightarrow{k}\left(t\right)\overrightarrow{r}}\cdot{}e^{-i2\pi\Delta{}F_{0}\left(\overrightarrow{r}\right)t}\cdot{}e^{-\frac{\left|t\right|}{T_{2}^{*}\left(\overrightarrow{r}\right)}}$$
where$$$\;{k}\;$$$is the$$$\;k\;$$$-vector,$$$\;{r}\;$$$spatial position vector,$$$\;t\;$$$sampling time,$$$\;\Delta{}F_{0}\;$$$off-resonances in Hertz, and$$$\;T_{2}^{*}\;$$$the off-resonance dependent$$$\;T_{2}\;$$$values. MRXCAT parameters were: reduced-FOV 303x98 mm², average SNR in myocardium of the b = 0 s/mm² image 40, number of coils 2, signal averages 10, TR/TE 2000/83 ms, flip angle 85°, number of diffusion directions3 12, bandwidth EPI readout 35 Hz/pixel,$$$\;T_{1}$$$/$$$T_{2}\;$$$myocard 900/50 ms, EPI blip directions up-down and down-up. A ground truth dataset was simulated with no off-resonance effects.
In vivo data acquisition
All scans were performed on a 3T clinical MR system (Philips Healthcare, Best, The Netherlands) using a 32-channel cardiac receiver array and a gradient system delivering 80mT/m@100mT/m/ms. Data acquisition was electrocardiogram (ECG) triggered and performed using navigator gating and slice-tracking (7 mm gating window) free-breathing acquisition. cDTI data was acquired using a single-slice in short-axis view orientation at mid-ventricular level, spectral-spatial fat-suppression10, and a gradient scheme with 12 directions3. The imaging parameters were: spatial resolution 2.5x2.5 mm², slice thickness 8 mm, reduced-FOV11 230x111 mm², TR/TE = 2 R-R / 83 ms, signal averages 10, trigger delay (TD) 65% peak-systole, EPI blip directions up-down and down-up. A field map was acquired breath-held in the same heart phase as the cDTI acquisition with parameters: spatial resolution 1x1mm², slice thickness 8 mm, FOV 316x231 mm², TR/$$$\Delta{}TE\;$$$6.21/2.25 ms. 5 healthy volunteers (3 male, HR 67±5 beats/min, age 23±3 years) were imaged.
Data reconstruction
Prior to reconstruction, the field map was downsampled, masked, median filtered, and smoothed (Figure 1). In vivo cDTI data was coil-compressed to 10 virtual coils12 before being reconstructed using an iterative time-segmented off-resonance correction13, with a regularization parameter setting to affect the nominal resolution no more than 5%14.
Data analysis
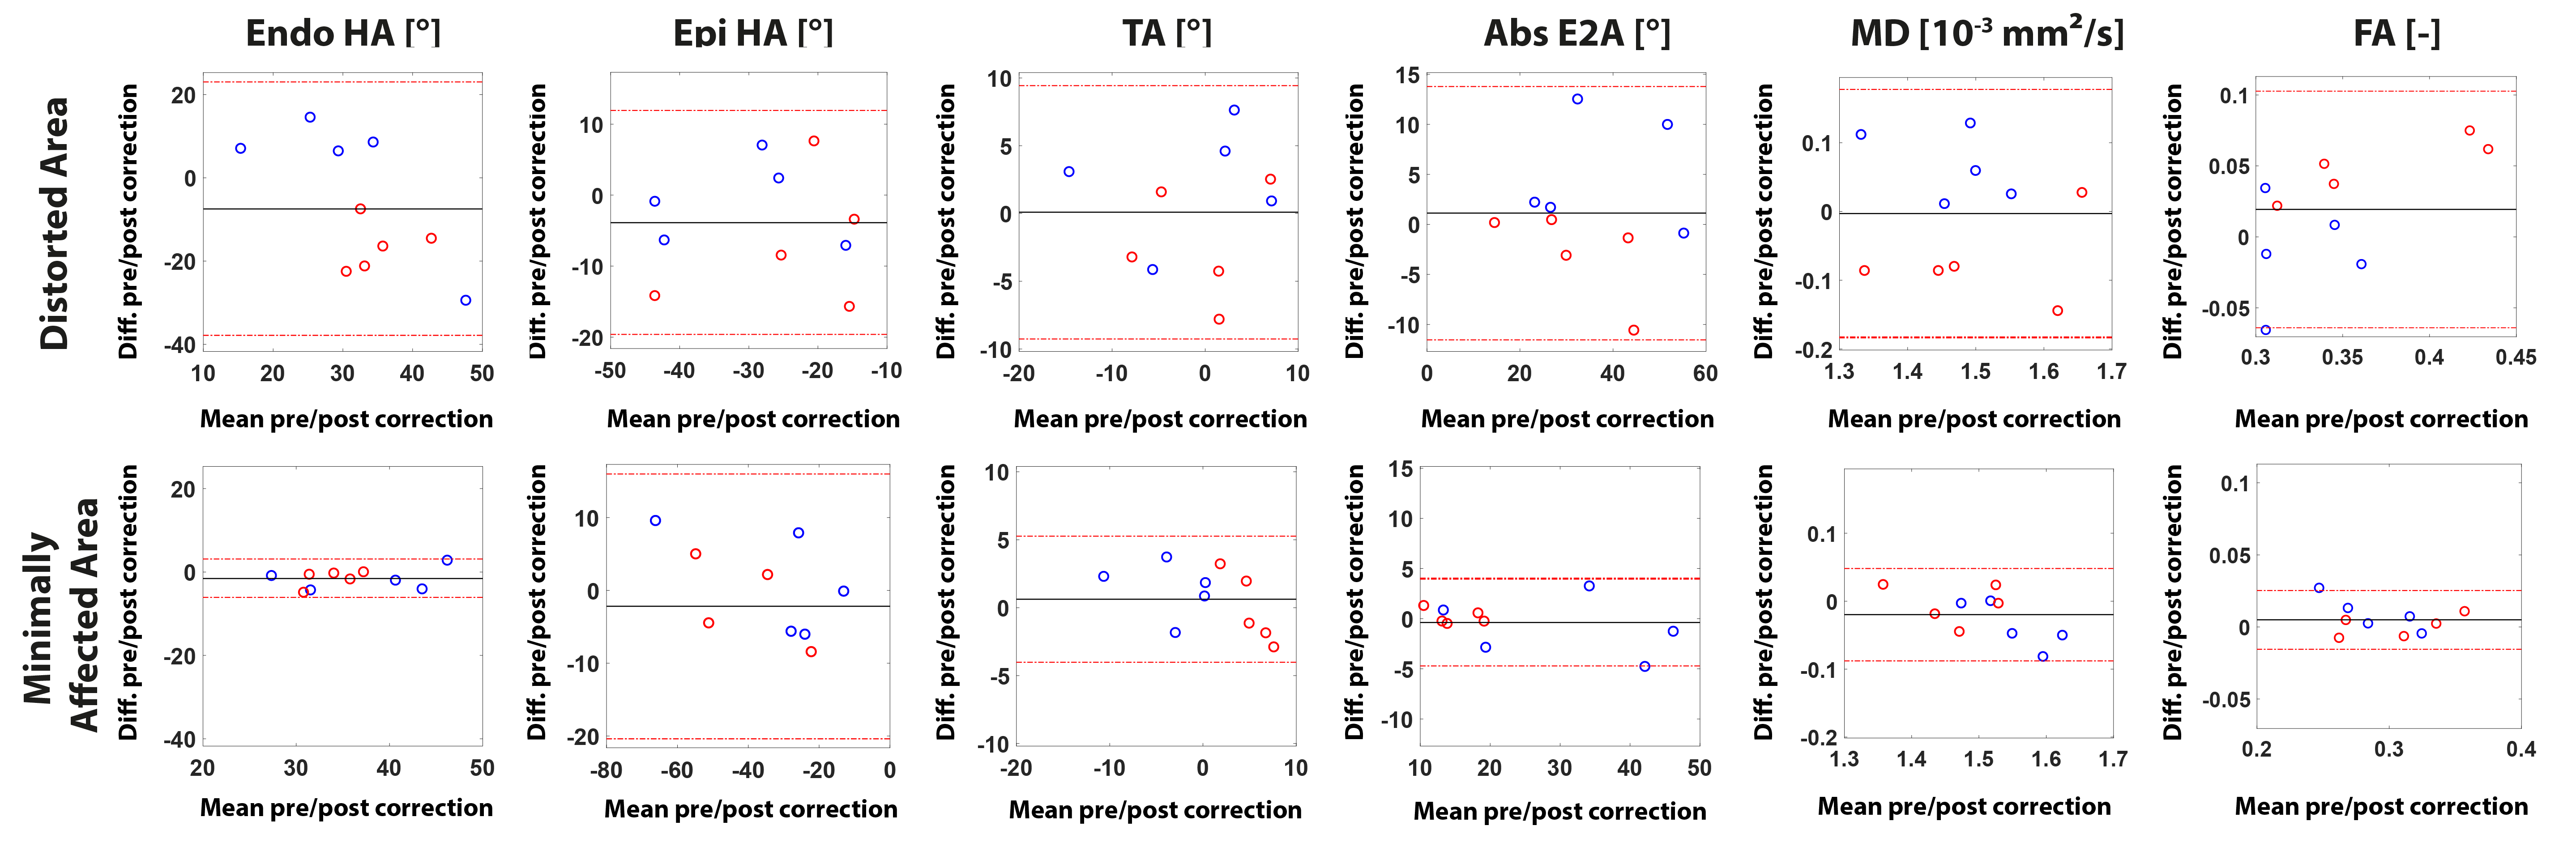
In vivo images were registered using non-rigid image registration15. After computing the diffusion tensors, HA, transverse angle (TA), absE2A, MD, and FA were estimated16-18. AHA sectors 3 (distorted area) and 6 (minimally affected area) were used for analysis (Figure 1).
Results
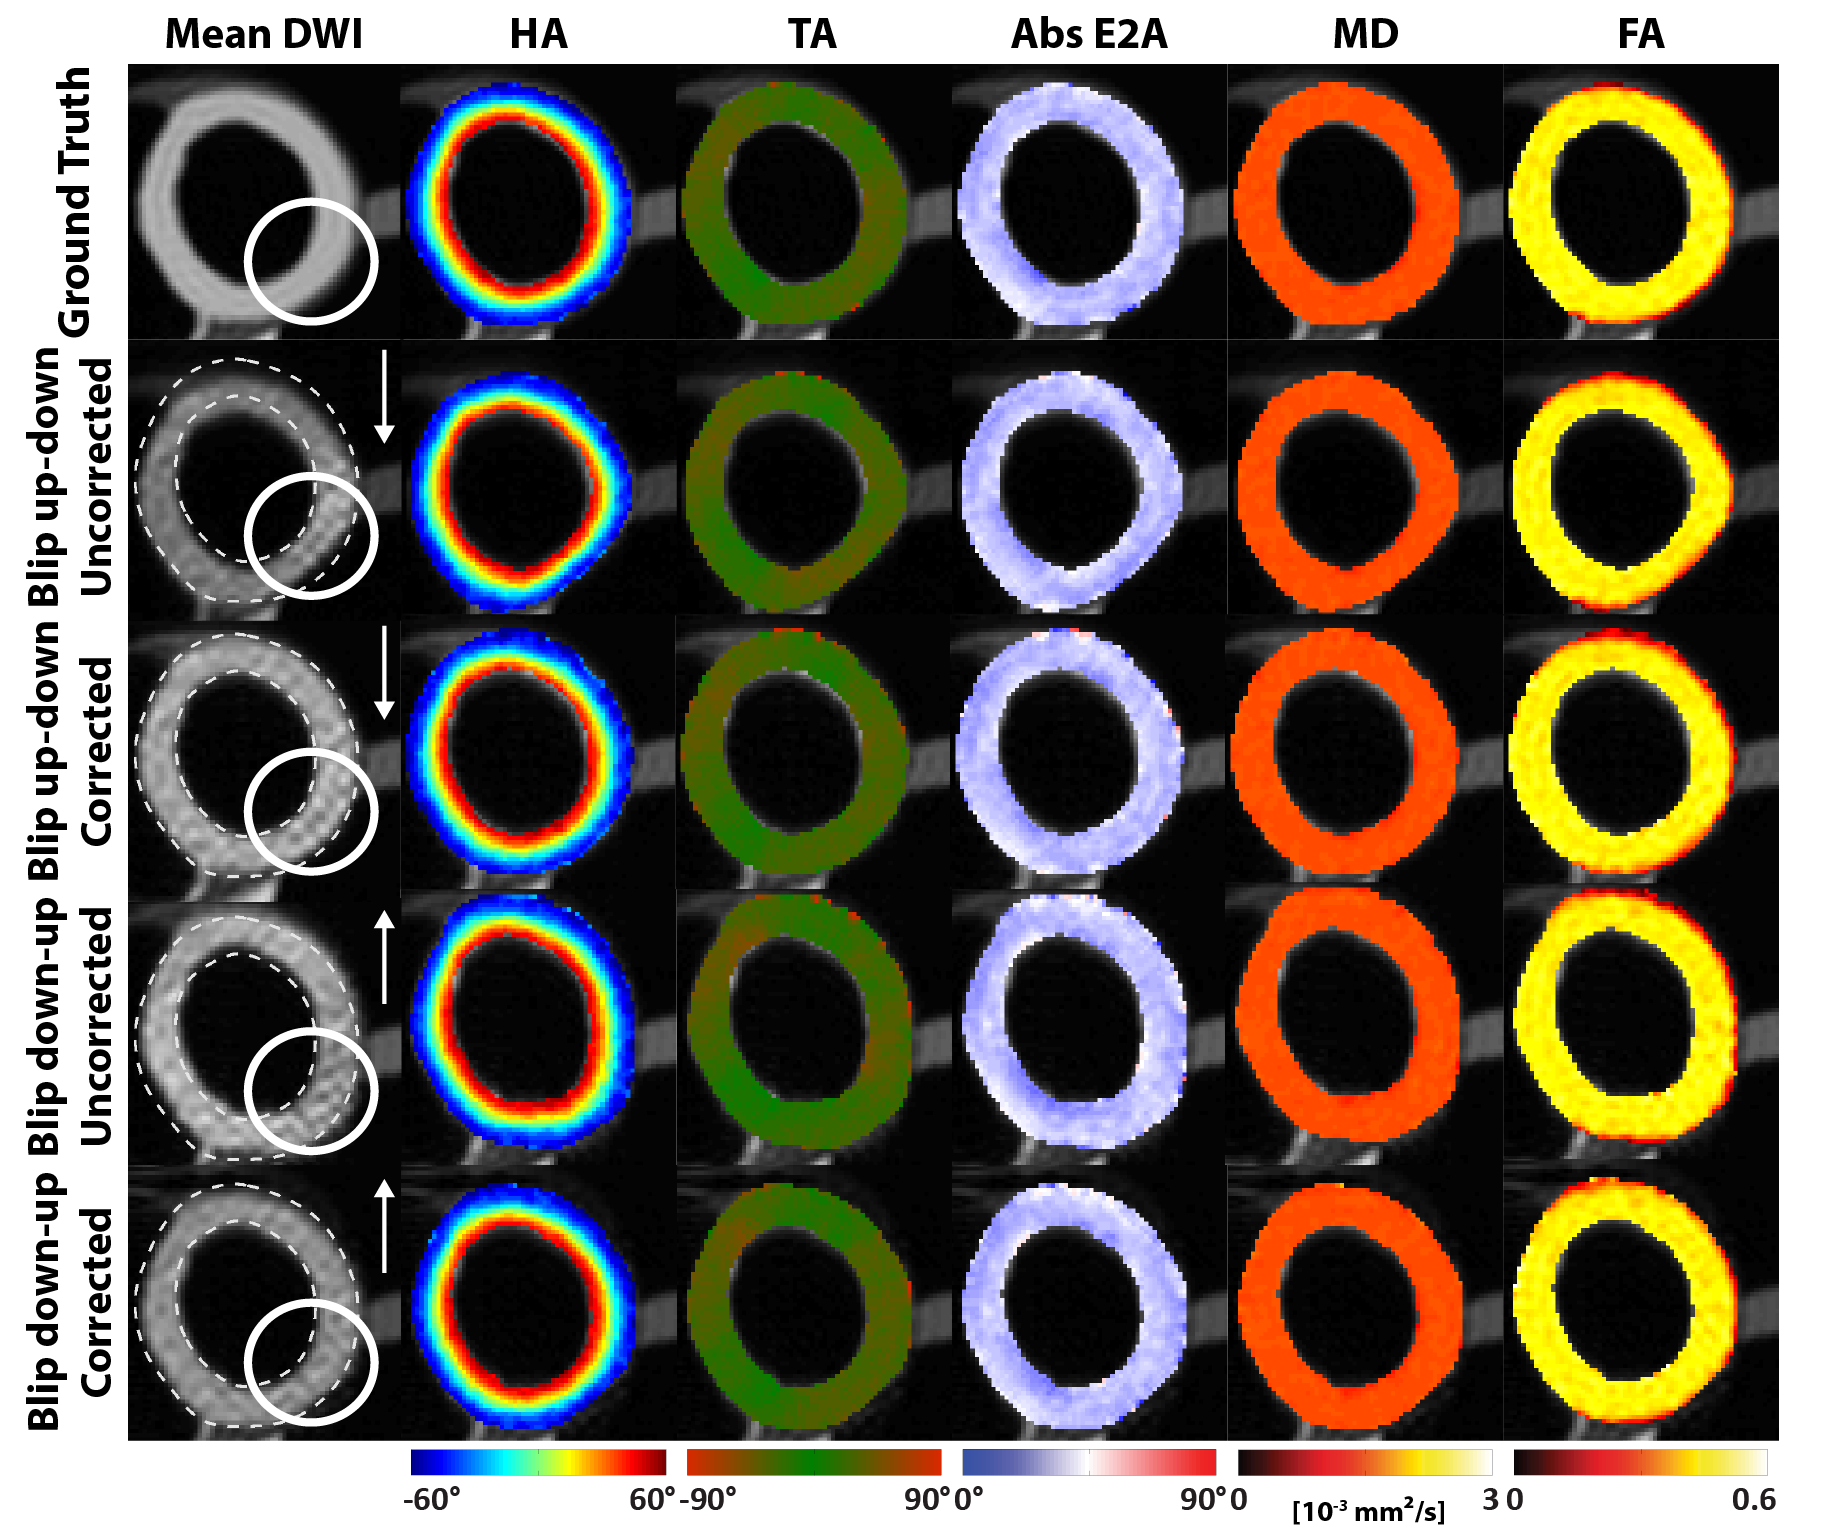
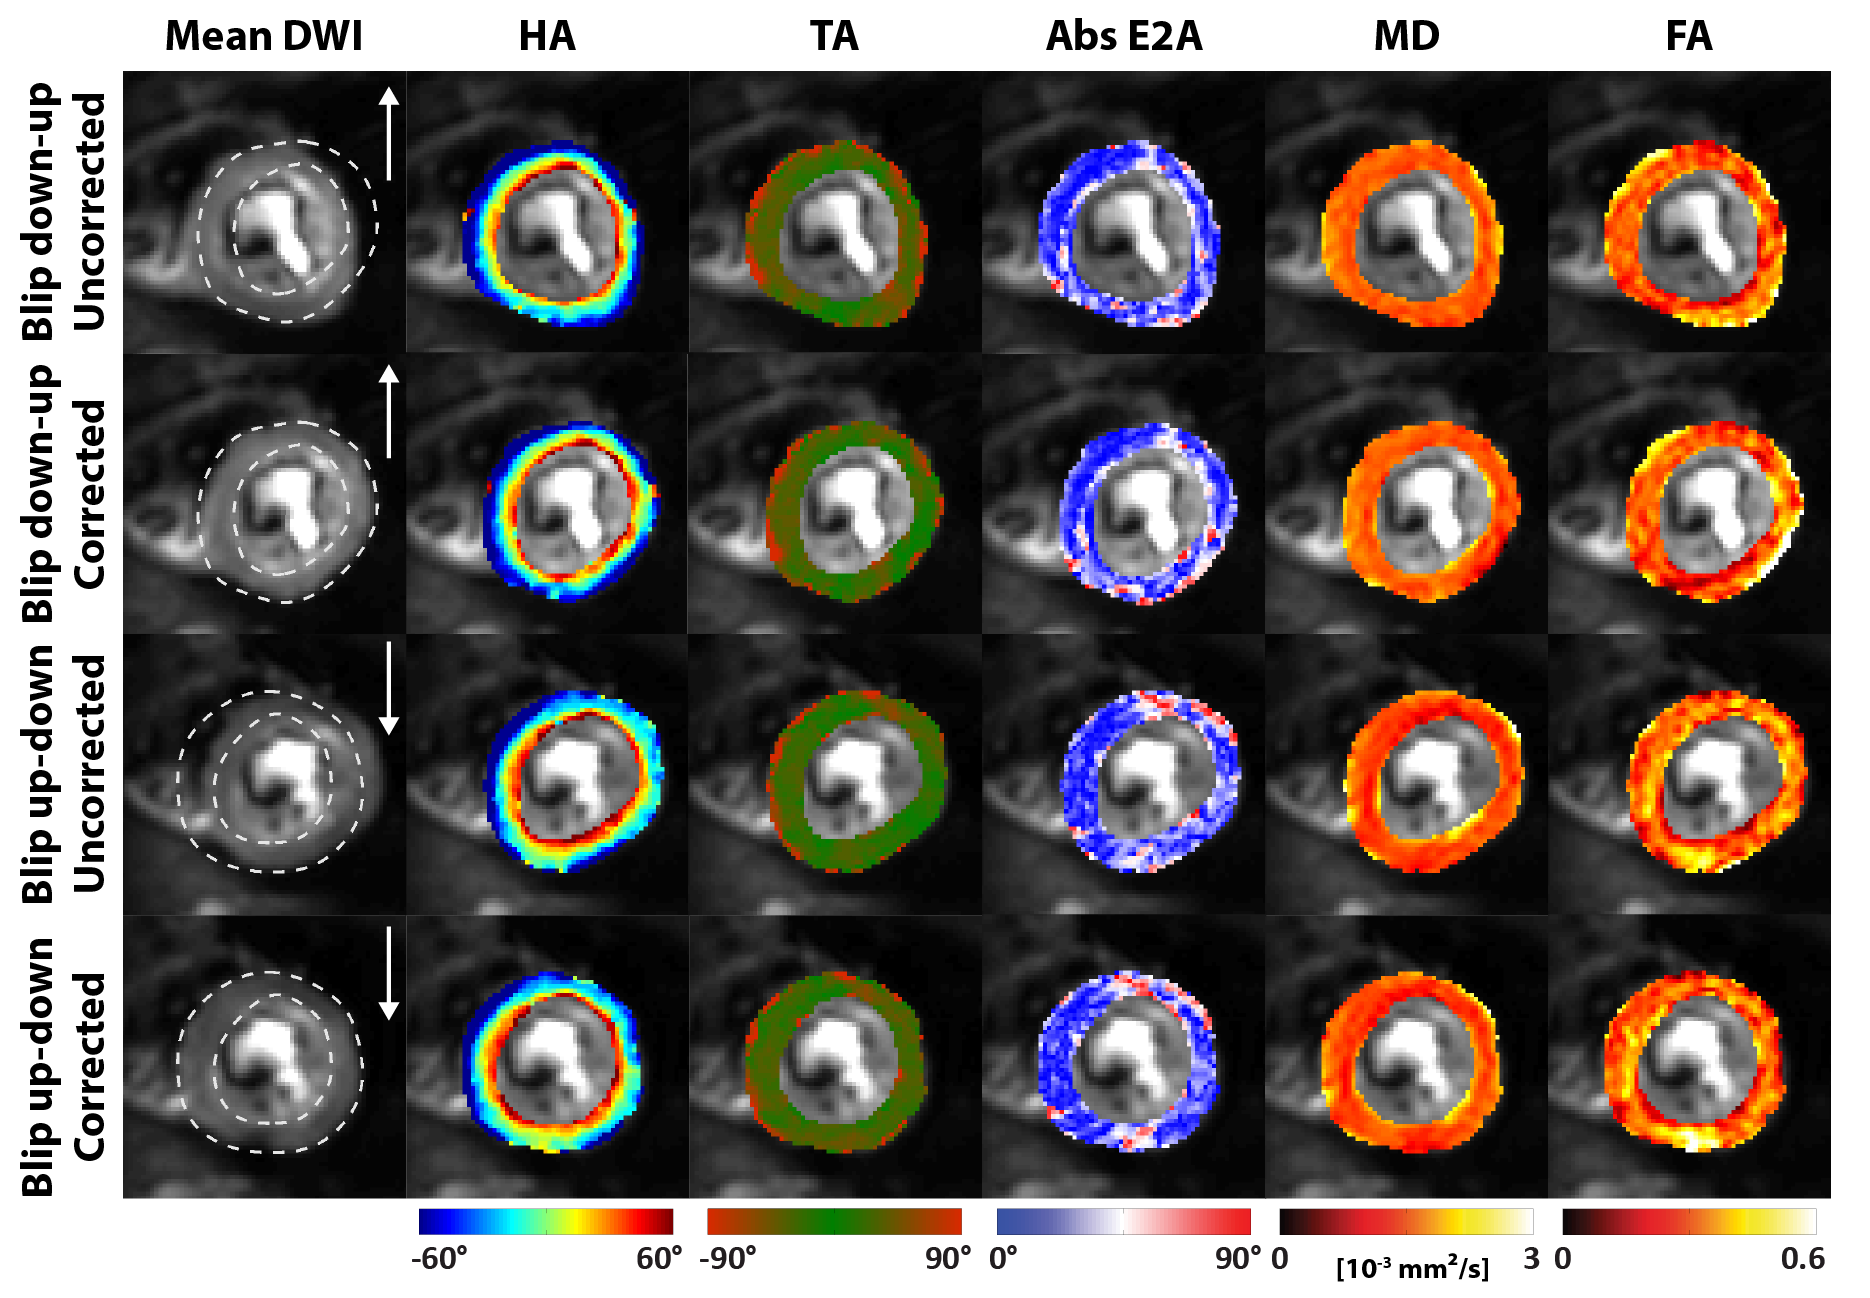
Synthetic cDTI data shows that localized image compression or stretching can be restored to the ground truth shape (Figure 2). Histograms of the distorted area and corrected area indicate no deviation from ground truth value, with exception of the TA (Figure 3). Figure 4 shows an exemplary in vivo off-resonance corrected case for both EPI blip directions. Corresponding Bland-Altman plots show a 2x-10x higher difference between pre- and post-correction for off-resonance affected areas compared to minimally affected areas (Figure 5).Discussion
Using a field map, both synthetic cDTI data and free-breathing cDTI data could be successfully corrected for off-resonance induced geometrical distortions. The EPI phase-encode blip direction causing image stretching is considered favorable over image compression. It is concluded to include off-resonance correction in in vivo cDTI data acquired at 3T.Acknowledgements
No acknowledgement found.References
1. Nielles-vallespin S, Khalique Z, Ferreira PF, et al. Assessment of Myocardial Microstructural Dynamics by In Vivo Diffusion Tensor Cardiac Magnetic Resonance. 2017;69. doi: 10.1016/j.jacc.2016.11.051.
2. von Deuster C, Sammut E, Asner L, Nordsletten D, Lamata P, Stoeck CT, Kozerke S, Razavi R. Studying Dynamic Myofiber Aggregate Reorientation in Dilated Cardiomyopathy Using In Vivo Magnetic Resonance Diffusion Tensor Imaging. Circ. Cardiovasc. Imaging [Internet] 2016;9:e005018. doi: 10.1161/CIRCIMAGING.116.005018.
3. von Deuster C, Stoeck CT, Genet M, Atkinson D, Kozerke S. Spin echo versus stimulated echo diffusion tensor imaging of the in vivo human heart. Magn. Reson. Med. [Internet] 2016;76:862–872. doi: 10.1002/mrm.25998.
4. Moulin K, Croisille P, Feiweier T, Delattre BMA, Wei H, Robert B, Beuf O, Viallon M. In Vivo Free-Breathing DTI and IVIM of the Whole Human Heart Using a Real-Time Slice-Followed SE-EPI Navigator-Based Sequence : A Reproducibility Study in Healthy Volunteers. Magn. Reson. Med. 2015;00. doi: 10.1002/mrm.25852.
5. Gorodezky M, Scott AD, Ferreira PF, Nielles-vallespin S, Pennell DJ, Firmin DN. Diffusion Tensor Cardiovascular Magnetic Resonance With a Spiral Trajectory : An In Vivo Comparison of Echo Planar and Spiral Stimulated Echo Sequences. 2017;00. doi: 10.1002/mrm.27051.
6. Bernstein MA, King KF, Zhou XJ. Chapter 16 – Echo Train Pulse Sequences. In: Bernstein MA, King KF, Zhou XJ. Burlington: Academic Press; 2004. pp. 702–801. doi: https://doi.org/10.1016/B978-012092861-3/50023-6.
7. Stoeck CT, von Deuster C, Genet M, Atkinson D, Kozerke S. Second-order motion-compensated spin echo diffusion tensor imaging of the human heart. Magn. Reson. Med. [Internet] 2015. doi: 10.1002/mrm.25784.
8. Wissmann L, Santelli C, Segars WP, Kozerke S. MRXCAT: Realistic numerical phantoms for cardiovascular magnetic resonance. J. Cardiovasc. Magn. Reson. [Internet] 2014;16:63. doi: 10.1186/s12968-014-0063-3.
9. Guerquin-Kern M, Lejeune L, Pruessmann KP, Unser M. Realistic Analytical Phantoms for Parallel Magnetic Resonance Imaging. IEEE Trans. Med. Imaging 2011;31:626–636. doi: 10.1109/TMI.2011.2174158.
10. Meyer CH, Pauly JM, Macovskiand A, Nishimura DG. Simultaneous spatial and spectral selective excitation. Magn. Reson. Med. 1990;15:287–304. doi: 10.1002/mrm.1910150211.
11. Reischauer C, Wilm BJ, Froehlich JM, Gutzeit A, Prikler L, Gablinger R, Boesiger P, Wentz KU. High-resolution diffusion tensor imaging of prostate cancer using a reduced FOV technique. Eur. J. Radiol. 2011;80:34–41. doi: 10.1016/j.ejrad.2010.06.038.
12. Buehrer M, Pruessmann KP, Boesiger P, Kozerke S. Array compression for MRI with large coil arrays. Magn. Reson. Med. 2007;57:1131–1139. doi: 10.1002/mrm.21237.
13. Sutton BP, Noll DC, Fessler JA. Fast, iterative image reconstruction for MRI in the presence of field inhomogeneities. IEEE Trans. Med. Imaging 2003;22:178–188. doi: 10.1109/TMI.2002.808360.
14. Fessler JA, Rogers WL. Spatial resolution properties of penalized-likelihood image reconstruction: Space-invariant tomographs. IEEE Trans. Image Process. 1996;5:1346–1358. doi: 10.1109/83.535846.
15. Vishnevskiy V, Gass T, Szekely G, Tanner C, Goksel O. Isotropic Total Variation Regularization of Displacements in Parametric Image Registration. 2017;36:385–395.
16. Ferreira PF, Kilner PJ, McGill L-A, et al. In vivo cardiovascular magnetic resonance diffusion tensor imaging shows evidence of abnormal myocardial laminar orientations and mobility in hypertrophic cardiomyopathy. J. Cardiovasc. Magn. Reson. [Internet] 2014;16:87. doi: 10.1186/s12968-014-0087-8.
17. D.F JS, Alex H, Raimond W, Forder. Histological validation of myocardial microstructure obtained from diffusion tensor magnetic resonance imaging. Am. J. Physiol. Heart Circ. Physiol. 1998;275:2308–2318.
18. Stoeck CT, Kalinowska A, Von Deuster C, et al. Dual-phase cardiac diffusion tensor imaging with strain correction. PLoS One 2014;9:1–12. doi: 10.1371/journal.pone.0107159.
Figures