2032
A real-time myocardial velocity encoding sequence to optimize trigger delay in motion-compensated cardiac DWI1IADI, INSERM U1254 and Université de Lorraine, Nancy, France, 2Department of Radiology, Stanford University, Stanford, CA, United States, 3Department of Cardiothoracic Surgery, CHU Strasbourg, Strasbourg, France, 4Université de Strasbourg, Strasbourg, France, 5CIC-IT, INSERM 1433, Université de Lorraine and CHRU Nancy, Nancy, France
Synopsis
Motion-compensated spin echo sequences have been developed to obtain diffusion sensitivity in the presence of bulk cardiac motion. First and second order motion can be compensated but higher order motion can occur in certain cardiac phases. Here, we propose a real-time velocity-encoded sequence (6ms time resolution) to optimize and adapt the trigger delay on a subject-specific basis. In one volunteer, the variability in diffusion signal was analyzed as a function of trigger delay and compared to myocardial velocity profiles. Mid-systole was found to provide the most reliable ADC and conversely the worst ADC was found in early diastole.
Introduction
Motion management is a challenge in cardiac diffusion weighted imaging (DWI) since diffusion is based on the measurement of microscopic motion and the heart undergoes macroscopic motion during diffusion encoding and data acquisition. Thus, motion-compensated spin echo sequences have been developed to obtain diffusion sensitivity in the presence of bulk cardiac motion. First and second order motion-compensated spin-echo sequence (M1M2-SE) provides acceptable motion compensation and diffusion encoding gradients duration (1). Nevertheless, higher order motion (i.e. non-constant acceleration) is likely to occur depending on the cardiac phase chosen for diffusion encoding and data acquisition; therefore a good choice of the cardiac trigger delay is of particular importance. Currently, this choice is usually made based on visual inspection of CINE images. The purpose of this work was to use a real-time velocity-encoded sequence to optimize and adapt the trigger delay on a subject-specific basis.Methods
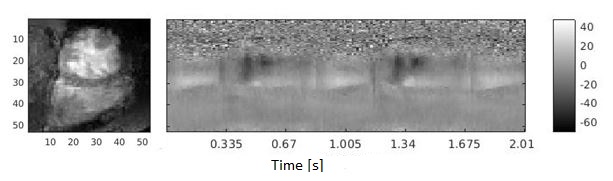
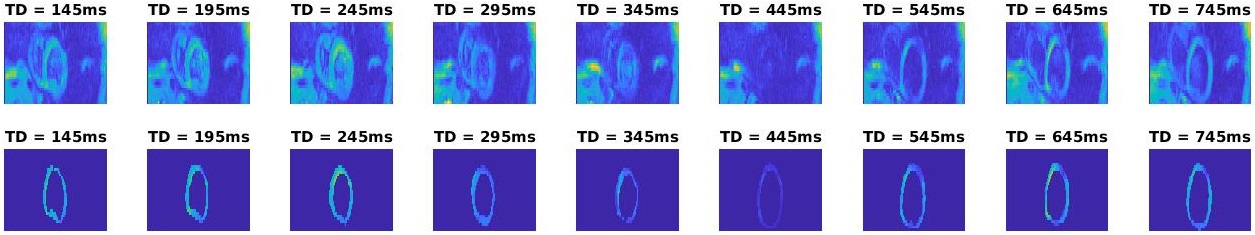
Measurement of subject-specific cardiac trigger delays: A real-time phase-contrast (RTPC) sequence (IDEA, Siemens, Erlangen, Germany) that consists of a velocity-encoded sequence wherein only the central line of k-space is acquired repeatedly. This projection of the blood/tissue velocities onto the frequency axis is obtained in real-time (6ms resolution). In previous work, the RTPC method was shown to identify the precise timing of the cardiac phases, similar to Doppler echocardiography(2) (Fig. 1). The RTPC curves are obtained by automatic segmentation of the left ventricular (LV) region through a singular value decomposition (SVD), as previously described (2). A template cardiac cycle is also reconstructed by averaging all cardiac cycles (after scaling using the Feinstein formula). Data acquisition: Data were acquired using a 3T MRI scanner (Prisma, Siemens) in one healthy volunteer. All the images were acquired in a short-axis slice with 8mm slice thickness. The RTPC sequence was then acquired during free-breathing with a repetition time of 5.9ms that corresponds to the temporal resolution of the sequence and a maximum velocity encoding VENC=150 cm/s². The slice was oriented such that the septal wall was parallel to the phase-encoding (FOV=300x300mm², 128 readout samples). A total of 5120 k-space center lines were acquired, corresponding to 36 complete cardiac cycles with a heart cycle duration of 824.3+/-38.5ms. DWI were acquired during a breath hold using a M1M2-SE DWI sequence and the following parameters: 2.0x2.0mm² pixel spacing, inner-volume excitation, GRAPPA factor 2, TE /TR =59ms/2RR, 1 direction [Gx,Gy,Gz]=[1,1,1], b-value of 0s/mm² (1 average) and 350s/mm² (6 averages). The DWI sequence was repeated with a wide range of trigger delays (TD). An in-house system was used to record the ECG/MR gradient signals (with real-time denoising) (3), for combination with the RTPC raw data. Data analysis: The variability in diffusion signal was analyzed as a function of TD and corresponding myocardial RTPC curves (velocity, acceleration and higher-order profiles). Apparent diffusion coefficient (ADC) map were calculated for each TD and LV was manually segmented as shown in figure 2.Results
Figure 2
shows the measured DW images (b=350) obtained for each TD, along with the segmented
myocardial mask. Figure
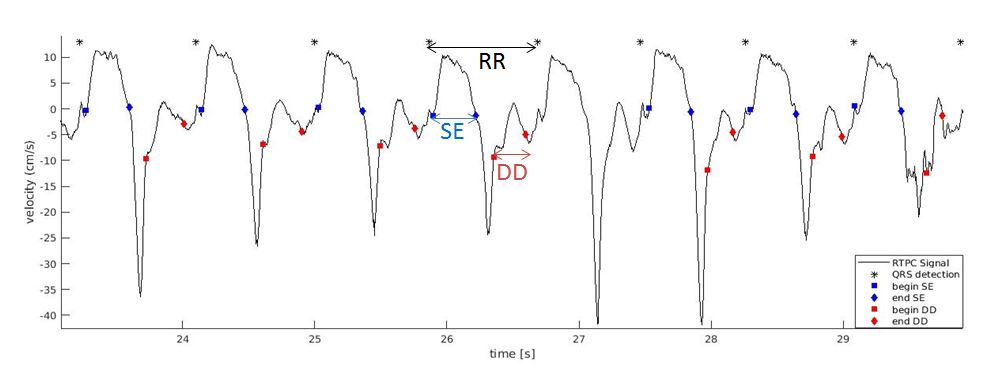
3 shows the RTPC velocity profile measured in the LV and the location of
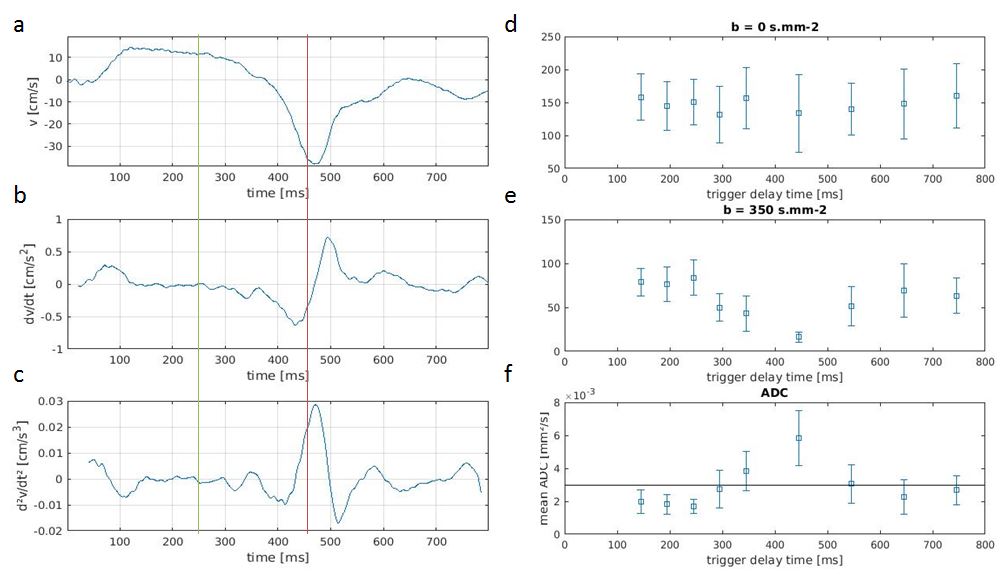
cardiac phases. Figure 4 shows the comparison of the RTPC velocity
(and higher-order motion) profiles and myocardial ADC values as a function of TD.
The lowest ADC value (which also has the lowest standard deviation) is found for
a trigger time of 245ms, corresponding to a time near the center of the
systolic ejection phase. Conversely, the largest ADC value (and with highest
variability) is found for a TD of 445ms, corresponding to early diastole. Discussion and Conclusion
The measured variations in myocardial ADC as a function of TD correspond well to the RTPC findings. Since the measured velocity profiles are a spatial average, with contributions from other tissues orthogonal to the frequency axis, the RTPC does not provide absolute velocity measurements. Nevertheless, the shape of the velocity curve allows accurate identification of the main events of the cardiac cycle, and the time-derivatives seem to give a good indication of the cardiac windows that are more likely to undergo high-order motion (i.e. non-constant acceleration) that cannot be compensated by the M1M2-SE DWI sequence. These preliminary results confirm the sensitivity of the diffusion signal to TD as shown previously (4)(5). The RTPC sequence is easy to implement and could be performed as a calibration step, to provide more accurate subject-specific TD than a conventional cine. Since the RTPC sequence provides real-time information, it could also be used to obtain an adaptive TD, taking into account heart rate variability through the DWI acquisition.Acknowledgements
This work was supported by the “Agence Nationale de la Recherche” for the “Investissement d’avenir” program: ANR-15-RHU-0004.References
1. Gamper U, Boesiger P, Kozerke S. Diffusion imaging of the in vivo heart using spin echoes–considerations on bulk motion sensitivity. Magn Reson Med 2007;57:331–337 doi: 10.1002/mrm.21127.
2. Meyer C, Vuissoz P-A, Felblinger J, Bonnemains L. Towards a new method for cardiac tissue velocity measurements using MRI, comparison with echocardiography. J. Cardiovasc. Magn. Reson. 2014;16:P44 doi: 10.1186/1532-429X-16-S1-P44.
3. Odille F, Pasquier C, Abaecherli R, Vuissoz P-A, Zientara GP, Felblinger J. Noise Cancellation Signal Processing Method and Computer System for Improved Real-Time Electrocardiogram Artifact Correction during MRI Data Acquisition. IEEE Trans Biomed Eng. 2007;54:630–640.
4. van Gorkum RJH, von Deuster C, Stoeck CT, Kozerke S. Second-order motion-compensated in-vivo cardiac diffusion tensor imaging in diastole - impact of ventricular flow, strain and trigger delay. ISMRM 2018.
5. Aliotta E, Wu HH, Ennis DB. Convex optimized diffusion encoding (CODE) gradient waveforms for minimum echo time and bulk motion–compensated diffusion-weighted MRI. Magn. Reson. Med. 2017;77:717–729 doi: 10.1002/mrm.26166.
Figures