2031
A 3D high resolution MRI method for visualization of fibro-fatty infiltration in arrhythmogenic right ventricular cardiomyopathy (ARVC) in human heart.1IHU Liryc, Electrophysiology and Heart Modeling Institute, Foundation Bordeaux Université, Pessac-Bordeaux, France, 2Univ. Bordeaux, Centre de recherche Cardio-Thoracique de Bordeaux, U1045, Bordeaux, France, 3INSERM, Centre de recherche Cardio-Thoracique de Bordeaux, U1045, Bordeaux, France, 4Bordeaux University Hospital (CHU),Electrophysiology and Ablation Unit, Pessac, France
Synopsis
The goal of this study is to present 3D high resolution MR-acquisition methods for ex vivo imaging of the myocardial substrate to identify fibro-fatty infiltration. For this purpose IDEAL and Magnetization Transfer acquisitions were acquired in 3D to visualized and identify fibrosis, fat infiltration from arrhythmogenic right ventricular cardiomyopathy (ARVC) and healthy human hearts.
Introduction
Abnormal electrical activity of the heart can be highly correlated with modification of the myocardial architecture. Accumulation of intramuscular adipose tissue has been reported in Arrhythmogenic Right Ventricular Cardiomyopathy (ARVC) and is potentially one of the leading causes of sudden cardiac death1. The objective of this project is to develop a set of high-resolution 3D MRI acquisitions to characterize locations of potential fatty infiltrations and fibrosis on human ARVC heart fixed into formalin2,3 and compare results obtained on healthy heart. Hierarchical IDEAL4,5 imaging and magnetization transfer (MT)6 sequences were implemented at 9.4T to produce 3D images of the heart at an isotropic resolution of 200 µm.Methods
Sample preparation: The samples (N=2) were obtained through the CADENCE
(Pr. M. Haïssaguerre) research project approved by the French Biomedicine Agency. A
pathological and control human hearts (36 y.o. male and 53 y.o. female) were fixed
for at least 2h into formalin (10%) with Dotarem (0.2%) using retrograde
perfusion from the aorta and stored into a formalin tank. Prior to MRI
acquisition, the hearts were removed from formalin and immersed into Fomblin
oil to reduce susceptibility artifacts.
MRI Acquisition: Were performed at 9.4T/30cm
(Bruker BioSpin, Germany) with a 7 elements transmit/receive array coil (165 mm
inner diameter). An IDEAL sequence centered on the base of the
ventricles was acquired during 9hr30min with TR of 30 ms, an isotropic
resolution of 200 µm, TE values of 3.08/3.31/3.54 ms and a GRAPPA factor of 2
in the phase encoding direction for both hearts. Then, a Magnetization
Transfer (MT) 3D data set (MTon) was produced in 22hr45min using a
modified FLASH sequence with TR/TE 2000 ms/9 ms, an isotropic resolution of 400
µm and a MT preparation module consisting of 60 pulses (303 ms total duration)
with a B1 amplitude of 10 µT and a frequency offset of 3000 Hz. A reference 3D volume was acquired with identical parameters but
without the MT module (MToff).
Post Processing: The data were
post-processed in Matlab (MATLAB 8.6, The Mathworks, Inc).
Water-fat separation
was performed using the hierarchical IDEAL algorithm3 to create both
water (W) and fat (F) images, prior to computation of the Proton Density Fat Fraction
map (PDFF) using
equation (1) where Mf,w is the proton density of
water and fat. MT ratio map was
evaluated as in equation (2). $$(1) PDFF = (Mf ÷ (Mf+Mw)) × 100$$ $$(2) MTR = ((MToff - MTon) ÷ MToff) × 100$$
Results
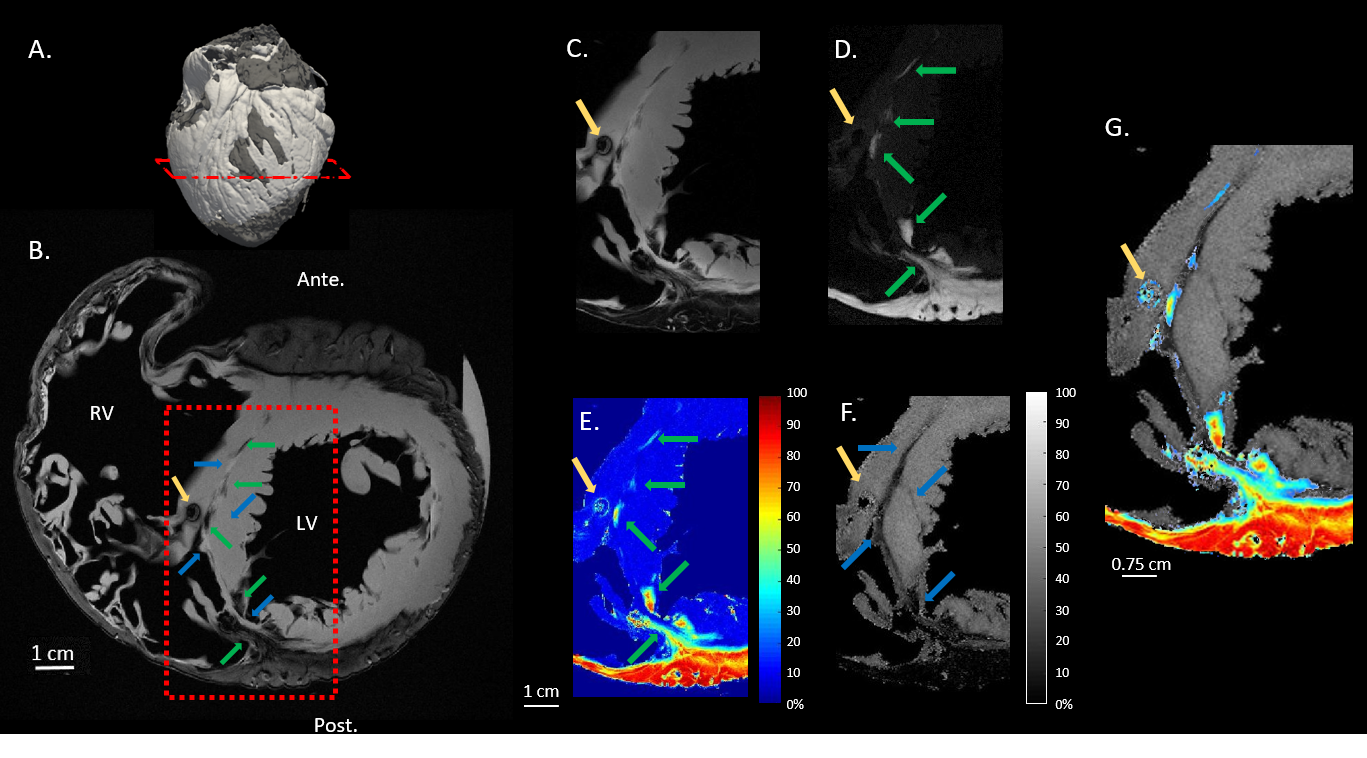
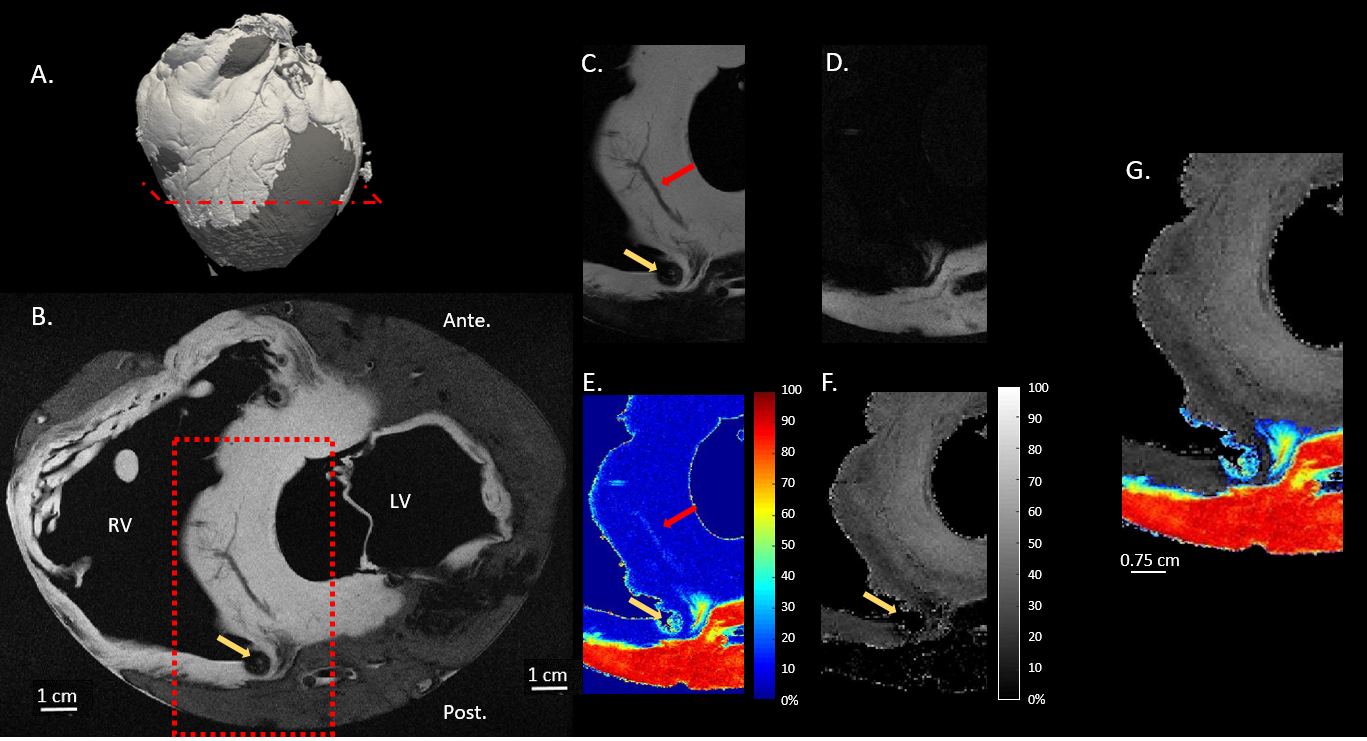
A short axis slice located on the ventricles of the ARVC (Fig.1B) and control (Fig.2B) hearts, corresponding to the shortest echo time is displayed. Fig.1,2A display the 3D rendering of the PDFF map showing the location of the slice of interest close to mid-ventricular region for both samples.Fat appears as a hypo intense signal surrounding the ventricles, with a clear delineation with the myocardium. A susceptibility artifact (yellow arrow) is visible on both images due to a remaining air bubble trapped into the RV. A blood vessel is also visible in the interventricular septum of the control heart (red arrow in Fig.2B,E).
Fat image (Fig.1,2D) and PDFF (Fig.1,2E) highlight the presence of adipose tissues around the myocardium with small infiltrates into the interventricular septum of the ARVC heart (green arrows in Fig.1D,E). Those adipose tissues are in a smaller quantity (40-80% of fat) than in the fat surrounding the ventricle (>70% and >90% for the pathological and control heart respectively).
The MTR image displays no tissue attenuation in the interventricular septum for the control heart in figure 2F. For ARVC, MTR displays an attenuation of 0-25% in the interventricular septum (blue arrows) of the ARVC heart. Such regions are adjacent to fatty infiltrates (Fig.1D,E) but differ in size, indicative of different tissue types as shown on Fig.1G and absent on Fig.2G.
Discussion
The hierarchical IDEAL water-fat separation provides a 3D high resolution image to differentiate myocardium from fat. It allows to highlight fat infiltrations that are characteristic of the ARVC pathology. Magnetization transfer image shows that different tissue types are also present at the vicinity of these fat infiltrates. Such contrasts were not observed on control heart. Since MT is known to reveal presence of fibrosis and connective tissue, such a result suggests that fatty infiltrates may be linked to fibrosis, as suggested by data reported by Hatem2.Conclusion
We present 3D high resolution (200 µm and 400 µm) images on pathological and control hearts to localize and differentiate fat from fibrosis. Next step will include histological assessment of these regions to confirm the presence of fat and fibrosis.Acknowledgements
All researchers involved in the CADENCE project are gratefully acknowledged for their valuable contributions.References
1. Samanta R, Pouliopoulos J, Thiagalingam A et al. Role of adipose tissue in the pathogenesis of cardiac arrhythmias. Heart Rhythm 2016;13:311-320.
2. Hatem SN, Redheuil A, Gandjbakhch E. Cardiac adipose tissue and atrial fibrillation: the perils of adiposity. Card. Res., 2016;109:502-509.
3. Liu CY, McKenzie CA, Yu H et al. Fat Quantification With IDEAL Gradient Echo Imaging: Correction of Bias From T1 and Noise. Mag. Res. Med. 2007;58:354-364.
4. Reeder SB, McKenzie CA, Pineda AR et al. Water-Fat separation with IDEAL gradient-echo imaging. J. Magn. Reson. Imaging 2007;25:644-652.
5. Tsao J, Jiang Y. Hierarchical IDEAL: fast, robust, and multiresolution separation of multiple chemical species from multiple echo times. Magn. Reson. Med. 2013;70(1):155-9.
6. Adler J, Swanson SD, Schmieldin-Ren P et al. Magnetization Transfer Helps Detect Intestinal Fibrosis in an Animal Model of Crohn Disease. Radiol. 2011;259:127-135.
Figures