2027
Intramyocardial and Pericardial Fat Quantification in Boys with Duchenne Muscular Dystrophy and Healthy Controls at 3T.1Radiology, University of California, Los Angeles, Los Angeles, CA, United States, 2Physics and Biology in Medicine IDP, University of California, Los Angeles, Los Angeles, CA, United States, 3Bioengineering, University of California, Los Angeles, Los Angeles, CA, United States, 4Radioloy, University of California, Los Angeles, Los Angeles, CA, United States, 5Pediatrics, University of California, Los Angeles, Los Angeles, CA, United States, 6Radiological Sciences Lab, Stanford, Stanford, CA, United States, 7Radiology, Stanford, Stanford, CA, United States
Synopsis
Emerging cardiac MRI biomarkers of Duchenne muscular dystrophy (DMD), a fatal X-linked genetic disorder, include intra-myocardial fibro-fatty infiltration, to identify the onset of microstructural remodeling in boys with DMD. The study aims were to: 1) characterize and compare intra-myocardial signal fat fraction (sFF) between boys with DMD and healthy controls; and 2) report and compare pericardial fat volume and sFF estimates in boys with DMD and healthy controls. We detected no intra-myocardial and pericardial sFF differences between DMD boys and healthy controls respectively. Boys with DMD presented with significantly more pericardial fat volume compared to healthy boys.
Introduction
Duchenne muscular dystrophy (DMD) is a fatal X-linked disorder affecting 15.9 to 19.5 per 100,000 live births1. DMD is associated with pediatric onset cardiomyopathy and fatal heart failure. Emerging cardiac MRI (cMRI) biomarkers, including myocardial fatty infiltration, may identify the on-set of microstructural remodeling in boys with DMD2. Chemical-shift based water-fat separation MRI techniques3 have been used to assess fat infiltration in skeletal muscle of DMD subjects4. Based on histology, some pathological changes in DMD are shared between skeletal and cardiac muscle , yet the onset of intra-myocardial fat and excessive pericardial fat remains understudied. The 3T MRI study herein aims to: 1) characterize and compare intra-myocardial signal fat fraction (sFF) between boys with DMD and healthy controls; and 2) report and compare pericardial fat volume and sFF estimates in boys with DMD and healthy controls.Methods
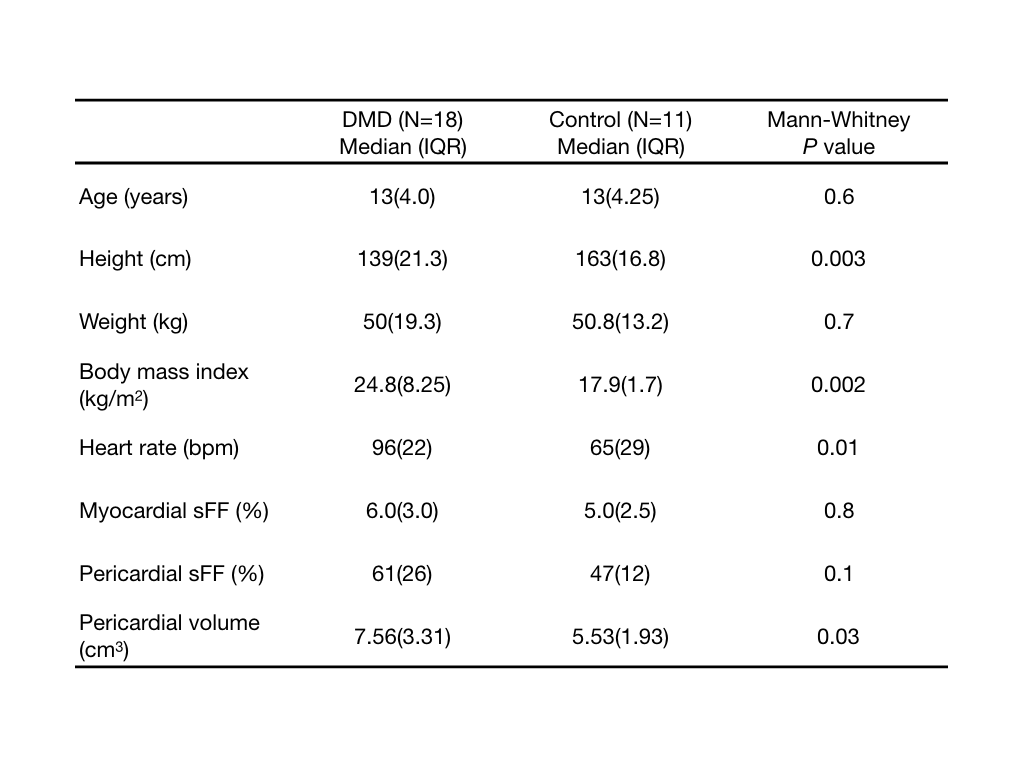
Boys with DMD (N=18, 13±2.9 years, BMI=24.7±5.2 kg/m2, HR=96±15.8 bpm) and healthy boys (N=11, 12.5±2.5 years, BMI=18.3±3.1 kg/m2, HR=72±15 bpm) were prospectively enrolled in an IRB-approved study for a cardiac cMRI exam at 3T (Siemens Skyra) after providing informed consent. The cMRI exam consisted of a multi-echo (Dixon-like) GRE sequence for fat-water separation imaging3. Images were acquired during free-breathing with ECG gating. Imaging parameters were: matrix size = 192x144mm2, pixel size=2x2x8mm3, flip angle=12°,TE/TR=1.64,4.17,6.7,9.23/11.2ms.
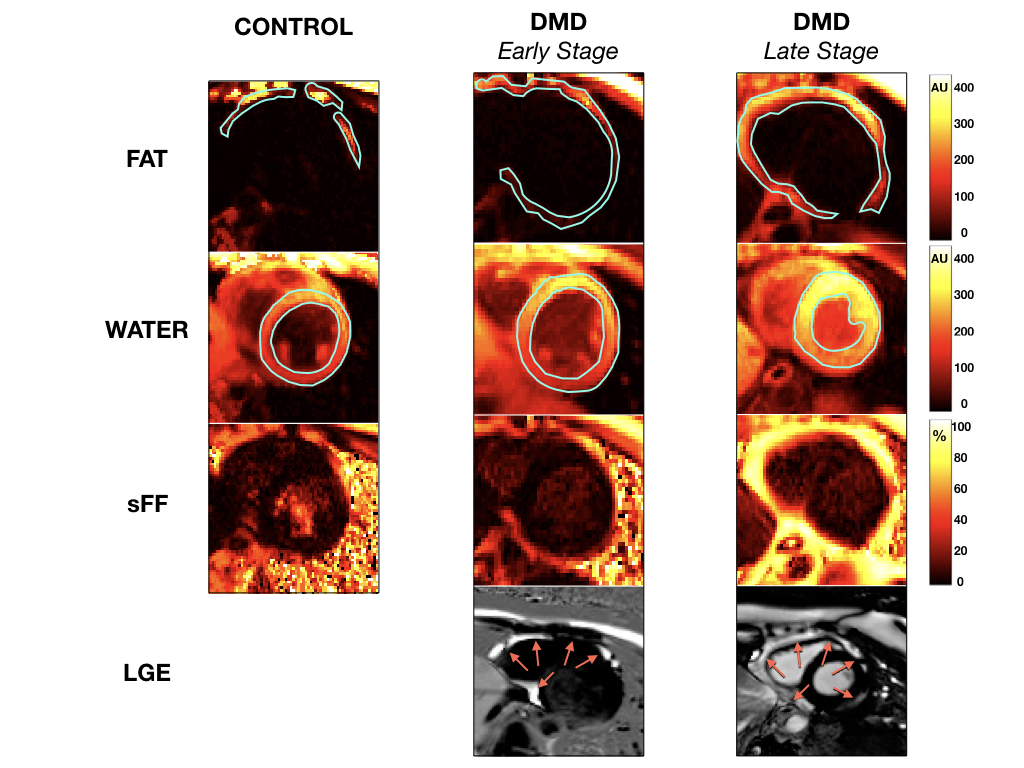
Water- and fat-separated images for a mid-ventricular short-axis slice were used to calculate maps of sFF = Fat/(Water+Fat) (MATLAB, MathWorks). To account for noise bias, sFF in regions of low fat content was generated by: sFF = 1 – sWF (sWF = Water/(Water+Fat). A region of interest (ROI) encompassing the left ventricular (LV) myocardium and ROIs containing pericardial fat were segmented, extracted, and analyzed for their corresponding sFF values (FIG.1). Summary statistics were extracted from all ROIs and pericardial fat volume was quantified from the corresponding regions for a single slice. Mann-Whitney U-tests were performed to compare boys with DMD and healthy controls. Spearman’s correlation test was performed to assess relationships between measured parameters (sFFs, pericardial fat volume) and demographic characteristics (age, height, weight, BMI, and HR) of DMD boys and healthy controls. Data is reported as median(IQR). P<0.05 was considered significant.
Results
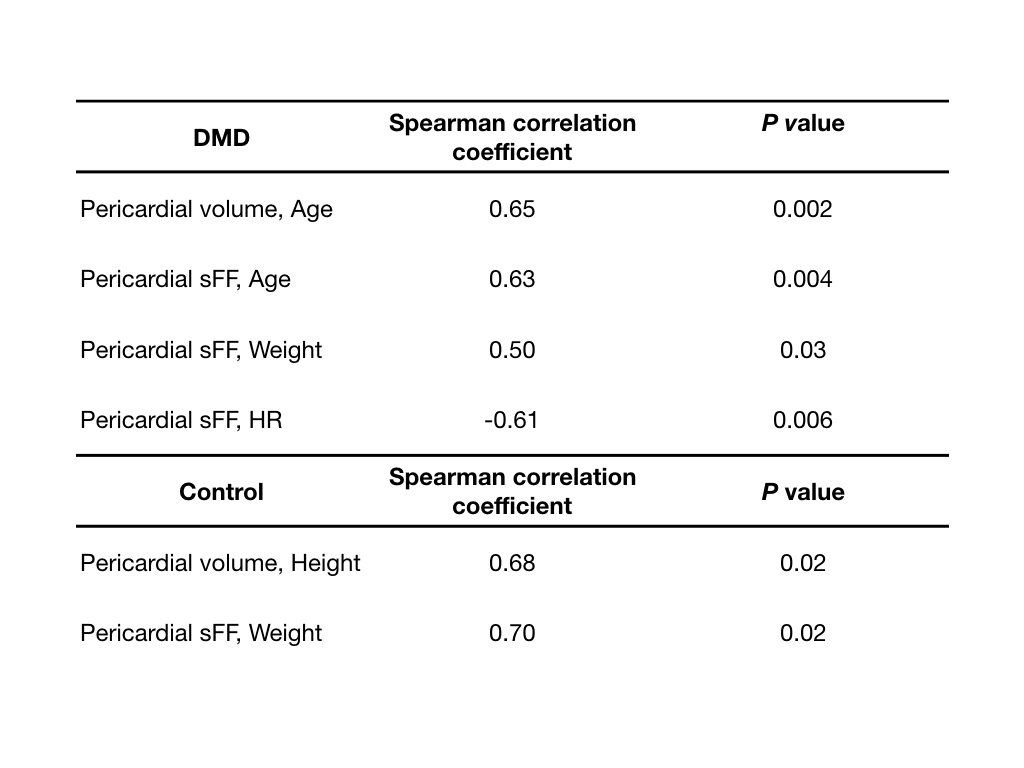
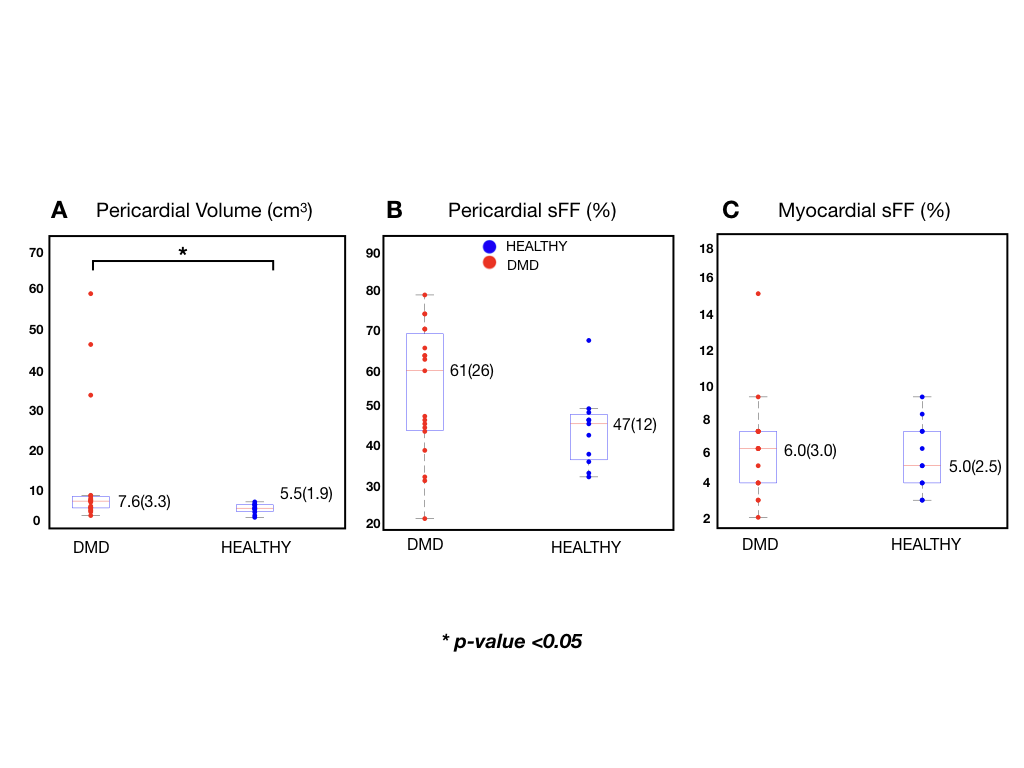
We detected no difference in intra-myocardial [6.0(3.0)% vs. 5.0(2.5)%, p=0.8] and pericardial [61(25.5)% vs. 47(12)%, p=0.1] sFF values between DMD boys and healthy controls respectively. Boys with DMD presented with significantly more pericardial fat volume [7.6(3.3)cm3 vs. 5.5(1.9)cm3, p=0.03] compared to healthy boys. This result is illustrated in FIG. 2A-C. Summary statistics of possible covariates (age, height, weight, BMI, and HR) and Spearman correlation tests are summarized in Tables 1 and 2 respectively.Discussion
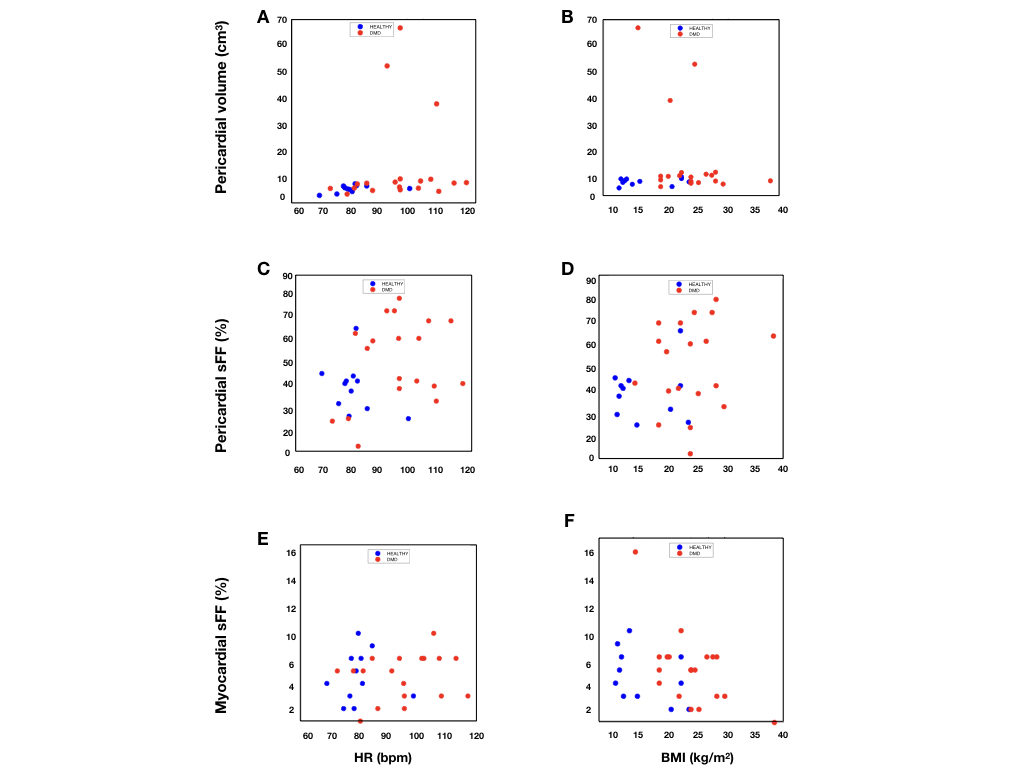
The null result reported here for intra-myocardial differences between DMD boys and healthy controls suggests that myocardial fatty infiltration is not readily apparent and is likely a late-stage outcome in DMD. A 13 year old early-stage and 17 year old late-stage DMD subject are shown in FIG.1 paired with late gadolinium enhancement (LGE) images where myocardial enhancement is only present in the late-stage subject. Furthermore, a previous study reported fatty infiltration and edema in the upper arm and skeletal muscles, but not the myocardium of DMD boys with normal ejection fraction (EF)4. In FIG. 3A-F we observe a distinct difference between DMD boys and healthy controls for pericardial fat volume, and pericardial and myocardial sFF as a function of HR and BMI. While pericardial sFF is not significantly different between the two, FIG. 3C-D demonstrates a trend towards elevated pericardial sFFs in DMD as a function of HR and BMI. We also find other covariates (age, weight, and HR) that significantly correlate to pericardial sFF . We detect a significant difference in pericardial fat volume between DMD boys and healthy controls. Furthermore, a significant correlation between pericardial fat volume and age is observed (Table 2). It is unclear if the elevated pericardial fat volume and correlation with age is part of the cardiac disease process or due to increased BMI alone, thus warranting further investigation. A previous multi-ethnic study of atherosclerosis (MESA) reported that pericardial fat volume is associated with a higher risk of cardiovascular disease6. The three most affected DMD subjects are consistent outliers in FIG. 2 and 3. To our knowledge this is the first report of intra-myocardial and pericardial sFF and pericardial fat volume estimates in DMD subjects and healthy volunteers at 3T, hence, the reported values help to establish reference values.Conclusion
Herein, we detected no differences in intra-myocardial and pericardial sFF between boys with DMD and age-matched controls. We find that DMD boys exhibit more pericardial fat compared to healthy controls. Additional work is needed to understand, for example, the correspondence of changes in sFF with age, BMI, and DMD severity.Acknowledgements
Funding NIH R01 HL131975 to DBE.
Funding NSF DGE 1650604 to NGM.
References
[1] Ryder S et al., OJRD 2017
[2] Mavrogeni S et al., BMC Neurology 2010
[3] Kellman P et al., MRM 2009
[4] Gaur L et al., ACN 2016
[5] Moriuchi T et al., J Exp Med. 1993
[6] Ong KL et al., Atherosclerosis 2015
Figures