2024
Association of Myocardial Tissue Characterization between Cardiovascular MR and 11C-acetate PET imaging1Center for Biomedical Imaging Research, Department of Biomedical Engineering, Tsinghua University School of Medicine, Beijing, China, 2Department of Nuclear Medicine, Peking Union Medical College Hospital, Beijing, China, 3Department of Cardiology, Peking Union Medical College Hospital, Beijing, China, 4Department of Biomedical Engineering, Beijing Institute of Technology School of Life Science, Beijing, China, 5Department of Medical Engineering, First Affiliated Hospital of PLA General Hospital, Beijing, China
Synopsis
The metabolic alteration in myocardium always accompanied with the structural remodeling. Therefore, it is possible to bridge the imaging markers in CMR with those in 11C-acetate PET imaging. This study investigated the correlation of measurements of interventricular septum between CMR and 11C-acetate in healthy male adults. We found that there was a significant association between ECV measured by quantitative CMR and K1 measured by PET imaging. Our results may indicate a dynamic balance between myocardial blood flow and ECV physiologically. The clinical significance of this relationship needs to be further investigated in patients with cardiac diseases.
Introduction and Purpose
Quantitative cardiovascular MR (CMR) imaging, such as T1 mapping, can measure the native value (absence of contrast agent) of longitudinal (spin-lattice) relaxation time (T1) of myocardial tissues which varies with myocardial extracellular water (edema), focal and diffuse fibrosis, fat, iron and amyloid protein, and the extracellular volume (ECV) which represents the size of the extracellular space and reflects the interstitial diseases.1 11C-acetate PET imaging is capable of measuring the clearance constant – Kmono, which is considered as a robust marker for evaluating myocardial oxygen consumption (MVO2), and K1, which is correlated with myocardial blood flow (MBF).2-4 The metabolic alteration in myocardium always accompanied with the structural remodeling. As such, it is possible to bridge the imaging markers in CMR with those in 11C-acetate PET imaging. This study sought to investigate the association of myocardial tissue characterization between CMR and 11C-acetate PET in healthy male adults.Methods
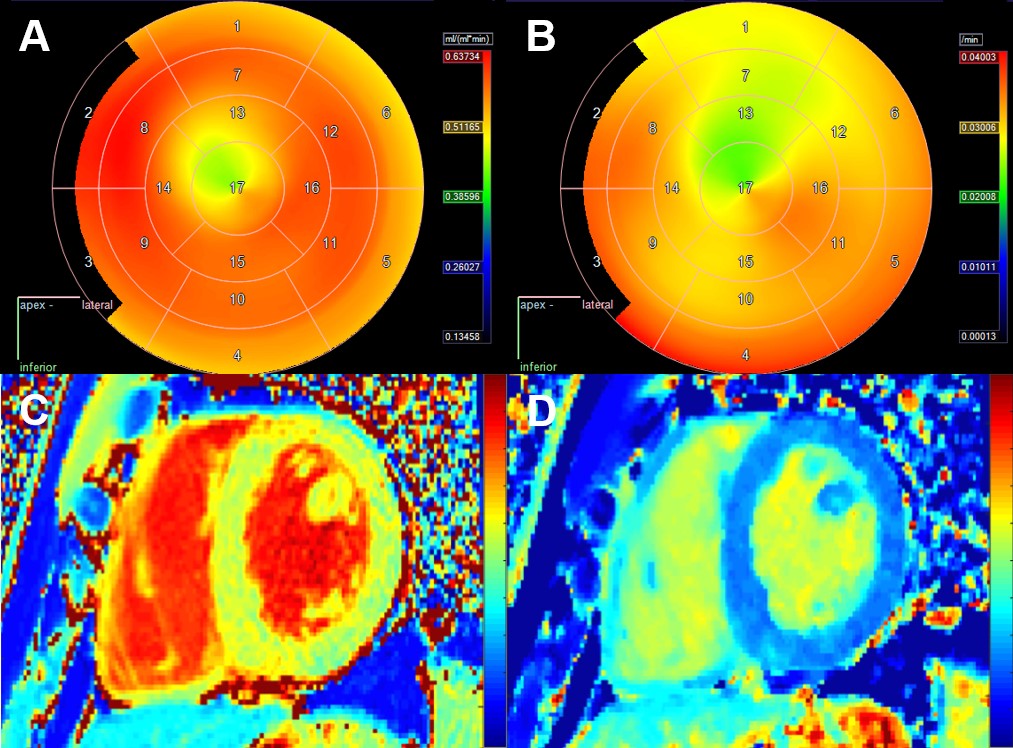
Study sample: Eleven health male subjects (mean age, 51.5±10.8 years) with normal BMI (19.0kg/m2-26.0kg/m2) underwent CMR and 11C-acetate PET imaging for cardiac. The study protocol was approved by institutional review board and written consent form was obtained from each subject. MR imaging: The CMR imaging was performed on a 3.0T MR scanner (Achieva TX, Philips Healthcare) with 32-channel cardiac coil. Pre- and post-contrast T1 mapping was acquired with breath-hold and the following parameters: 3-3-5 MOLLI, repetition time/echo time 2.3ms/0.9ms, field of view 320×320 mm2, flip angle 35°, slice thickness 8 mm. Gadolinium-based contrast agent (Magnevist, Bayer Schering Pharma, Germany) was administrated intravenously with dose of 0.15 mmol/kg and flow rate of 2 ml/s. PET imaging: PET imaging was performed on a hybrid PET/CT scanner (PoleStar m660, Sinounion, Healthcare Inc., Beijing). 11C-acetate with a total dose of 740 MBq was injected intravenously and all subjects underwent a 40-min dynamic PET scan. A total of 53 frames (15×10 sec, 15×30 sec, 16×60 sec, and 7×120 sec) were reconstructed using 3D OSEM+TOF algorithm on Precision workstation with an object space of 192 × 192 × 117 and a voxel size of 3.15 × 3.15 × 1.87 mm3 after correction for dead time, decay and measured photon attenuation. Data Analysis: Native T1 and ECV were measured at the middle interventricular septum by drawing region of interest (ROI) on three slices. Kmono and K1 were calculated using Carimas software. Only the measurements of septal segments (Segs 8 and 9) were included in the statistical analysis. Statistical analysis: The Pearson correlations of quantitative measurements between CMR and PET were analyzed. A p value <0.05 was considered as statistically significant.Results
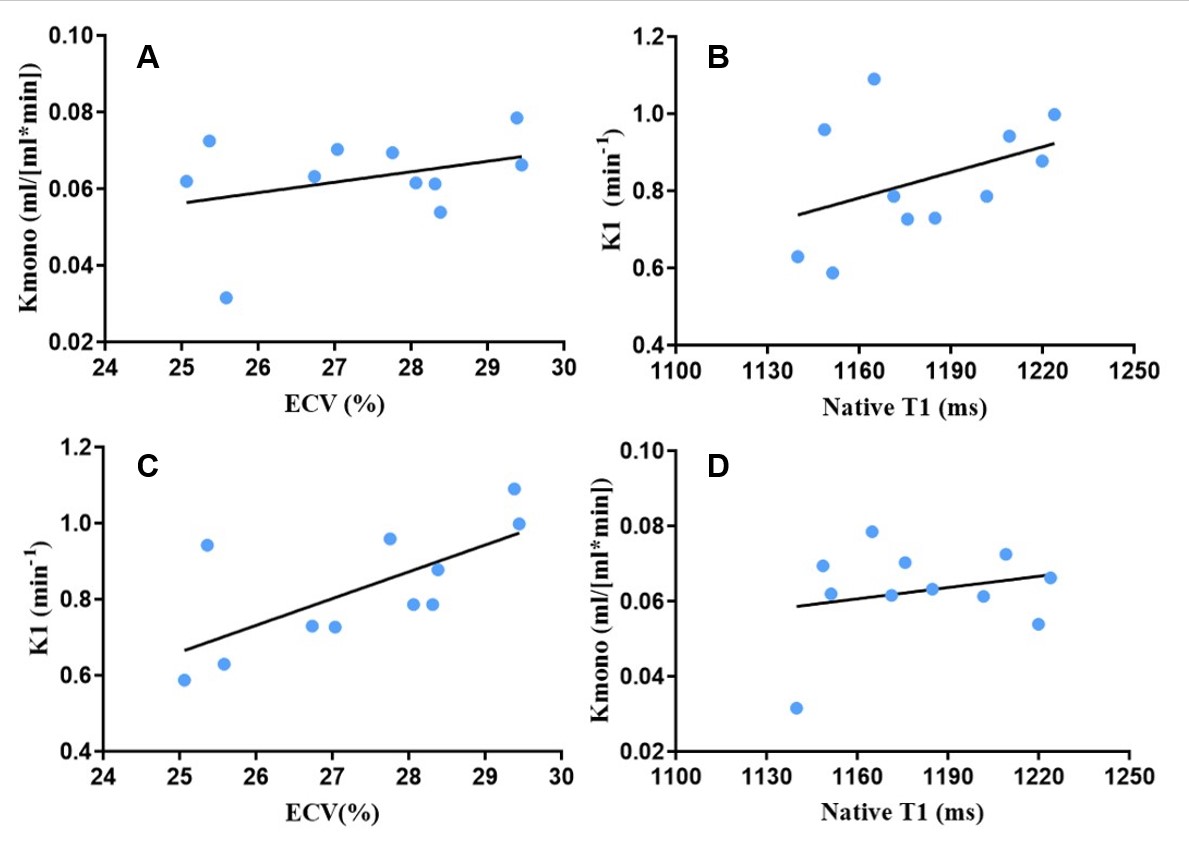
On MR imaging, the mean value of native T1, post-T1, and ECV of interventricular septum was 1180.5±28.9 ms, 504.9±26.4 ms and 27.6±1.4 %, respectively. On PET imaging, the mean value of K1 and Kmono of interventricular septum was 0.82±0.15 min-1 and 0.062±0.012 min-1, respectively. Strong correlations were found between K1 and ECV (r = 0.902, p < 0.001). No significant correlations were found between K1 and native T1 values, or between Kmono and MR measurements (all p >0.05, Figure 1).Discussion
In the present study, a strong linear correlation was found in interventricular septum between ECV measured by CMR and K1 measured by PET Imaging in healthy male adults. K1 represents the proportion of perfusion value from tissues in extracellular matrix to the myocardium while ECV represents extracellular space. Our results may indicate a dynamic balance between myocardial blood flow and ECV physiologically. The clinical significance of this relationship needs to be further investigated in patients with cardiac diseases.Conclusion
The ECV measured by CMR is significantly associated with K1 measured by PET imaging.Acknowledgements
NoneReferences
1. Moon JC, Messroghli DR, Kellman P, et al. Myocardial T1 mapping and extracellular volume quantification: a Society for Cardiovascular Magnetic Resonance (SCMR) and CMR Working Group of the European Society of Cardiology consensus statement. J Cardiovasc Magn Reson. 2013;15:92.
2. Braunschweig F, Sörensen J, von Bibra H, et al. Effects of biventricular pacing on myocardial blood flow and oxygen consumption using carbon-11 acetate positron emission tomography in patients with heart failure. Am J Cardiol. 2003;92:95-99.
3. Kitaizumi K, Yukiiri K, Masugata H, et al. Acute improvement of cardiac efficiency measured by 11C-acetate PET after cardiac resynchronization therapy and clinical outcome. Int J Cardiovasc Imaging. 2010;26:285-292.
4. Sun KT, Yeatman LA, Buxton DB, et al. Simultaneous measurement of myocardial oxygen consumption and blood flow using carbon-11 acetate. J Nucl Med. 1998;39:272-280.
Figures