2023
Combined SAturation recovery and Variable flip Angle (SAVA) for free-breathing high-resolution three-dimensional cardiovascular magnetic resonance T1 mapping at 3T1Center for Biomedical Imaging Research, Department of Biomedical Engineering, Tsinghua University, Beijing, China, 2Vascular Imaging Laboratory, Department of Radiology, Vascular Imaging Laboratory, Seattle, WA, United States, 3National Heart, Lung, and Blood Institute, National Institutes of Health, Bethesda, MD, United States, 4Department of Biomedical Engineering, Johns Hopkins School of Medicine, Baltimore, MD, United States
Synopsis
Cardiac Magnetic Resonance T1 mapping enables quantitative characterization of myocardium, which appeals huge attention from clinic. In this work, we proposed a free-breathing high-resolution three-dimensional (3D) T1 mapping sequence. By using variable flip Angle technique for readouts and saturation-recovery preparation for T1 weightings, the proposed sequence is highly efficient in acquisition of all volumes, including the one at the equilibrium of the longitudinal magnetization. Whole-heart pre- and post-contrast homogeneous T1 maps at an imaging resolution 1.25×1.25×8 mm3 were successfully obtained within 10 minutes in healthy volunteers. After rigid registration, 3D Extracellular Volume maps were eventually achieved.
INTRODUCTION
In Cardiac Magnetic Resonance, T1 and Extracellular Volume (ECV), from where T1 mapping is performed with and without contrast agent, are two quantitative biomarkers for detecting the focal or diffuse myocardial disease[1]. Recently, a free-breathing three-dimensional (3D) cardiac T1 mapping sequence was proposed to improve the coverage which is limited in two-dimensional fashion within a single breath hold[2]. However, the acquisition of one volume of which the signal represents the equilibrium of the longitudinal magnetization (Mz) consumes the most scan time due to the request on very long recovery time (>6s at 3T).
The aim of this study is to develop a highly efficient 3D free-breathing cardiac T1 mapping sequence by optimizing the acquisition of equilibrium image, which will eventually make that high-resolution whole heart 3D T1 and ECV mapping are feasible.
METHODS
Sequence Design
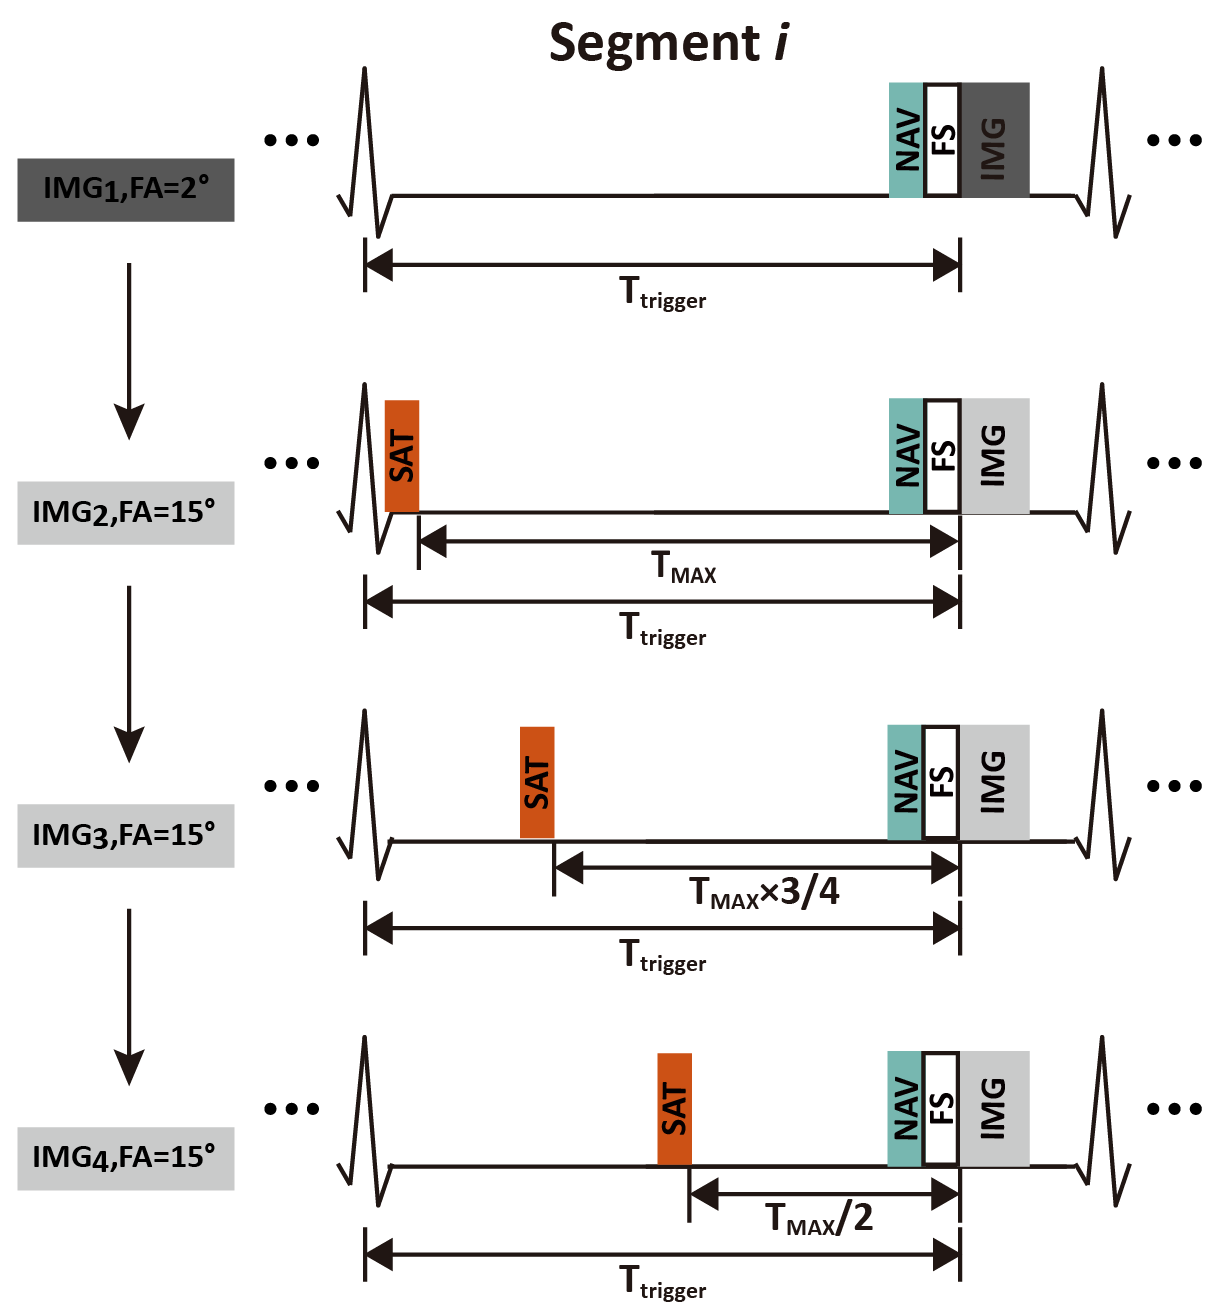
The proposed sequence sequentially acquires 4 differently T1-weighted images to generate the pixel-wised T1 maps. ECG triggered images are acquired using multi-shot 3D SPoiled Gradient Echo sequence at diastole. The readout of the equilibrium image (IMG1) is performed using a FA 2°. The other three images (IMG2-IMG4) are prepared with saturation pulse with different saturation-recovery time (TSAT) and acquired using a FA 15°. Before the data acquisition, respiratory navigator and fat-suppression module are performed to compensate the respiratory motion and suppress fat signal. For IMG1, the readout is performed only if the respiratory navigator is within the acceptance window. Additionally, one heartbeat will be skipped after the readout of IMG1 to ensure that time of the Mz recovery is no less than minimal targeted time (e.g. 580 ms at 3T ) at a heart rate (HR) >85 bpm.
Simulations
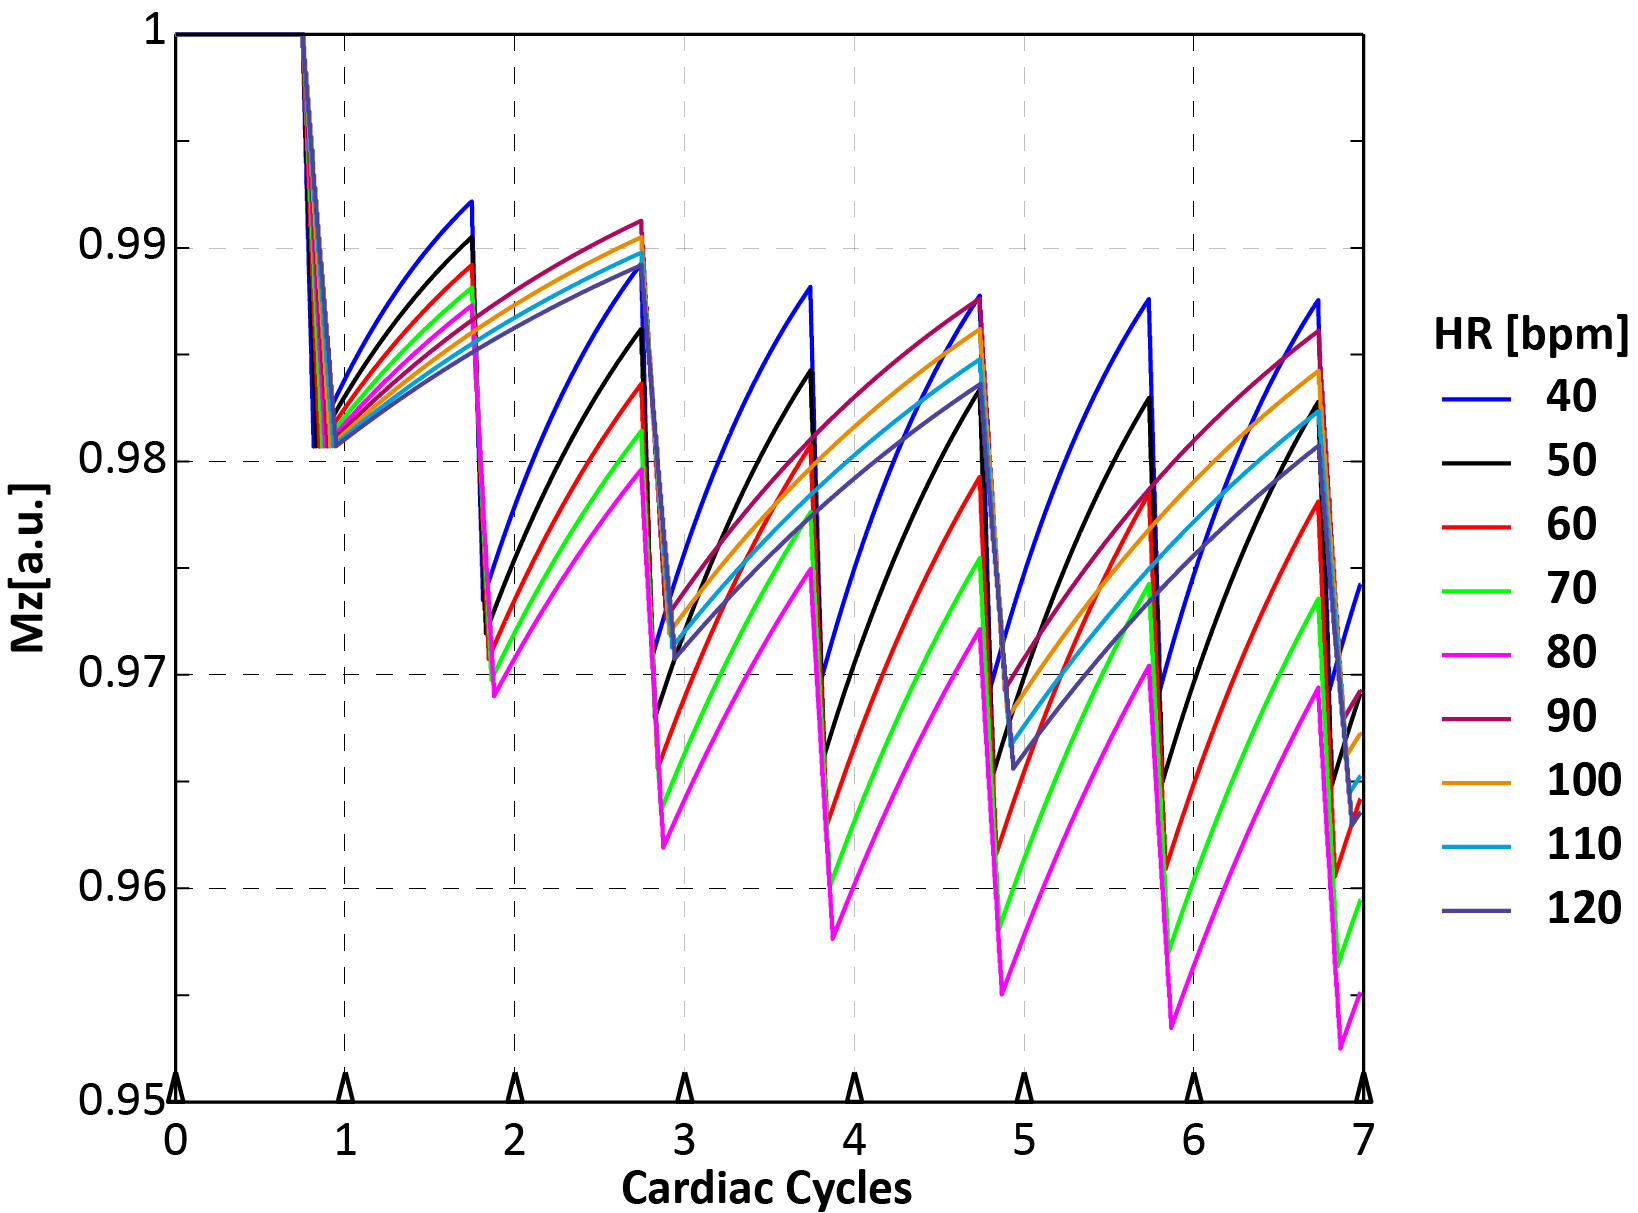
Mz during the segmented readout of IMG1 under different HR was studied by using numerical simulation with parameters: FA 2°, TR 3.3 ms, 33 readouts per segment. The simulated T1 of myocardium was 1550 ms[3]. HR was ranging from 40 to 120 bpm in a step of 10 bpm. The initial Mz was 1.
In vivo experiments
Approved by the local institutional review board, the proposed sequence was performed at 3T (Philips Achieva TX) with three healthy volunteers (2 males, 32±11 years). Written informed consents were all received. Imaging parameters were: FOV 290×290×96 mm3, TR/TE 3.3/1.0 ms, voxel size 1.25×1.25×8 mm3, which was reconstructed to 1.25×1.25×4 mm3, 33 k-lines per segment, FA 2° for IMG1 and FA 15° for the other three images, acceptance window of respiratory navigator 5 mm. Post-contrast T1 was performed 10 minutes after injection of Gd-DTPA at 0.2 mmol/kg.
Post processing
T1 is calculated using a two-parameter model as following:
$$Si=A(1-e^{-T_{SATi}/T_1})sin(FAi)$$
where A and T1 are two unknowns. Si, TSATi and FAi are the signal intensity, saturation-recovery time and FA of the ith image, respectively.
Rigid registration was performed to correct the mismatch of the left-ventricle (LV) myocardium between the pre- and post-contrast T1 maps before the calculating of ECV maps[4].
RESULTS AND DISCUSSION
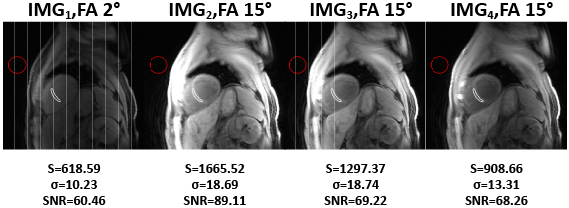
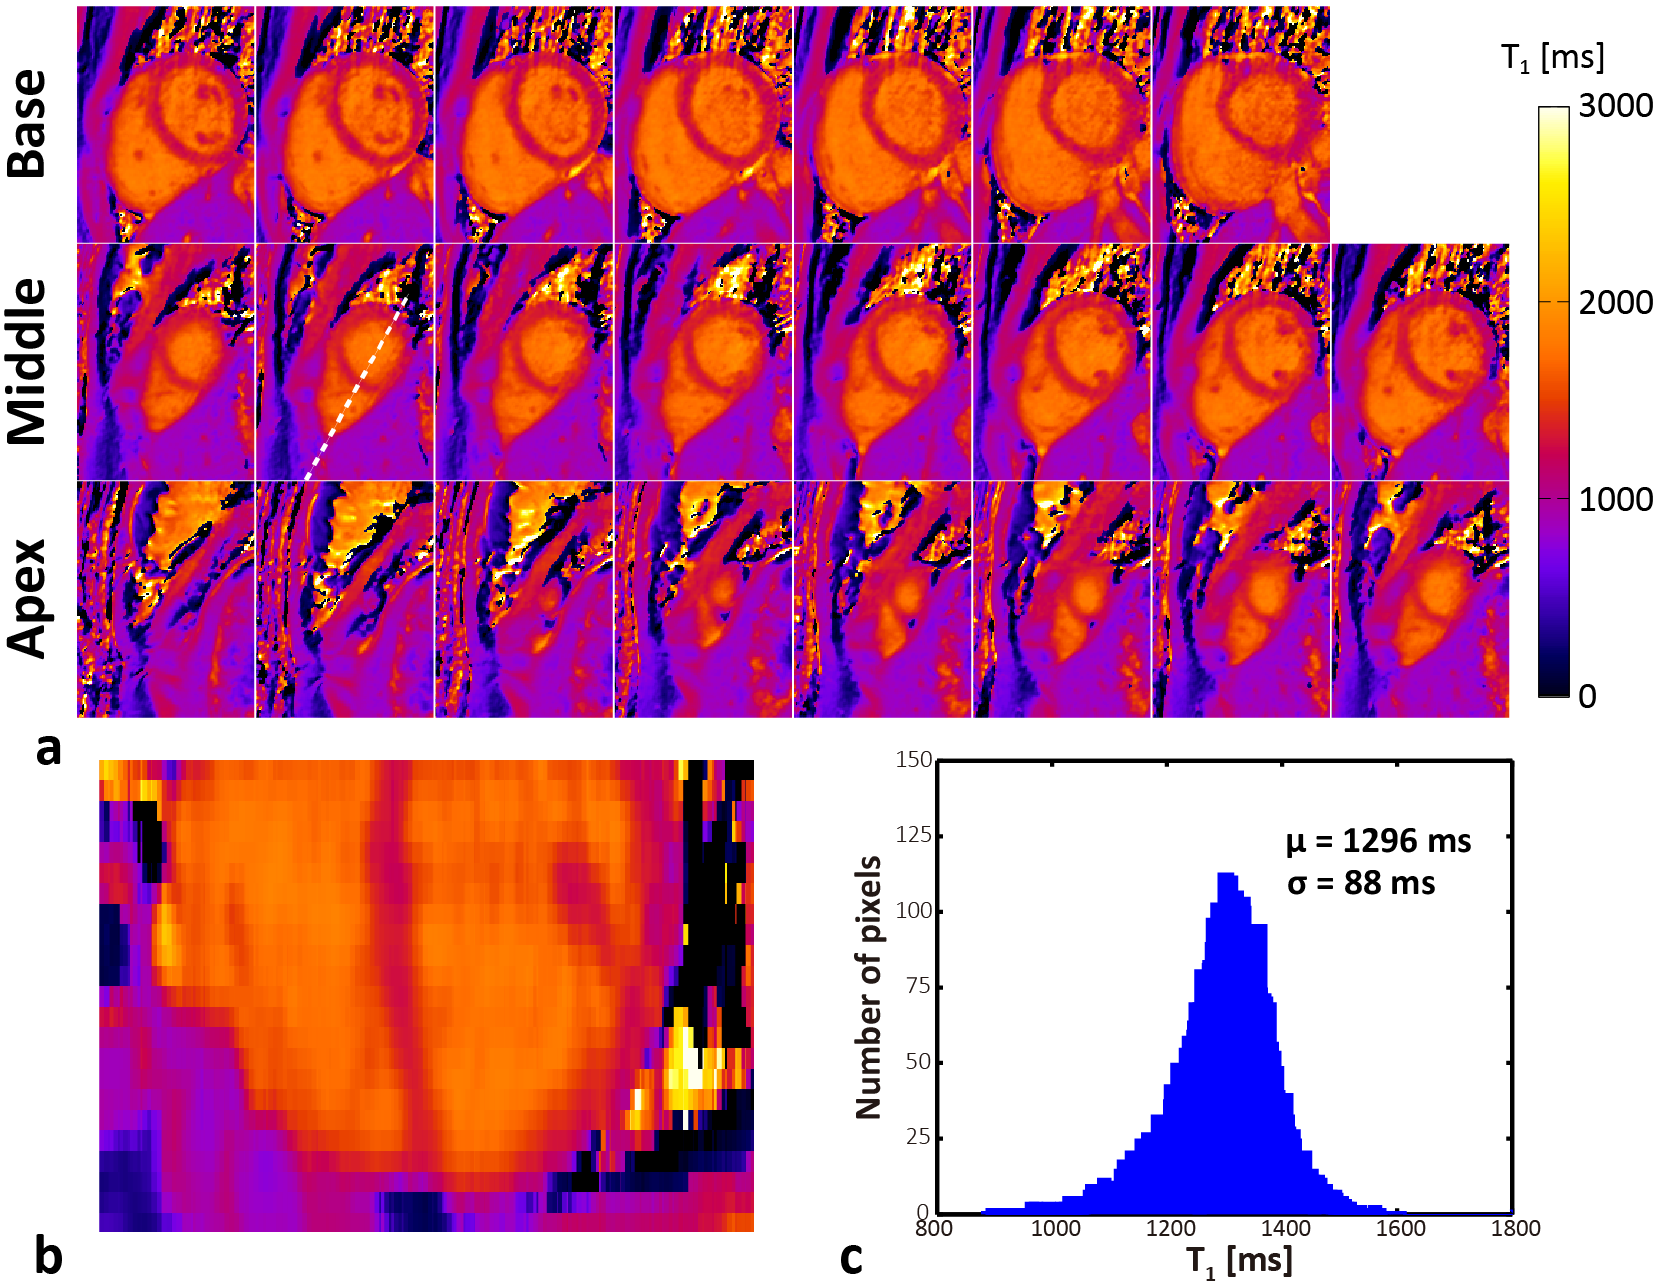
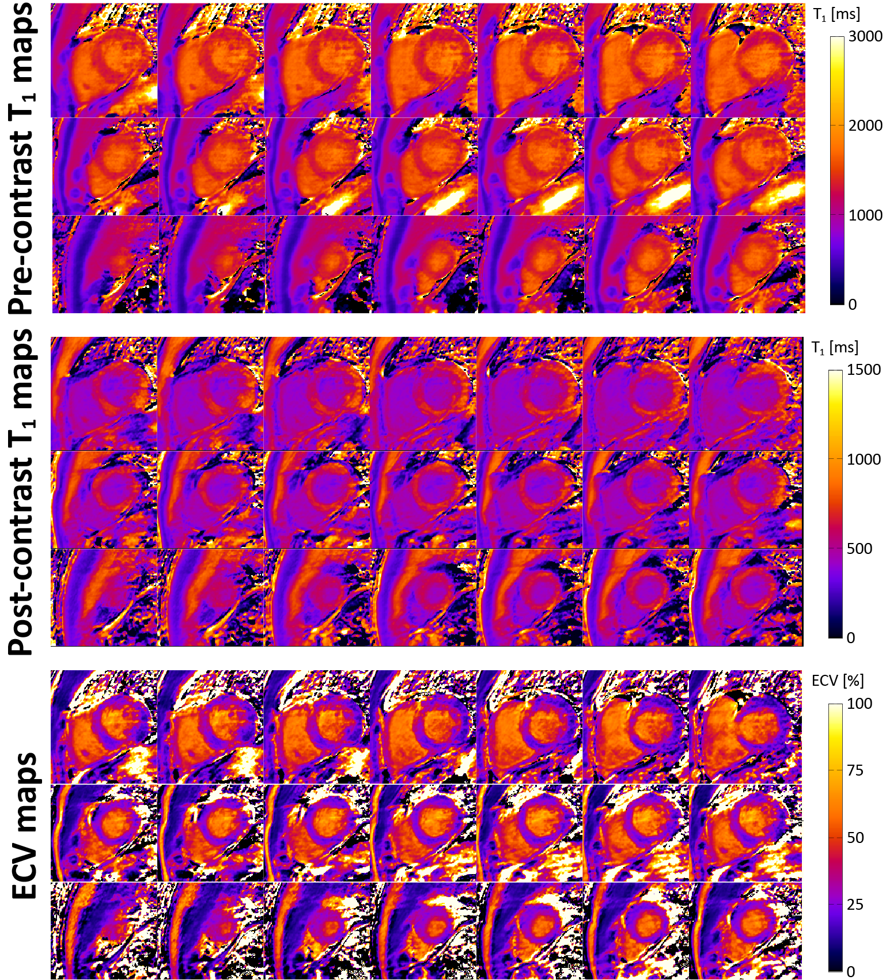
Shown in Figure 2, Mz (> 95%) was kept with the low flip angle for the equilibrium image acquired on each (HR <85 bpm) or every other (HR >85 bpm) cardiac cycle. Scan efficiency was apparently improved. In vivo study, the averaged scan time was 10 minutes. The SNR of IMG1 was comparable with others (Figure 3). Representative whole-heart pre-contrast T1 maps was shown in Figure 4. High in-plane resolution even allowed to assess the finer right ventricle structures. Figure 5 was another case with the whole 3D datasets of pre- and post-contrast T1, and ECV maps. Homogeneous myocardium was observed from all the subjects. The pre- and post-contrast septal T1 values were 1324.7±16.4 ms and 651.8±9.5 ms, respectively. The measured pre-contrast myocardium T1 was lower than those reported in previous studies[2,3]. Septal ECV was 25.37±0.69% which was consentient with previous study[3]. The underestimation of T1 perhaps comes from incomplete recovery of Mz or imperfect RF (i.e. FA, saturation pulse, SPIR), though further investigation is needed.CONCLUSION
The proposed sequence presented highly scan efficient, which made the feasibility of whole-heart pre-contrast T1 or ECV maps with high resolution (1.25×1.25×8 mm3) within reasonable scan time (10 minutes).Acknowledgements
This work was funded by National Key R&D Program of China 2016YFC0104700.References
[1] Messroghli DR, Moon JC, Ferreira VM, et al. Clinical recommendations for cardiovascular magnetic resonance mapping of T1, T2, T2* and extracellular volume: A consensus statement by the Society for Cardiovascular Magnetic Resonance (SCMR) endorsed by the European Association for Cardiovascular Imaging (EACVI). J Cardiovasc Magn Reson 2017;19(75).
[2] Guo R, Chen Z, Wang Y, et al. Three-dimensional free breathing whole heart cardiovascular magnetic resonance T1 mapping at 3 T. J Cardiovasc Magn Reson 2018;20(1):64.
[3] Weingartner S, Messner NM, Budjan J, et al. Myocardial T1-mapping at 3T using saturation-recovery: reference values, precision and comparison with MOLLI. J Cardiovasc Magn Reson 2016;18(1):84.
[4]Haaf P, Garg P, Messroghli DR, et al. Cardiac T1 Mapping and Extracellular Volume (ECV) in clinical practice: a comprehensive review. J Cardiovasc Magn Reson 2016;18(1):89.
Figures