2022
Quantitative Multiparametric Myocardial Evaluation in Hypertrophic Cardiomyopathy using Cardiac Magnetic Resonance Fingerprinting: Comparison to Conventional Cardiac Relaxometry.Bernd J. Wintersperger1, Jesse Hamilton2, Christian Houbois1, Yuchi Liu2, Kate Hanneman1, Nicole Seiberlich2, and Marshall Sussman1
1Department of Medical Imaging, University of Toronto, Toronto, ON, Canada, 2Department of Biomedical Engineering, Case Western Reserve University, Cleveland, OH, United States
Synopsis
Multiparametric quantitative myocardial tissue characterization has demonstrated promising results in the differential diagnosis of non-ischemic cardiomyopathies. While conventional cardiac relaxometry techniques employ various different sequence approaches with subsequent fitting data fitting, library based cardiac magnetic resonance fingerprinting (cMRF) enables single breath-hold multi-contrast acquisitions. This investigation into the comparison of cMRF with standard modified Look-Locker inversion recovery (MOLLI) T1 mapping and its derived parameters and T2-prep FLASH T2 mapping demonstrated promising results in the assessment of patients with hypertrophic cardiomyopathies.
Introduction
In recent years quantitative myocardial tissue characterization has focused on assessment of non-ischemic cardiomyopathies and diffuse myocardial changes - areas where conventional techniques may fail 1,2,3. Drawbacks of conventional cardiac relaxometry include: separate data acquisitions required or quantitative T1/T2 mapping, acquired series of images requiring sophisticated motion-correction algorithms and results may be biased by fitting errors or inherent T1-T2 dependencies (e.g. T2 bias). Cardiac magnetic resonance fingerprinting (cMRF) has been proposed to acquire multiple tissue properties in a time-efficient single acquisition 4. There is limited experience in comparison of multiple tissue parameters derived by cMRF with commonly used cardiac relaxometry approaches. Therefore, the objective of this it to compare cMRF derived quantitative myocardial T1 and T2 data with conventional cardiac relaxometry in a cohort of hypertrophic cardiomyopathy (HCM) patients.Methods
23 patients referred for cardiovascular MR with known/suspected HCM were prospectively enrolled. All examinations were performed at 3T (MAGNETOM Skyra , Siemens Healthineers). For myocardial T1 tissue evaluation a pre-(5(3)3) and post-contrast (4(1)3(1)2) modified Look-Locker inversion recovery (MOLLI) technique was applied in a mid-ventricular short axis orientation; a T2-prep fast low-angle shot (FLASH) technique was employed for myocardial T2 tissue evaluation in a matching slice location. ECG triggered magnetic resonance fingerprinting (cMRF) with fixed square FoV (300 or 400mm) with an acquisition time of 15HB was performed pre- and post-contrast injection in the matching MOLLI/T2-prep slice location. All quantitative post-contrast imaging was performed >10min after injection of 0.15mmol/kg Gadobutrol (Gadovist, Bayer). Inline motion correction and fitting was performed on the scanner for MOLLI T1 and T2-prep FLASH T2 maps. All acquired cMRF raw data was exported and respective T1, T2 and M0 maps reconstructed off-line (MatLab, The Math Works).All quantitative T1 and T2 maps were visually assessed for general image quality/artifacts using a 5-point Likert scale (1=non-diagnostic to 5=excellent). Quantitative assessment of all maps was performed using a commercially available algorithm (cvi42, Circle CVI) by carefully drawing endo- and epicardial contours as well as a blood-pool region-of-interest (ROI). To further avoid contamination a 15% inner/outer offset was applied for all myocardial ROI’s. Calculation of the extracellular volume (ECV) fraction was performed using standard algorithms with the use of the patient’s hematocrit acquired using a non-invasive finger probe prior to MRI. Statistical comparison included a Wilcoxon rank-sum test and Spearman’s correlation. Data are presented as median and interquartile range (IQR).Results
Image quality assessment demonstrated superior map quality of pre-contrast T1 MOLLI over pre-contrast cMRF T1 (4 [4, 5] vs. 4 [3, 4]; P=0.004) and T2-prep FLASH over cMRF T2 (4 [4, 4] vs. 3 [3, 4]; P=0.008). No significant differences were found for MOLLI and cMRF post-contrast T1 maps (4 [4, 4] vs. 4 [3, 4]; P=0.193). There were significant differences between T1 MOLLI and cMRF T1 for both pre- contrast (1252ms [1237ms, 1286ms] vs. 1397ms [1358ms, 1437ms]; P<0.0001), and post-contrast (488ms [449ms, 521ms] vs. 520ms [458ms, 549ms]; P=0.173) maps. Pre-contrast (r=0.6039; P=0.0029) and post-contrast (r=0.8831; P<0.0001) cMRF T1 values correlated significantly with respective MOLLI data (Figure 1). T1 derived ECV demonstrated significant differences between cMRF and MOLLI acquisitions (27.6% [23.6%, 28.9%] vs. 23.4% [21.9%, 25.8%]; P=0.003) with moderate to high correlation between techniques (r=0.7721; P=0.0005) (Figure 2). cMRF T2 map data were significantly lower than T2-prep FLASH results (29.0ms [26.3ms, 31.6ms] vs. 39.7ms [37.5ms, 40.8ms]; P=0.0001) also moderate correlation between techniques (r=0.4953; P=0.07). Overall, cMRF derived T1/ECV data demonstrated a wider range of values compared to MOLLI based T1/ECV data while for quantitative T2 data the ranges between both approaches were similar.Discussion
The results of this study demonstrate that cMRF allows for single-slice multiparametric quantitative data (T1, T2, M0) within a single heartbeat (Figures 3,4). cMRF data generally correlates well with conventional cardiac relaxometry, however demonstrate significant differences in absolute values. With respect to pre-contrast T1 values this most likely relates to the known limited accuracy of MOLLI. A potentially current limitation of cMRF includes the slightly inferior image quality which may impede the accurate delineation of myocardial borders and as such affect potential contamination of data. The overall wider range of T1 derived data for cMRF may be beneficial for differentiation of various pathologies, however, this also requires adequate data precision and reproducibility.Conclusion
Cardiac MRF generally allows a more simplified approach to cardiac relaxometry and avoids the need for multiple separate single-contrast acquisitions. Its diagnostic capability in the differentiation and assessment of different myocardial pathologies would require further evaluation and the generation of normal healthy volunteer data for assessment of discriminatory power and establishment of normal reference ranges.Acknowledgements
No acknowledgement found.References
- Hamlin SA, Henry TS, Little BP et al. Mapping the Future of Cardiac MR Imaging: Case-based Review of T1 and T2 Mapping Techniques. RadioGraphics. 2014; 34: 1594–1611.
- SpiekerM, Haberkorn S, Gastl M et al. Abnormal T2 mapping cardiovascular magnetic resonance correlates with adverse clinical outcome in patients with suspected acute myocarditis. J Cardiovasc Magn Reson. 2017; 19: 38.
- Haaf P, Garg P, Messroghli D et al. Cardiac T1 Mapping and Extracellular Volume (ECV) in clinical practice: a comprehensive review. J Cardiovasc Magn Reson. 2016; 18: 89
- Hamilton JI, Jiang Y, Chen Yet al. MR fingerprinting for rapid quantification of myocardial T1 , T2 , and proton spin density. Magn Reson Med. 2017 Apr; 77: 1446-1458
Figures
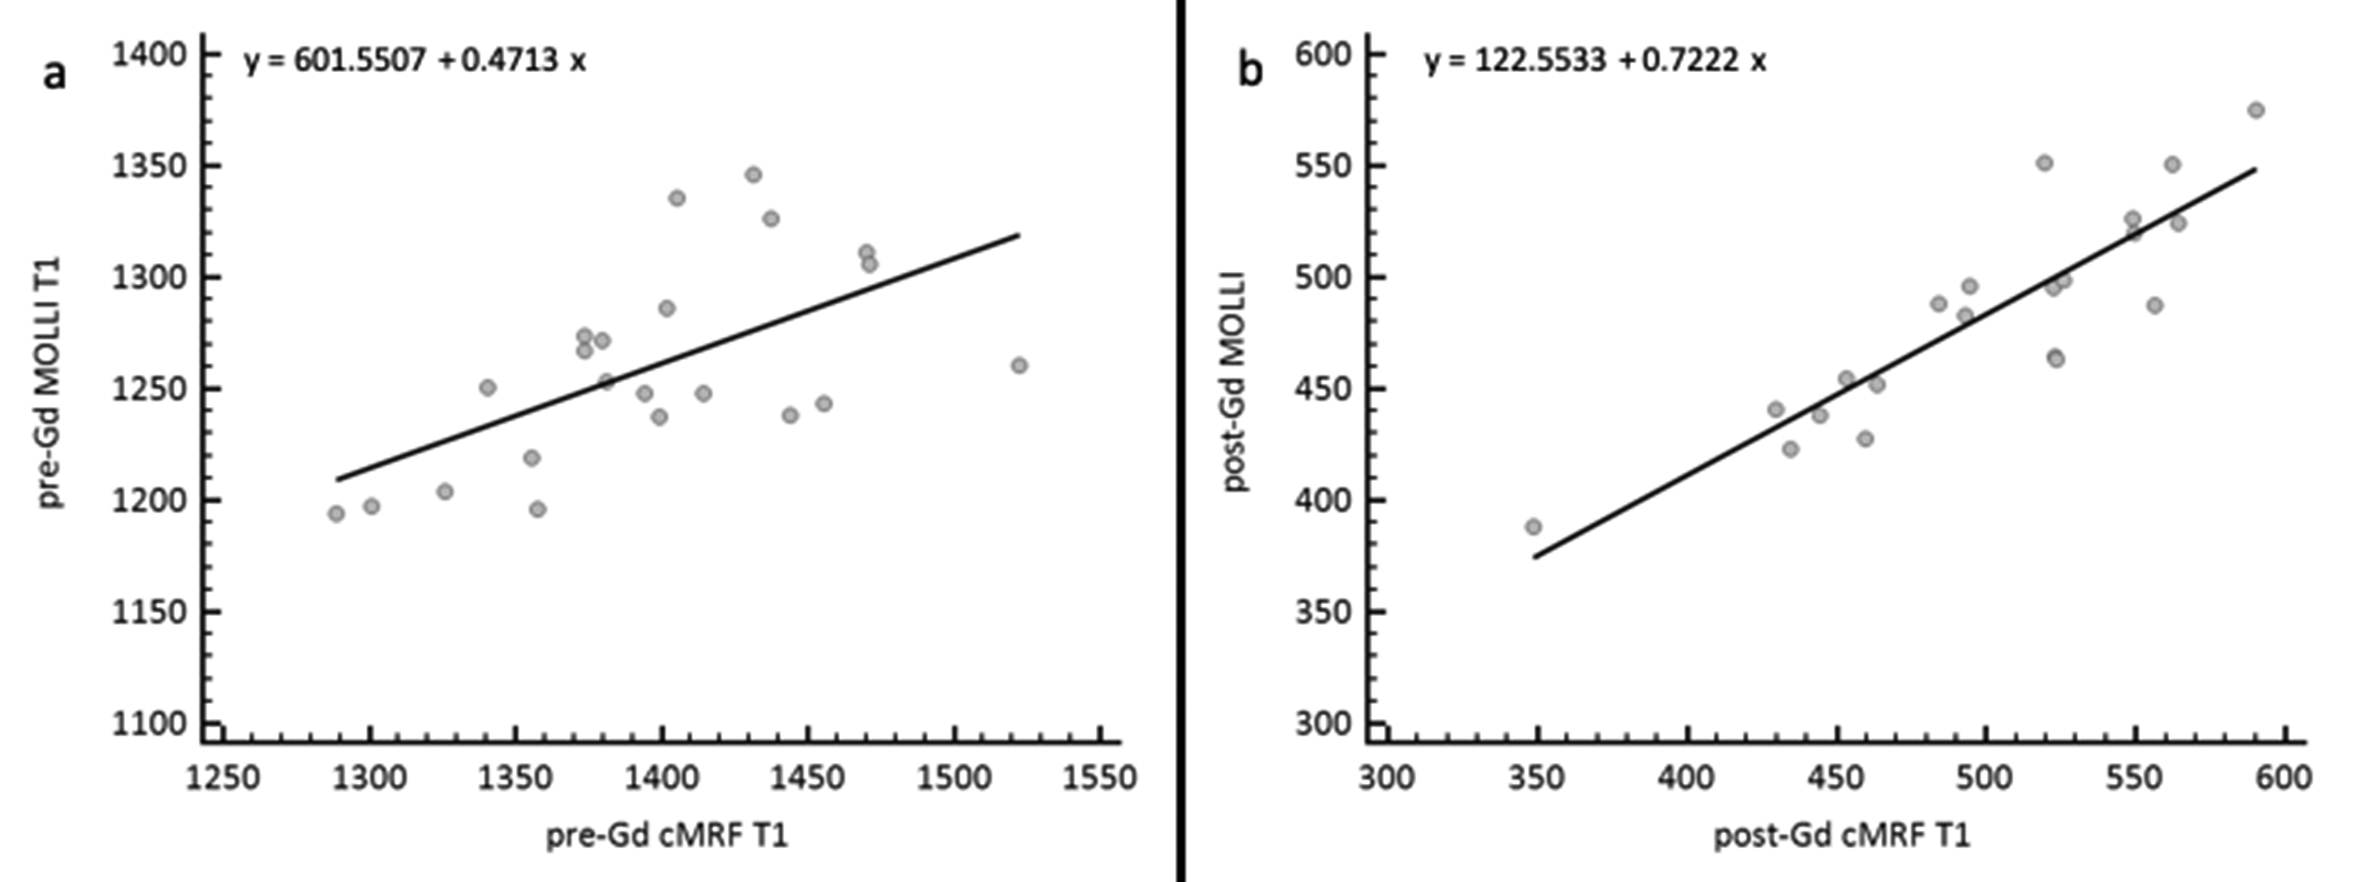
Regression analysis for cMRF T1 and MOLLI T1 for (a) pre-Gadolinium acquisitions and (b) post-Gadolinium acquisitions.

Regression analysis for extracellular volume (ECV) fractions derived from respective myocardial and blood-pool MOLLI T1 and cMRF T1 data with additional consideration of the patient’s hematocrit (measured by finger probe point-of-care (PoC) device.
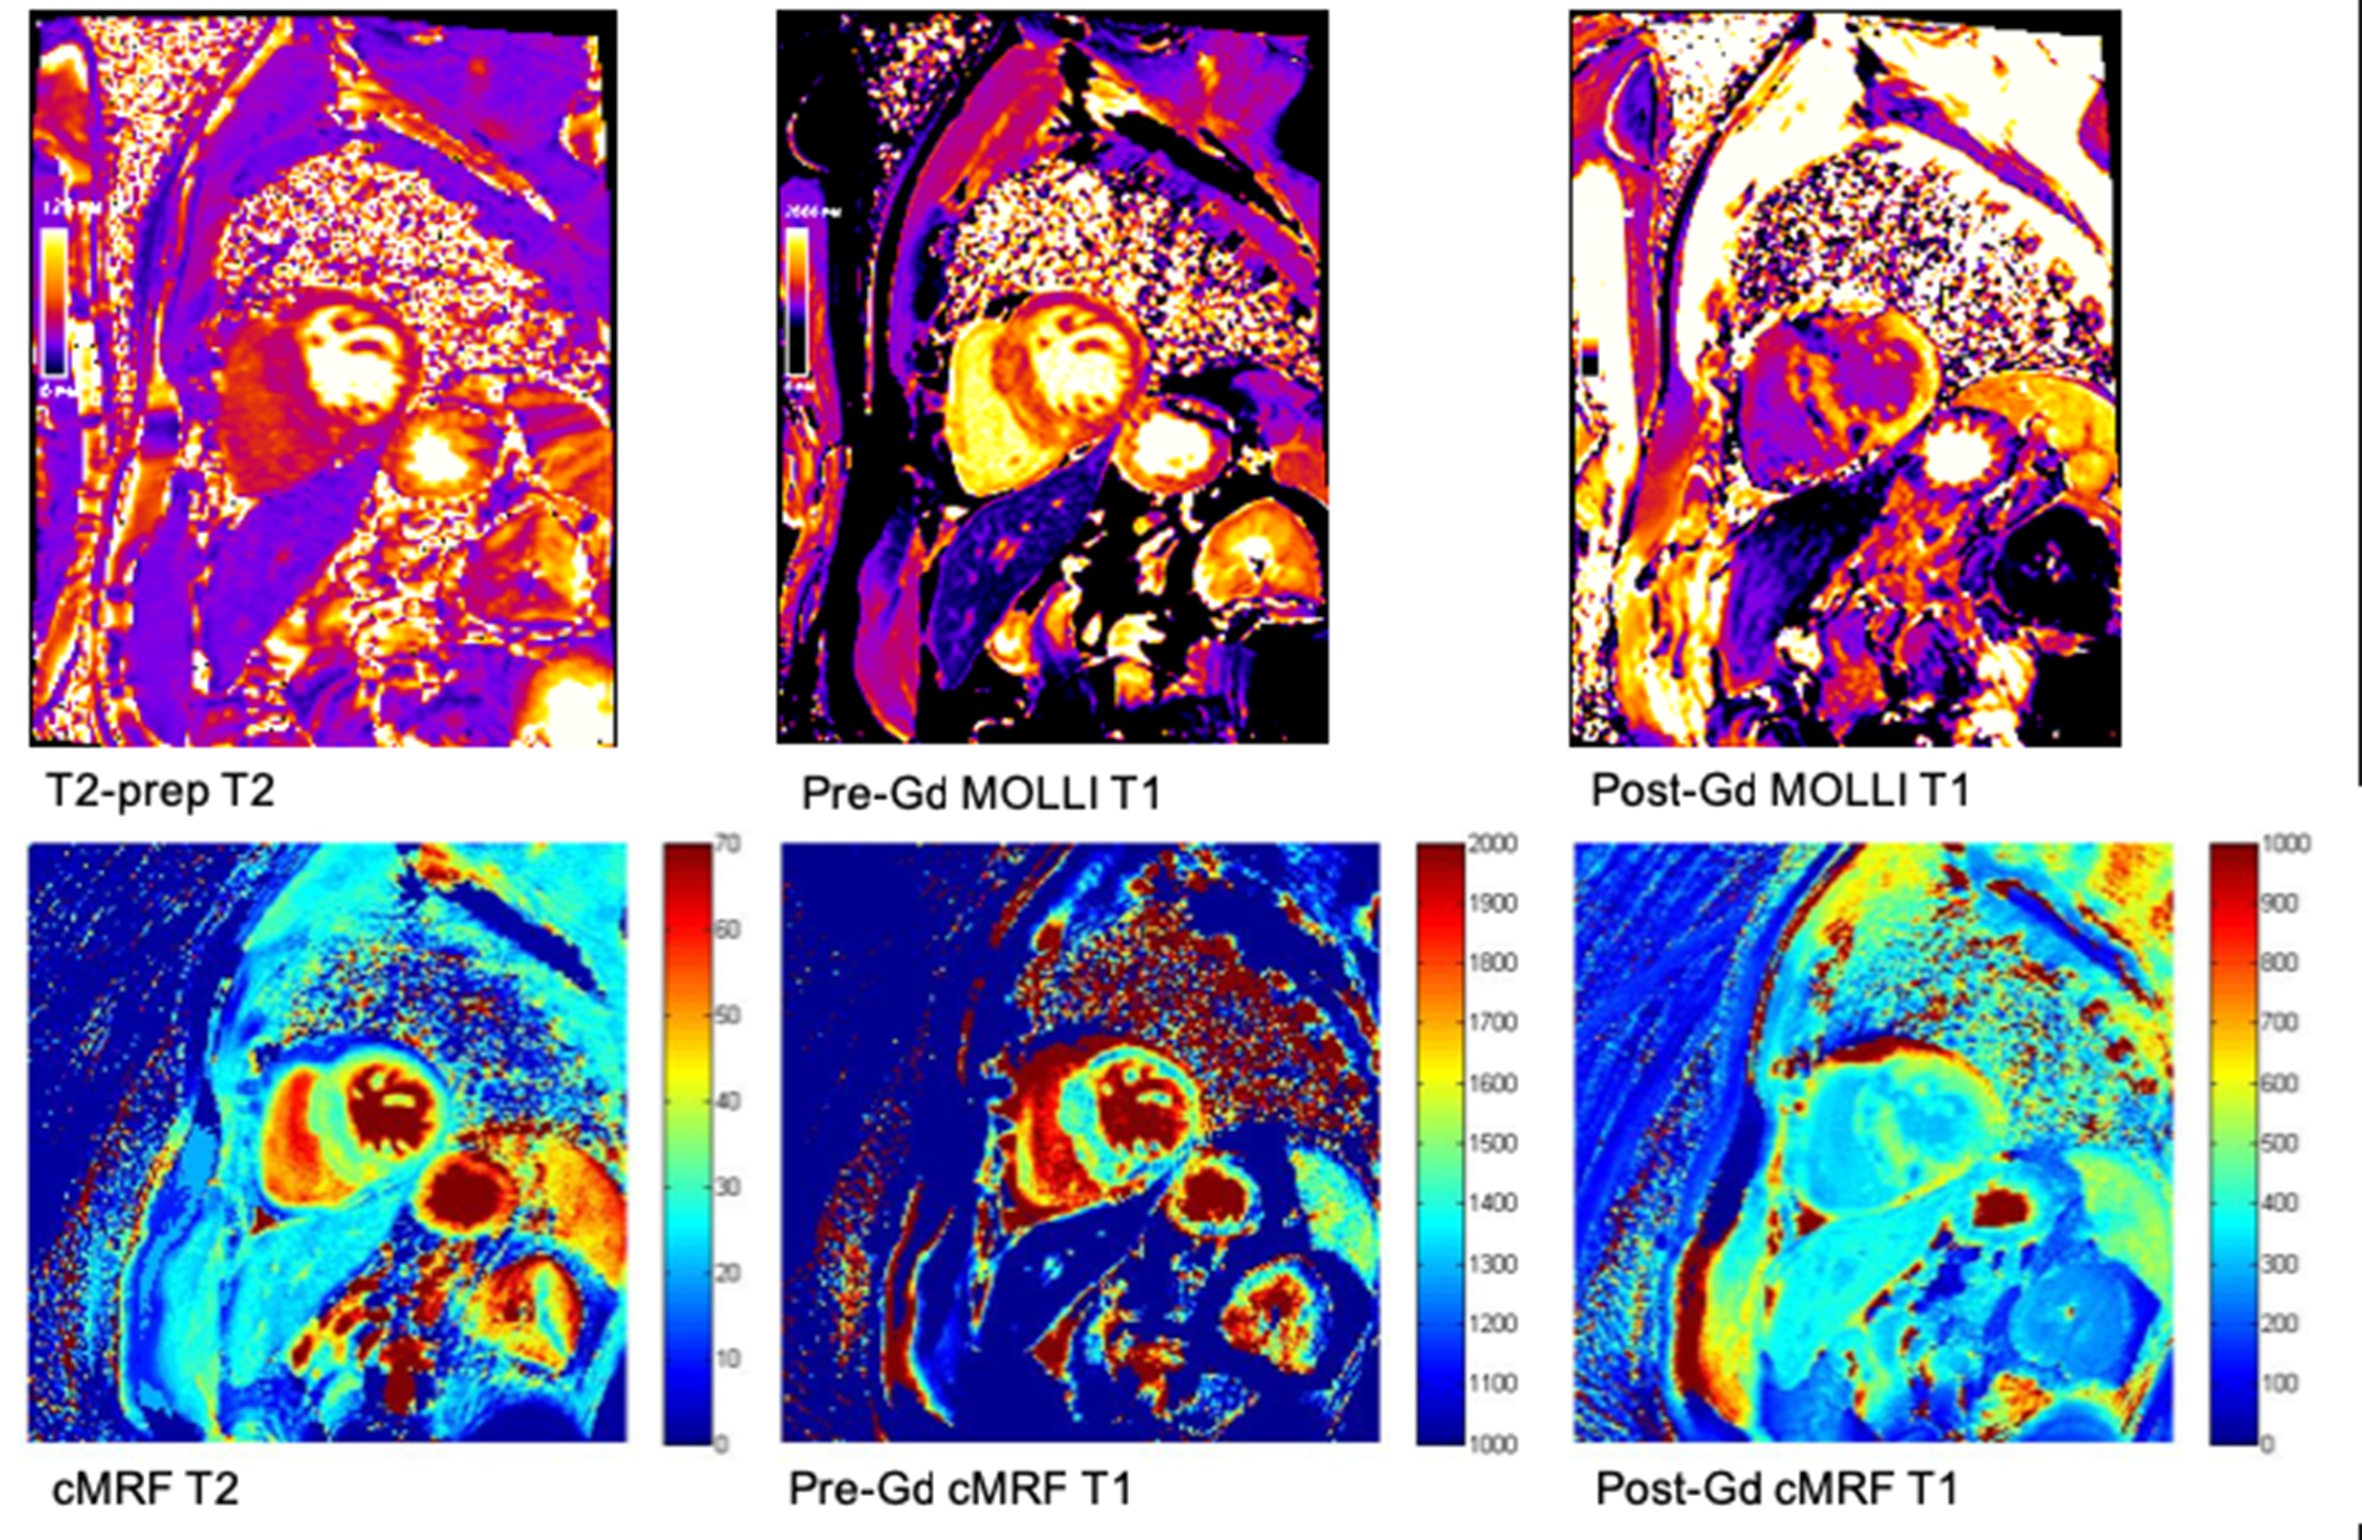
Mapping data from a 55 year old male patient with prominent asymmetrical septal (ASH-type) hypertrophic cardiomyopathy (HCM).Upper row demonstrates conventional cardiac relaxometry maps (T2, pre-Gadolinium T1, post-Gadolinium T1) with corresponding cMRF derived maps in the lower row.

65 year old male patient with concentric hypertrophic cardiomyopathy (HCM).Upper row demonstrates conventional cardiac relaxometry maps (T2, pre-Gadolinium T1, post-Gadolinium T1) with corresponding cMRF derived maps in the lower row.