2020
Simultaneous analysis of heart and kidney oxygenation using T2* BOLD MRI: investigation of cardiorenal relationshipMichinobu Nagao1, Umiko Ishizaki2, Kiyoe Ando2, Eri Watanabe2, Akiko Sakai2, Yasuhiro Goto2, Masami Yoneyama3, Takashi Namiki3, and Shuji Sakai2
1Diagnostic Imaging and Nuclear Medicine, Tokyo Women's Medical University, Tokyo, Japan, 2Tokyo Women's Medical University, Tokyo, Japan, 3Philips Electronics Japan, Tokyo, Japan
Synopsis
Tissue hypoxia plays a key role in the development and progression of cardiac and renal diseases. Blood oxygenation level dependent magnetic resonance imaging (BOLD-MRI) is the most promising imaging technique to monitor tissue oxygenation in humans. Cardiorenal syndrome is widely accepted as a complex clinical problem routinely faced by clinicians. However, the mechanism from the viewpoint of oxygenation is not understood. We analyses simultaneously myocardial and renal oxygenation using T2* cardiac MRI (T2*-CMR) and investigates the cardiorenal relationship.
Synopsis
Tissue hypoxia plays a key role in the development and progression of cardiac and renal diseases. Blood oxygenation level dependent magnetic resonance imaging (BOLD-MRI) is the most promising imaging technique to monitor tissue oxygenation in humans. Cardiorenal syndrome is widely accepted as a complex clinical problem routinely faced by clinicians. However, the mechanism from the viewpoint of oxygenation is not understood. We analyses simultaneously myocardial and renal oxygenation using T2* cardiac MRI (T2*-CMR) and investigates the cardiorenal relationship.Introduction
Oxygen-inhalation BOLD T2* cardiac magnetic resonance imaging (T2*-CMR) has been proposed as a novel quantification of myocardial oxygenation. Myocardial oxygenation (ΔT2*) was defined as the difference in T2* of myocardium between under room-air and oxygen inhalation (ΔT2*= T2*oxy-T2*air, ms) (1). Cardiorenal syndrome is widely accepted as a complex clinical problem routinely faced by clinicians. In the issue of cardiorenal syndrome, T2* in the kidney decreases after induced myocardial infarction in the experimental study (2). We propose a new simultaneous analysis for heart and kidney oxygenation using oxygen-inhalation BOLD T2*-CMR, and investigate the cardiorenal relationship and the association with myocardial oxygenation and fibrosis on T1 mapping in patients with cardiomyopathy.Methods
Data of T2*-CMR and T1 mapping using 3 tesla MR scanner (Ingenia CX, Philips Healthcare) for thirty-one patients with hypertrophic cardiomyopathy was analyzed. The patients with chronic kidney disease were excluded. T2*-CMR was measured using the black blood and multi-echo gradient-echo sequence (Fig. 1). Myocardial T2* for septum of left ventricle was measured under room-air and after 10 minutes inhalation of oxygen at the flow rate of 10 L/min. ΔT2* ratio (ΔT2* / T2*air, %) was calculated, and the segment with a ΔT2* ratio >10% was defined as hypoxic segment. Native T1 (ms) and extracellular volume fraction (ECV, %) for the same location for T2* measurement were measured on T1 mapping with MOLLI, and were used as estimates of fibrosis. In addition, renal T2* for the cortex of left. kidney using the same T2*-CMR under room-air was measured. Correlation of myocardial T2* and renal T2* was analyzed by the Pearson coefficient. Comparison of native T1 and ECV between segments with and without hypoxia was analyzed by the Mann-Whitney u-test.Results and Discussion
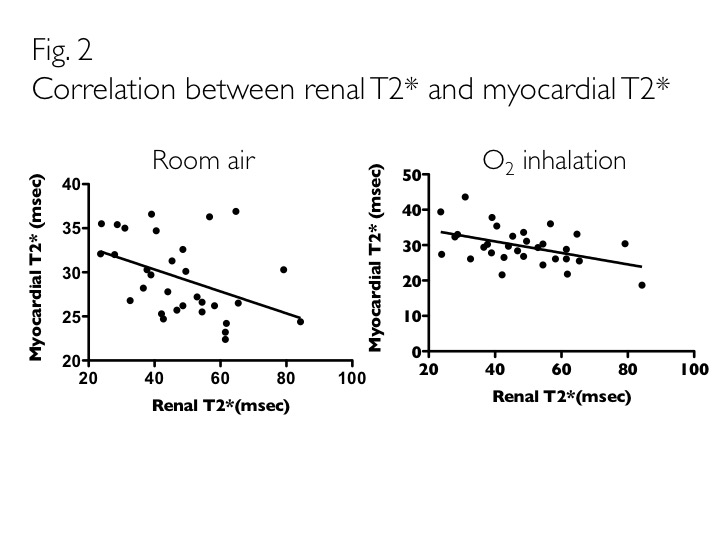
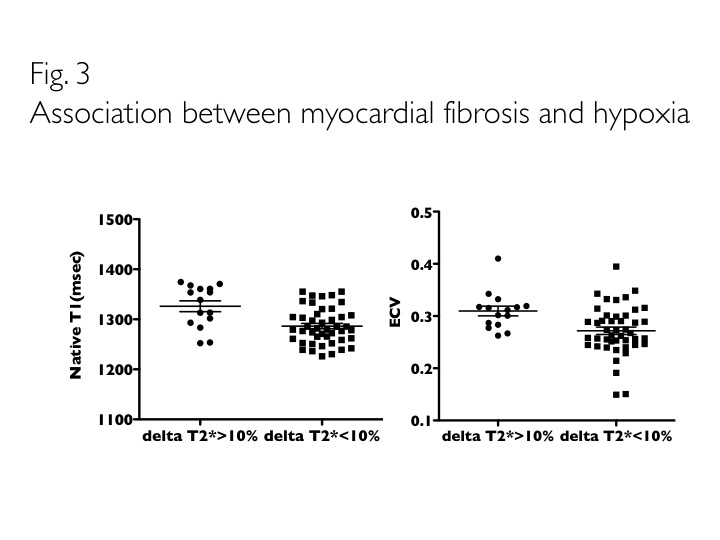
Renal T2* had negative correlations with myocardial T2* (room-air, r=-0.425, p<0.05; O2, r=-0.459, p<0.01) (Fig. 2). Fifteen hypoxic segments out of 62 segments (31x2) were observed (24%). Native T1 and ECV were significantly greater for hypoxic segments than non-hypoxic segments (Native T1, 1326±42ms vs. 1286±36ms, p<0.005; ECV, 31.0±3.6% vs. 27.2±4.7%, p<0.005) (Fig. 3). Deoxyhemoglobin shortens T2*. Changes in tissue oxygen tension cause changes in deoxyhemoglobin concentration that manifest on renal BOLD images as changes in T2*. Lower T2* (suggestive of increased hypoxia) have been demonstrated in animal models of renal disease. In most organs, tissue oxygenation or oxygen availability tracks blood flow. In kidneys, oxygen consumption is related to active sodium reabsorption and is inherently dependent on glomerular filtration rate, which in turn is related to renal blood flow (3). Therefore, decreased myocardial T2* is a possibility of becoming a signal of increased renal blood flow. Consequently, renal T2* changes inversely to myocardial T2*. This analysis enables non-invasive assessment of renal blood flow and hypoxia in various heart disease; therefore, the effect of medicines for hypertension and heart failure on the kidney can be clarified.Conclusion
Simultaneous analysis for heart and kidney oxygenation using BOLD T2*-CMR reveals the inverse correlation of myocardial T2* and renal T2*, suggesting that myocardial oxygenation controls renal blood flow. This is a novel imaging analysis that can detect auto regulation of heart and kidney.Acknowledgements
No acknowledgement found.References
(1) Nagao M, Yamasaki Y, Kawanami S, et al. Quantification of myocardial oxygenation in heart failure using blood-oxygen-level-dependent T2* magnetic resonance imaging: comparison with cardiopulmonary exercise test. Magn Reson Imaging 2017; 39: 138–143. (2) Chang D, Wang YC, Xu TT, et al. Noninvasive identification of renal hypoxia in experimental myocardial infarctions of different sizes by using BOLD MR imaging in a mouse model. Radiology 2018; 286: 129–139. (3) Pruijim M, Mendichovszky IA, Liss P, et al. Renal blood oxygenation level-dependent magnetic resonance imaging to measure renal tissue oxygenation: a statement paper and systematic review. Nephrol Dial Transplant 2018; 33: ii22-ii28.Figures
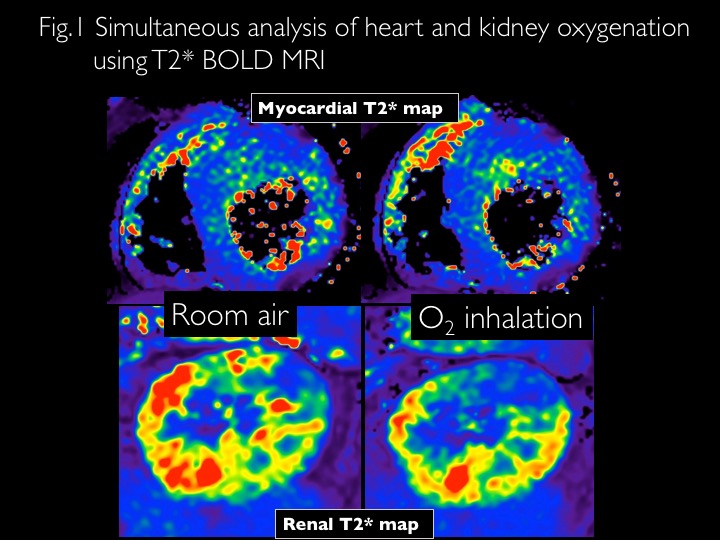
Simultaneous analysis of heart and kidney oxygenation using T2* BOLD MRI
Correlation between renal T2* and myocardial T2*
Association between myocardial fibrosis and hypoxia