2019
Myocardial T1 and T2 Mapping and Tissue-tracking Strain Analysis in Hemodialysis Patients with Preserved Left Ventricular Ejection Fraction by Cardiac Magnetic Resonance Imagingxiaoyu han1 and heshui shi1
1Department of Radiology, Union Hospital, Tongji Medical College, Huazhong University of Science and Technology, wuhan, China
Synopsis
Myocardial T1 and T2 Mapping and Tissue-tracking Strain Analysis in
Hemodialysis Patients with Preserved Left Ventricular Ejection
Fraction by Cardiac Magnetic Resonance Imaging
Background
Hemodialysis (HD) patients, similar to what has been seen in dilated cardiomyopathy patients, show high levels of fibrosis on myocardial biopsy, which is associated with an increased risk of sudden cardiac death. However, the left ventricular ejection fraction (LVEF) is often preserved late into the development of cardiomyopathy. Cardiac magnetic resonance (CMR) T1/T2 mapping and tissue-tracking strain analysis are considered to be more useful as early quantitative techniques that can evaluate myocardial tissue characterization and mechanic alterations in hemodialysis patients. The purpose of this study was to assess left ventricular myocardial native T1/T2 value and systolic strains in HD patients with preserved LVEF.Materials & Methods
We recruited 43 HD patients with end-stage renal disease (mean age: 59± 11 years; 28 males) and 28 healthy volunteers matched with gender, age, and BMI to undergo CMR examination on a 1.5T MR scanner (MAGNETOM Aera, Siemens Healthcare, Erlangen, Germany). The native T1/T2 values of left ventricular myocardium were measured in the T1 and T2 maps generated using the MOdified Look-Locker inversion recovery (MOLLI) technique and the T2-prepared single-shot SSFP technique, respectively. Left ventricular global systolic strain and strain rates were evaluated with routine cine images using a prototype post-processing software (Trufi-Strain, version 2.0; Siemens Healthcare, Erlangen, Germany) based on heart deformation analysis (HDA).Results
The global native T1 value and T2 value were significantly higher in HD patients than in controls (native T1:1056±32ms vs. 1006±25ms, p<0.001; T2:50±3ms vs. 46±2ms, p<0.001). The mean peak global circumferential strain (GCS) and global longitudinal strain (GLS) were both significantly reduced in HD patients compared with controls (GCS: –13±3 vs. –16±3, p<0.001; GLC: –12±4 vs. –15±3, p=0.001). Compared with controls, the left ventricular mass (LVM), end-diastolic volume (EDV) and end-systolic volume (ESV) normalized to body surface area were significantly increased (LVM: 73±22 vs. 54±10g/m2, p<0.001; EDV: 76±25 vs. 54±10mL/m22, p<0.001; ESV: 33±20 vs. 20±7mL/m2, p<0.001) in HD. However, no significant difference was found between two groups regarding LVEF(p=0.095). GCS and GLS were correlated with the LVEF in HD patients (GCS: r =-0.385, p=0.011; GLS: r=0.416, p=0.005). GLS was correlated with the LVM in HD patients(r=0.416, p=0.005).Conclusion
Myocardial abnormalities in HD patients may be assessed noninvasively with native T1/T2 mapping. Strain may be an early sensitive predictor of reducing left ventricular systolic function in HD patient with preserved LVEF.Acknowledgements
No acknowledgement found.References
[1] Edwards NC, Moody WE, Yuan M, et al. Diffuse interstitial fibrosis and myocardial dysfunction in early chronic kidney disease [J]. American Journal of Cardiology, 2015,115(9): 1311. [2] Edwards NC, Moody WE, Chue CD, et al. Defining the natural history of uremic cardiomyopathy in chronic kidney disease: the role of cardiovascular magnetic resonance [J]. Jacc Cardiovascular Imaging, 2014,7(7): 703-714. [3] Edwards NC, Moody WE, Chue CD, et al. Defining the natural history of uremic cardiomyopathy in chronic kidney disease: the role of cardiovascular magnetic resonance [J]. JACC Cardiovasc Imaging, 2014,7(7): 703-714. [4] Foley RN, Parfrey PS, Kent GM, et al. Long-term evolution of cardiomyopathy in dialysis patients [J]. Kidney International, 1998,54(5): 1720. [5] Foley RN. Clinical epidemiology of cardiac disease in dialysis patients: left ventricular hypertrophy, ischemic heart disease, and cardiac failure [J]. Seminars in Dialysis, 2003,16(2): 111. [6] Patel RK, Mark PB, Johnston N, et al. Renal Transplantation Is Not Associated with Regression of Left Ventricular Hypertrophy: A Magnetic Resonance Study [J]. Clinical Journal of the American Society of Nephrology Cjasn, 2008,3(6): 1807. [7] Schietinger BJ, Brammer GM, Wang H, et al. Patterns of Late Gadolinium Enhancement in Chronic Hemodialysis Patients [J]. Jacc Cardiovascular Imaging, 2008,1(4): 450-456. [8] Caudron J, Fares J, Bauer F, et al. Evaluation of left ventricular diastolic function with cardiac MR imaging [J]. Radiographics A Review Publication of the Radiological Society of North America Inc, 2011,31(1): 239. [9] Rutherford E, Mangion K, McComb C, et al. Myocardial changes in incident haemodialysis patients over 6-months: an observational cardiac magnetic resonance imaging study [J]. Sci Rep., 2017,7(1). [10] Cannao PM, Altabella L, Petrini M, et al. Novel cardiac magnetic resonance biomarkers: native T1 and extracellular volume myocardial mapping [J]. Eur Heart J Suppl, 2016,18(Suppl E): E64-E71. [11] Graham-Brown MPM, March DS, Churchward DR, et al. Novel cardiac nuclear magnetic resonance methodfor noninvasive assessment of myocardialfibrosis in hemodialysis patients [J]. Kidney International, 2016,90(4): 835. [12] Graham-Brown MP, March DS, Churchward DR, et al. Novel cardiac nuclear magnetic resonance method for noninvasive assessment of myocardial fibrosis in hemodialysis patients [J]. Kidney Int, 2016,90(4): 835-844. [13] Liu H, Yang D, Wan K, et al. Distribution pattern of left-ventricular myocardial strain analyzed by a cine MRI based deformation registration algorithm in healthy Chinese volunteers [J]. Scientific Reports, 2017,7: 45314. [14] Mangion K, Clerfond G, McComb C, et al. Myocardial strain in healthy adults across a broad age range as revealed by cardiac magnetic resonance imaging at 1.5 and 3.0T: Associations of myocardial strain with myocardial region, age, and sex [J]. J Magn Reson Imaging, 2016,44(5): 1197-1205. [15] Rutherford E, Talle MA, Mangion K, et al. Defining myocardial tissue abnormalities in end-stage renal failure with cardiac magnetic resonance imaging using native T1 mapping [J]. Kidney Int, 2016,90(4): 845-852. [16] Liu YW, Su CT, Sung JM, et al. Association of left ventricular longitudinal strain with mortality among stable hemodialysis patients with preserved left ventricular ejection fraction [J]. Clin J Am Soc Nephrol, 2013,8(9): 1564-1574. [17] Liu YW, Su CT, Huang YY, et al. Left ventricular systolic strain in chronic kidney disease and hemodialysis patients [J]. Am J Nephrol, 2011,33(1): 84-90. [18] Dasselaar JJ, Slart RHJA, Knip M, et al. Haemodialysis is associated with a pronounced fall in myocardial perfusion [J]. Nephrology, dialysis, transplantation : official publication of the European Dialysis and Transplant Association - European Renal Association, 2009,24(2): 604. [19] Arapcic S. Impact of left Ventricular Hypertrophy on diastolic function in hemodialysis (HD) patients [J]. Healthmed, 2011,5(3): 671-675. [20] Odudu A, Eldehni MT, Mccann GP, et al. Characterisation of cardiomyopathy by cardiac and aortic magnetic resonance in patients new to hemodialysis [J]. European Radiology, 2016,26(8): 2749-2761. [21] Wang L, Yuan J, Zhang SJ, et al. Myocardial T1rho mapping of patients with end‐stage renal disease and its comparison with T1 mapping and T2 mapping: A feasibility and reproducibility study [J]. Journal of Magnetic Resonance Imaging Jmri, 2016,44(3): 723-731.Figures

Figure1. Comparison
of mean native myocardial T1 (a), T2 (b) values, Peak global circumferential
strain(c) and peak global longitudinal strain (d)between healthy controls and hemodialysis
patients.

Figure2. Representative maps of a 64-year-old HD patient with
a 36-month dialysis vintage at the left ventricular middle short-axis segment(A)
with modified Look-Locker Inversion Recovery (MOLLI) sequence showing native T1
mapping(B), T2 mapping of the same slice(C).
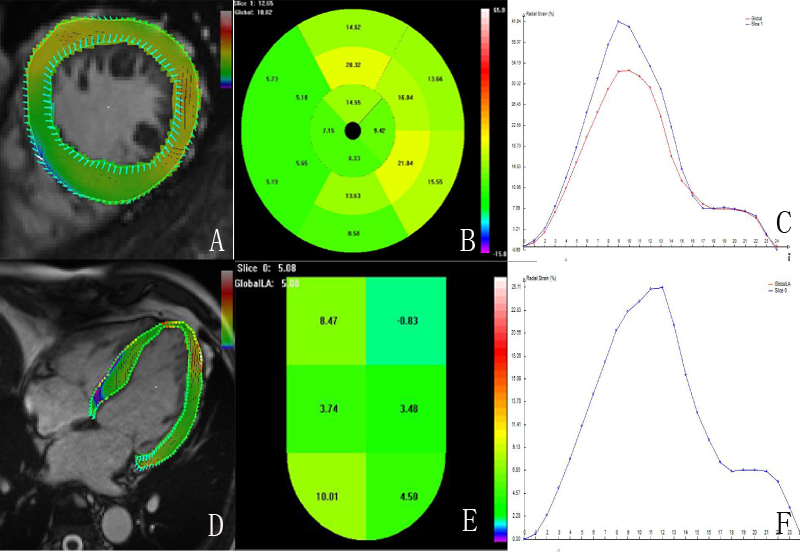
Figure 3. The diagram of the peak systolic
strain analysis of the left ventricular myocardium in a 59-year-old HD patient
with a 41-month dialysis vintage by HDA software. Endocardial and epicardial contouring(A), polar bulls-eye plot(B) and strain-time curves(C) for systolic strain analysis in the short axis. Endocardial
and epicardial contouring(D), colored map(E) and
strain-time curves(F)
for systolic strain analysis in the long axis.