2018
Validation of Fully Automatic SegmenTal Relaxometry (FASTR) in patients post myocardial infarction1Physical Sciences Platform, Sunnybrook Research Institute, Toronto, ON, Canada, 2Cardiology, Sunnybrook Health Sciences Centre, Toronto, ON, Canada, 3Medical Biophysics, University of Toronto, Toronto, ON, Canada
Synopsis
T1 mapping has started to be used for both diffuse and focal diseases of the heart and recently in multi-slice mode to investigate the regional (segmental) variations in T1 and ECV. The processing usually involves contouring the endo and epicardial boundaries manually, which could be cumbersome especially for high-volume studies. Recently, we presented a fully automatic approach (FASTR), to calculate T1 and ECV values segment-wise. Here we present the initial validation of our technique in patients post myocardial infarction. FASTR is comparable to an expert-driven contour and has low bias and similar variability in comparison to inter-observer analysis.
Introduction
T1 mapping is being increasingly used for both focal and diffuse diseases to investigate regional variations in T1 and ECV [1,2,3]. To calculate T1 segment-wise for AHA representation, the endocardial and epicardial contours are usually drawn manually which can be laborious, particularly for high-volume patient studies. Last year we presented a fully automatic processing framework, FASTR, to calculate T1 values segment-wise and display using the AHA model [4]. An automatic method would need to be validated to ensure that it remains useful across a wide-variety of images. The aim of this study is to demonstrate the initial validation of our technique in the case of myocardial infarction by comparing it with expert-determined contours.
Methods
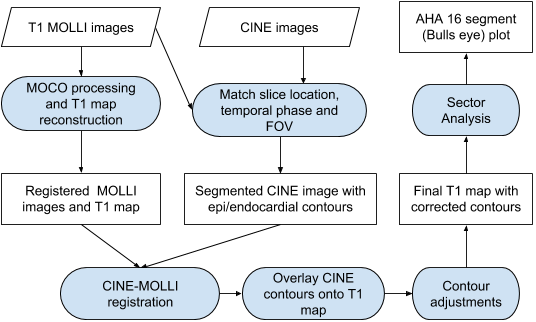
FASTR Design: Figure 1 depicts our algorithm flowchart. We start with a standard T1 mapping reconstruction using registration for motion correction across inversion times (MOCO) [5]. The closest CINE SSFP image in both slice-location and temporal cardiac phase is then selected for automatic detection of endocardial and epicardial contours based on a previously published technique [6]. The resulting contours are then transferred to the MOLLI derived T1 map afterregistering the CINE and MOLLI images. The contours are further adjusted on the T1-map by shifting them towards the mid-myocardium, so that the contours avoid any blood pool and lung interface. These adjusted and corrected contours are used for generating a 16 segment AHAmodel with mean T1 shown in each segment. Blood T1 is calculated on a uniform region avoiding structures such as papillary muscles. The above process is repeated for both native and post-contrast MOLLI images to arrive at the segment-wise partition coefficient (λ).
Patient Study: 11 patients were imaged on a GE 1.5T scanner ranging from 2 days to 8 months after myocardial infarction . Routine CINE SSFP imaging was performed for functional imaging. Native T1 values were quantified in 3 short-axis slices (basal, mid and apical) using the MOLLI sequence with a 5-3 pattern with 3 pausing heart-beats. Infarction was assessed using LGE imaging. Postcontrast T1 mapping using MOLLI was performed at 15 min post Gd injection.
Expert validation: Two trained cardiac imaging experts were asked to draw contours on T1-maps on all the patient exams. Besides the endo and epicardial contours they also drew contours on the blood and marked the right-ventricular insertion points so that the partition coefficient can readily be calculated for all AHA segments. 32 AHA segments were drawn on each patient, 16 for native-T1 and 16 for post-Gd T1.
Results
Figure 2 shows contours and segmented T1 values from a representative patient at Week-1 post-MI. Note that the method is robust even in the presence of an MI (involving edema); in this respect, the CINE derived contours helped with the segmentation on T1 maps given that the CINE images are relatively insensitive to MI pathology. Figure-3 demonstrates a strong correlation between the FASTR and experts for both native-T1 and post-Gd T1 values across 352 AHA segments. The Bland-Altman plots on Fig-4 and Fig-5 show that the bias and variability of T1 and partition-coefficients are very similar to the interobserver variability.Discussion
T1 mapping is currently being investigated for a wide variety of diseases, both diffuse and focal. The goal of this study is to validate the FASTR framework when presented with MOLLI images in the context of myocardial infarction, which represents a wide range of T1 patterns in the acute and chronic phase of disease. As the results show, FASTR automatically produces segmental partition-coefficient values with very low bias and variability very similar to the inter-observer variability across experts. This is particularly translatable to large-volume studies such as those in the UK Biobank [7], where the manual contouring can be completely avoided.
Advantages and Limitations: Since our method utilizes contours generated from CINE images as a starting point, it is more robust than processing MOLLI images directly, where segmentation can be confounded in the presence of pathology (eg. edema, hemorrhage). FASTR does expect CINE images to be available for processing, but fortunately, CINE imaging is routine for all cardiac MRI studies, even for larger ones such as the UK BioBank. Since FASTR processes one exam at a time independently, it lends itself easily to parallel batch processing. However partly due to this behaviour, it currently doesn’t automatically detect any image artifacts either in CINE or MOLLI images.
Conclusions
Here we have presented initial validation results for the FASTR framework which automatically reconstructs and displays segment-wise T1 and partition-coefficient values. Segment-wise ECV can also be displayed if hematocrit values are available. The FASTR approach will be highly instrumental in automated processing of high-volume data where minimal operator input is desired.Acknowledgements
We would like to acknowledge funding support from the Ontario Research Fund (ORF-RE7-21)References
- Messroghli et.al: Clinical recommendations for cardiovascular MR mapping: JCMR 2017;19:75.
- Cheng H-LM et.al: Practical medical applications of quantitative MR relaxometry. JMRI 2012;36:805-824.
- Haaf et.al: Cardiac T1 Mapping and Extracellular Volume (ECV) in clinical practice: a comprehensive review - JCMR-2016 18:89
- Ramanan et.al: FASTR - Initial results using T1 mapping - ISMRM-2018
- Xue H, et. al: Motion correction for myocardial T1 mapping MRM 2012; 67:1644-1655
- Lu et.al: Segmentation of Left Ventricle in Cardiac Cine MRI: An Automatic Image-Driven Method. In: Functional Imaging and Modeling of the Heart. Lecture Notes in Computer Science. Springer, Berlin, Heidelberg; 2009. pp. 339–347
- UK Biobank’s cardiovascular magnetic resonance protocol: JCMR 2016 18:8
Figures