2017
Hybrid PET/MR in Cardiac Sarcoidosis: A segmental analysis.1Cardiovascular Imaging, Northwestern University, Chicago, IL, United States, 2Nuclear Imaging, Northwestern University, Chicago, IL, United States, 3Radiology, Northwestern University, Chicago, IL, United States
Synopsis
Cardiac sarcoidosis (CS) is difficult to clinically diagnose but associated with high morbidity and mortality. Hybrid PET/MR has been shown to provide clinicians with complementary data regarding both the pattern and activity of myocardial disease. We performed a segmental quantitative analysis of MR parameters on 30 patients including T1 and T2 mapping, ECV, scar and strain acquired as part of a hybrid PET/MR study to evaluate characteristic patterns of imaging in this heterogeneous disease process. Scar quantification had a significant positive correlation with T1 and ECV and was negatively correlated with strain.
Introduction
Sarcoidosis is a granulomatous disease which most commonly affects the lung and hilar lymph nodes but can involve many different organs. Clinically, cardiac sarcoidosis (CS) is diagnosed only in a small percentage of these patients but is much more commonly identified at post mortem. It is associated with significant morbidity and mortality including arrhythmias, heart failure and sudden death. Advanced cardiac imaging is recommended in patients with biopsy proven extra-cardiac sarcoidosis who are symptomatic or have abnormality on electrocardiogram or echocardiogram.1 Hybrid 18F-fluorodeoxyglucose (FDG) positron emission tomography/magnetic resonance imaging (PET/MRI) has been shown to provide complementary data regarding both the pattern and activity of myocardial disease in patients undergoing evaluation for CS, focusing on FDG uptake and late gadolinium enhancement (LGE) as well as focal measurements of T2 maps in regions of abnormal FDG uptake. 2,3 By its nature, CS is a patchy disease with evolution of imaging features between early onset inflammation and late scarring.4 Strain analysis of echocardiographic and MR images, in particular global longitudinal strain, has been shown to detect evidence of CS before regional wall- motion abnormalities become visible or a reduction in left ventricular ejection fraction is noted.5, 6 We hypothesized that a segmental quantitative analysis of MR parameters including T1 and T2 mapping, ECV, scar and strain would allow further elucidation of characteristic patterns of imaging in this heterogeneous disease process.Methods
45 patients (25 male, age range 27-83 years) with suspected cardiac sarcoidosis referred for PET/MR to evaluate for suspected cardiac sarcoidosis were recruited in an Institutional Review Board approved study over 20-months. Prior to imaging, all patients followed strict dietary preparation to suppress physiologic myocardial FDG uptake. Each patient underwent simultaneous cardiac MRI including cine imaging, T2 and pre/post-contrast T1 mapping and LGE as well as FDG PET cardiac imaging on a hybrid 3T PET/MR system (Biograph-mMR, Siemens Healthineers).7-9 Blood hematocrit was drawn on the day of imaging when mapping sequences were performed.
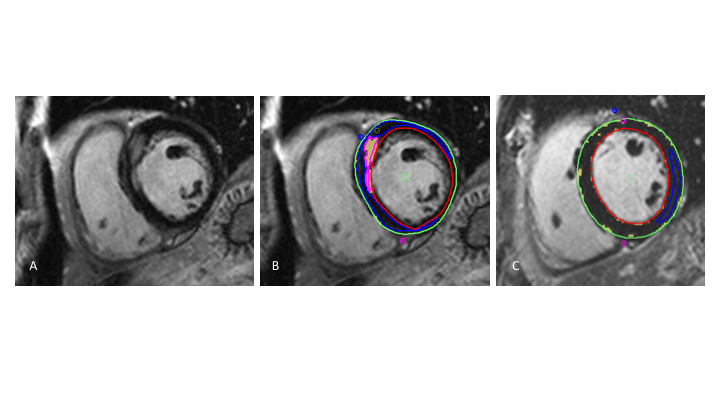
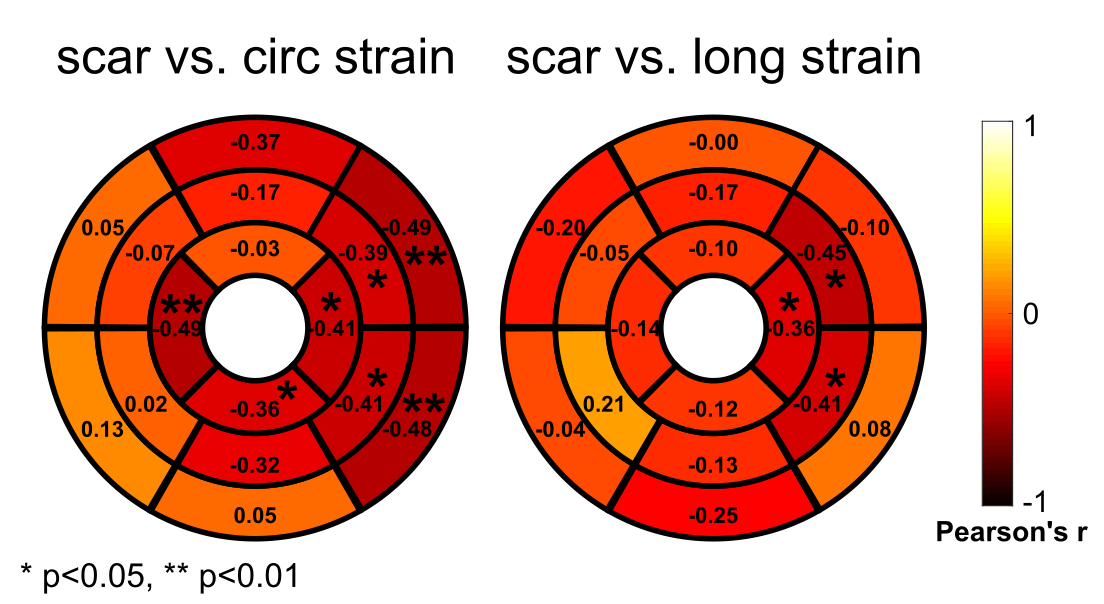
PET images were analyzed in Syngo (Siemens Healthineers). PET positive cases were defined as those with visually focal, focal-on-diffuse or diffuse uptake on PET. MR images were anonymized and analyzed with dedicated software (Circle, cvi42) to determine segmental quantitative T2, native T1, ECV, scar and strain values (Fig. 1). MRI positive cases were defined as those with LGE qualitatively suspicious for sarcoidosis. Pearson's correlation coefficient (r) was used to investigate associations between quantity of scar and T2, native T1, ECV and strain values in each of 16 AHA segments.
Results
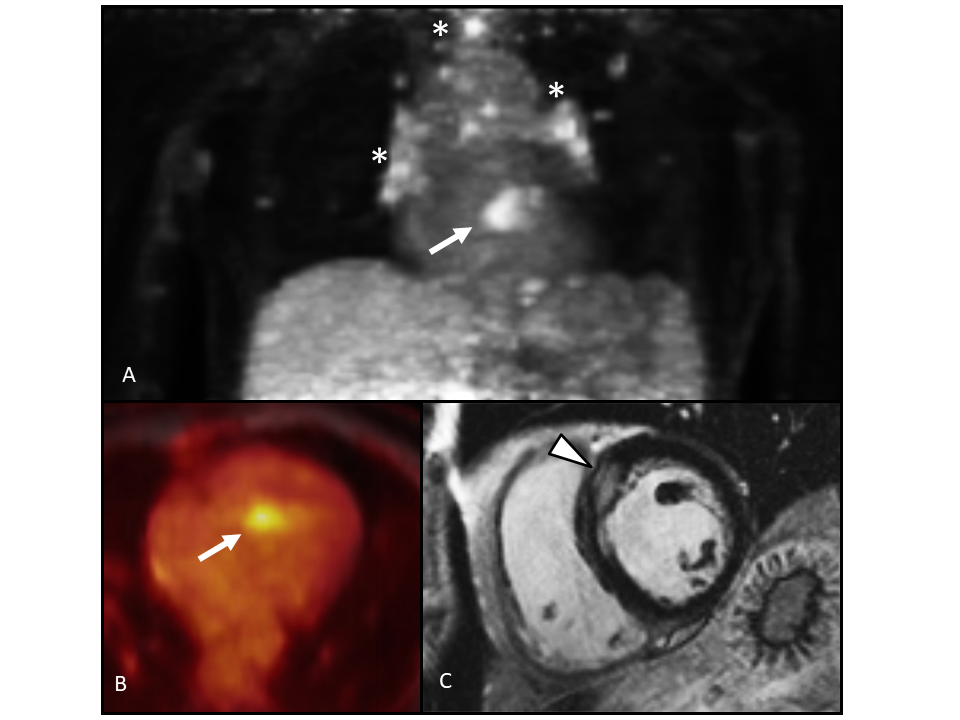
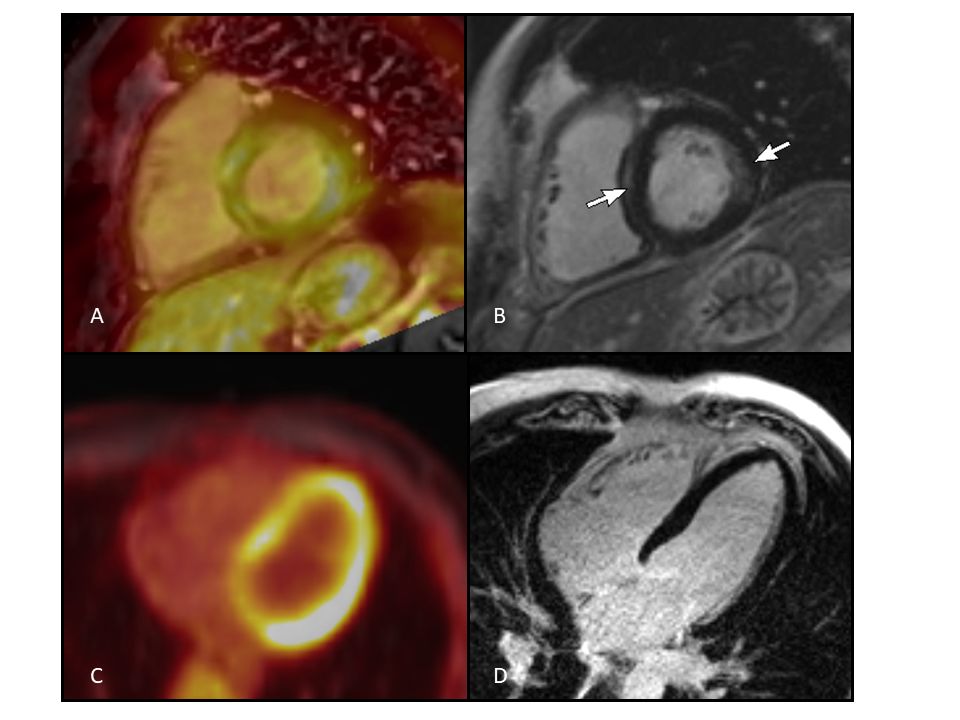
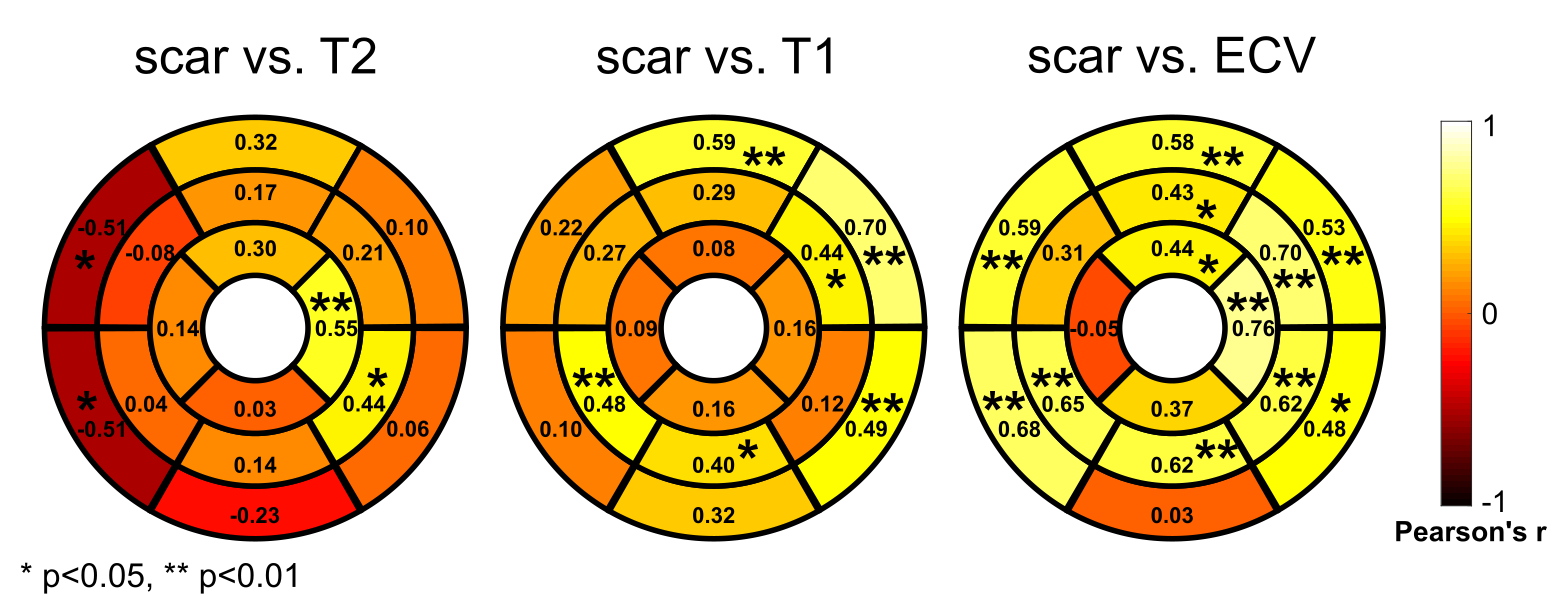
2 of 45 studies were excluded due to non-adherence to dietary preparation. Imaging appearances were variable with focal, focal on diffuse and diffuse patterns of FDG uptake and patchy areas of predominantly sub-epicardial and mesocardial areas of fibrosis on late gadolinium enhanced MRI (Fig.2). Areas of FDG uptake did not always demonstrate enhancement (Fig.3). 6 were PET+/MR+, 6 PET+/MR-, 9 PET-/MR+ and 20 PET-/MR. 4 studies had no or technically inadequate LGE, 2 of which were PET+ and 2 PET-. 31/43 studies included T1 and T2 mapping sequences. Of the 31 studies with mapping, 28 also had imaging suitable for scar quantification. Scar quantification had a significant positive correlation with T1 and ECV (Fig.4). Some segments of T2 maps had a significant positive correlation with scar and some had a significant negative correlation (Fig.4). 30/43 patients had both scar quantification and strain analysis performed. Quantitative scar was correlated with decreased segmental circumferential and longitudinal strain, significant in the lateral wall (Fig.5).Discussion
Cardiac sarcoidosis is difficult but important to diagnose clinically as it is associated with high morbidity and mortality. Gold standard myocardial biopsy is invasive, associated with complications and not always diagnostic given the patchy nature of the infiltration. Hybrid PET/MR combines the soft tissue contrast of MRI with metabolic data from PET to offer comprehensive myocardial evaluation for all stages of infiltration.10 Segmental analysis of the imaging data acquired showed that scar quantification was positively correlated with T1 and ECV. In some segments scar was correlated positively with T2 mapping and in some segments it was negatively correlated. This may represent the evolution of the granulomatous infiltrate which initially causes acute myocardial inflammation before gradually causing myocardial fibrosis. As expected, scarring was negatively correlated with strain.11Conclusion
A segmental quantitative analysis of MR parameters including T1 and T2 mapping, ECV, scar and strain acquired as part of a hybrid PET/MR study may allow further elucidation of characteristic patterns of imaging in this heterogeneous disease process. Further subgroup analysis of the segmental data and FDG uptake is required.Acknowledgements
We wish to acknowledge Dr. Michael Markl for advice regarding data analysis methods.References
- Birnie D, Sauer W, Bogun F, et al. HRS expert consensus statement on the diagnosis and management of arrhythmias associated with cardiac sarcoidosis. Heart Rhyth Soc. 2014: 11(7);1304-23.
- Dweck M, Abgral R, Trivieri M et al. Hybrid Magnetic Resonance Imaging and Positron Emission Tomography With Fluorodeoxyglucose to Diagnose Active Cardiac Sarcoidosis. J Am Coll Cardiol Img 2017: 11(1); 94-107.
- Wicks E, Menezes L, Barnes A, et al. Diagnostic accuracy and prognostic value of simultaneous hybrid 18F-fluorodeoxyglucose positron emission tomography/magnetic resonance imaging in cardiac sarcoidosis. Eur Heart J Cardiovasc Imaging. 2018 Jul 1;19(7):757-767.
- Hulten E, Aslam S, Osborne M, et al. Cardiac sarcoidosis-state of the art review. Cardiovasc Diagn Ther. 2016 Feb;6(1):50-63.
- Murtagh G, Laffin LJ, Patel KV, et al. Improved detection of myocardial damage in sarcoidosis using longitudinal strain in patients with preserved left ventricular ejection fraction. Echocardiography. 2016 Sep; 33(9): 1344–1352.
- Dabir D, Meyer D, Kuetting D et al. Diagnostic Value of Cardiac Magnetic Resonance Strain Analysis for Detection of Cardiac Sarcoidosis. Rofo. 2018 Aug;190(8):712-721.
- Giri S, Chung Y-C, Merchant A, et al. T2 quantification for improved detection of myocardial edema. J Cardiovasc Magn Reson. 2009;11:56.
- Messroghli DR, Radjenovic A, Kozerke S, et al. Modified Look-Locker Inversion Recovery (MOLLI) for High-Resolution T1 Mapping of the heart. Magn Reson Med. 2004;52:141–6.
- Moon JC, Messroghli DR, Kellman P, et al. Myocardial T1 mapping and extracellular volume quantification: A Society for Cardiovascular Magnetic Resonance (SCMR) and CMR Working Group of the European Society of Cardiology consensus statement. J Cardiovasc Magn Reson. 2013;15:92.
- Quick HH. Integrated PET/MR. J Mag Reson Imaging 2014;39:243-58.
- Scatteia A, Baritussio A, Bucciarelli-Ducci C. Strain imaging using cardiac magnetic resonance. Heart Fail Rev. 2017;22(4):465-476.
Figures