2010
Assessing myocardial infarct size by novel TRAFFn relaxation time method in lymphatic insufficient mice1A.I. Virtanen Institute for Molecular Sciences, University of Eastern Finland, Kuopio, Finland, 2Heart Center, Kuopio University Hospital, Kuopio, Finland, 3Research unit of medical imaging, physics and technology, University of Oulu, Oulu, Finland, 4Department of diagnostic radiology, Oulu University Hospital, Oulu, Finland
Synopsis
We applied novel RAFFn relaxation times (TRAFF2 and TRAFF4), T1ρ and T2 to study effects of cardiac lymphatic system in myocardial infarct (MI). Infarct size based on the TRAFF4 relaxation time maps was significantly larger in earlier time points post MI in wild-type compared to lymphatic insufficient mice groups. No differences were found in relaxation times between groups. Area-of-overestimation (AOE) values remained stable in lymphatic insufficient group while in wild-type group a decreasing trend of AOE was observed. We conclude that effects of lymphatics after MI can be detected based on infarct size difference measured with different relaxation times.
Introduction
Longitudinal relaxation time in rotating frame (T1ρ) was suggested as contrast agent free alternation for late gadolinium enhancement and it has been related to later tissue remodeling i.e. granulation tissue formation and fibrosis1,2,3. However, measurement of T1ρ relaxation time suffers from relatively high specific absorption rate (SAR). One of the promising method to detect myocardial infarct (MI) without contrast agent and with lower SAR is relaxation along a fictitious field in nth rotating frame (RAFFn)4. RAFFn takes advantage of the fictitious magnetic field, which is produced by a fast sweep of the effective radio frequency field, to increase locking field strength without increasing SAR4. MI is detected as increased RAFFn relaxation times and infarct size based on RAFFn relaxation times is shown to be accurate and sensitive1. Therefore, we applied RAFFn relaxation times (TRAFF2 and TRAFF4), T1ρ and T2 to study effects of cardiac lymphatic system in MI. As a reference, left ventricular (LV) functional parameters were measured and findings were supported by histology.Methods
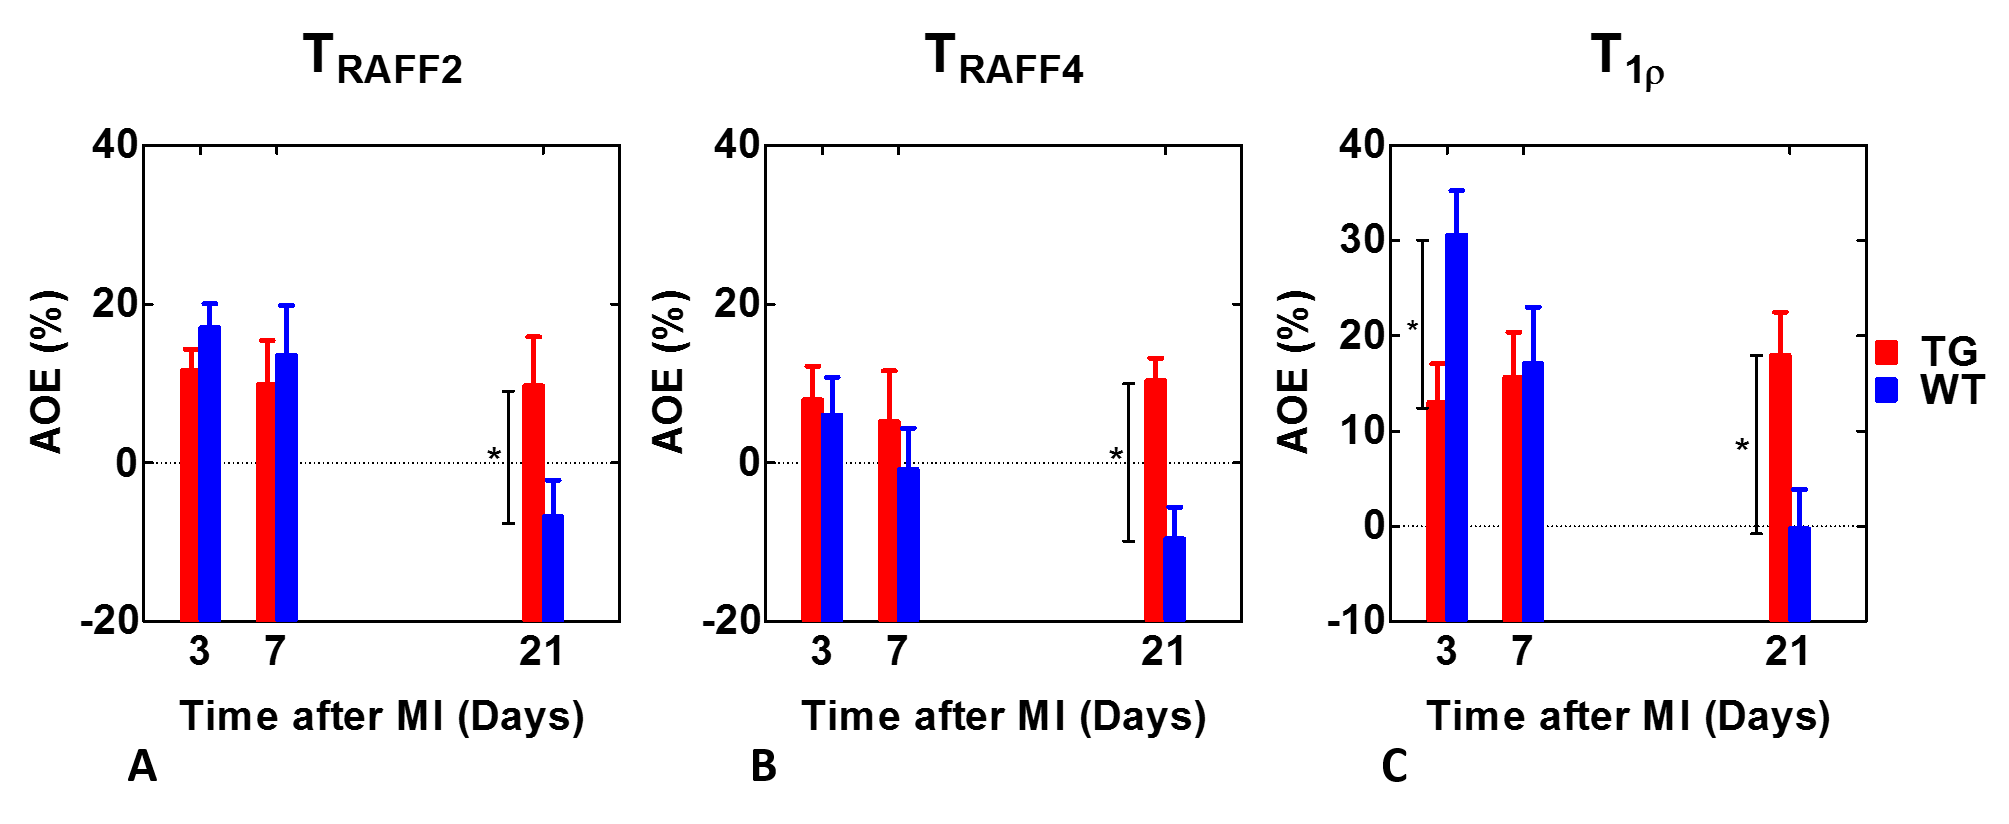
MI was induced to 13-17 week old female and male mice (n=20) by ligating the left anterior descending (LAD) artery. Mice included 10 transgenic (TG) sVEGFR3 expressing mice that display lymphatic insufficiency and 10 wild-type (WT) mice that served as a control group. Both groups were in atherosclerotic LDLR-/-/ApoB100/100 background. All experiments were done using 9.4 T magnet interfaced to Bruker BioSpec console at time points 3, 7 and 21 days after MI. RAFFn relaxation times TRAFF2 and TRAFF4 (RF powers: 1250Hz and 648Hz, respectively, pulse train lengths=0-36.2ms), adiabatic continuous wave T1ρ (pulse power 1250Hz, spin-lock durations 0-57ms), and T2 using double adiabatic Hahn echo (TE=0.05-14ms) were acquired at every time point. Data was acquired by fast imaging with steady state precession readout (TR=5ms, TE=2ms) after relaxation weighting1. Gradient echo cine (TR=8.0ms, TE=1.9ms, thickness=1.0mm, matrix=192x192, number of cine frames=10-12) were acquired to obtain cardiac functional parameters. Infarct size was calculated midline length-base method and the ratio of midline lengths of infarct area and the whole myocardium are reported. Area-of-overestimation (AOE) was determined by subtracting infarct areas based on TRAFF2, TRAFF4 and T1ρ from area based on T2.Results
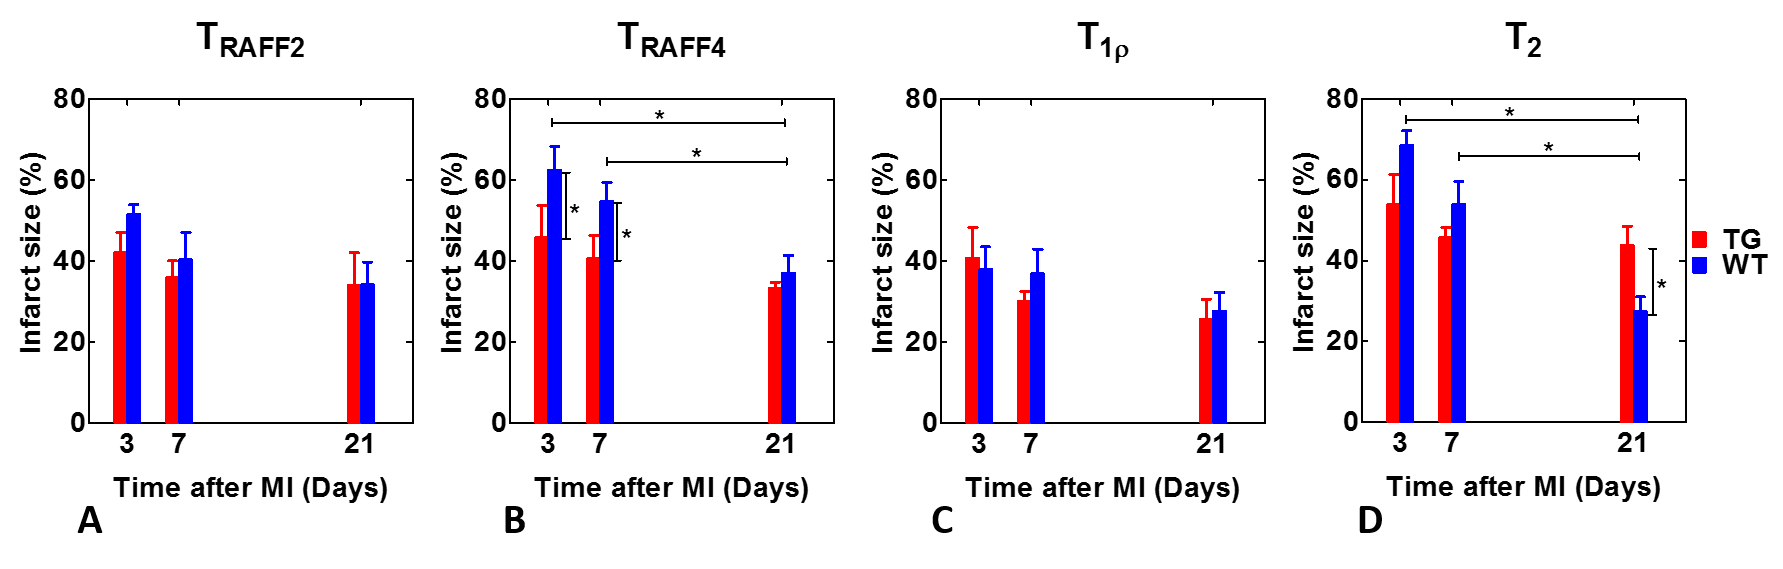
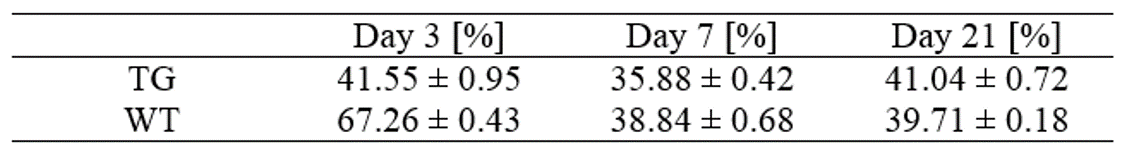
Infarct size based on the TRAFF4 relaxation time maps was significantly larger in time points 3 and 7 post MI in WT group compared to TG group (Figure 1B), while no differences were found in TRAFF2, T1ρ or T2 (Figure 1A,C,D) at those time points. Infarct size was significantly larger in T2 relaxation time map in TG group compared to WT group at the last time point and the interaction between the groups were significant as a function of time (Figure 1D). Infarct sizes based on cine images were generally larger including the limit of errors in WT than in TG group (Figure 3). AOE values remained stable in TG group while in WT group, a decreasing trend of AOE values as a function of time was observed (Figure 2). TRAFF2, TRAFF4, T1ρ and T2 relaxation times increased significantly (≈50% p<0.001) after MI in MI area compared to remote areas in both TG and WT groups. Slowly increasing stroke volume was observed in TG group as a function of time after MI, which caused ejection fraction to increase (from ≈50% to ≈55 %).
Discussion
Infarct sizes decreased based on TRAFF4 and T2 maps in WT group, while in TG group MI size remained close to constant. In WT group, the lymphatic vessel network is fully developed and it removes edema efficiently between days 3 and 21 after MI, while in TG group no clear change in edema was observed which is supported by lymphatic deficiency and lack of lymphangiogenesis of sVEGFR3 mice. Additionally, the analysis of cine images revealed that while infarct sizes were larger in WT than in TG group 3 days after MI, they were equalized at later time points. AOE values in TG group remained stable in TG and decreased in WT group when time elapsed which is supported by the significant difference (p<0.05) in interaction between TG and WT in infarct sizes. The relaxation times from MI and remote areas were in good agreement with our earlier findings1,5.Conclusion
Effects of lymphatics after myocardial infarct can be detected based on infarct size difference measured with different relaxation times.Acknowledgements
This study was supported by Finnish Academy Center of Excellence, Finnish Foundation for Cardiovascular Research, ERC Advanced Grant and Doctoral Programme of Molecular Medicine.References
1. Yla-Herttuala E et al. J Cardiovasc Magn Reson. 2018;7;20:34.
2. Mustafa HSN et al. Magn Reson Med 2013;69:1389-1395.
3. Witschey WR et al. J Cardivasc Magn Reson 2012;15:14-37.
4. Liimatainen T et al. Magn Reson Med 2015;73:254-262.
5. Vuorio T. et al. “Downregulation of VEGFR3 signaling alters cardiac lymphatic vessel organization and leads to a higher mortality after acute myocardial infarction” accepted for publication in Sci Rep. in 2018
Figures