2009
Automatic Detection and Quantification of Myocardial Scar in Patients with Prior Myocardial Infarction at 3T without Contrast Agents1Biomedical Imaging Research Institute, Cedars-Sinai Medical Center, Los Angeles, CA, United States, 2Department of Bioengineering, University of California, Los Angeles, Los Angeles, CA, United States, 3Department of Radiology, The First Affiliated Hospital of China Medical University, Shenyang, China, 4Institute of Digital Communications, University of Edinburgh, Edinburgh, United Kingdom
Synopsis
Native T1 maps at 3T has the capacity to accurately characterize chronic myocardial infarction (MI) territories, however it requires accurate identification of remote myocardium which in some cases is limited by image contrast between infarcted and remote myocardial territories. To overcome this limitation, we evaluated multiple automatic segmentation algorithms. Native T1 maps acquired in chronic MI patients were segmented using Gaussian Mixture Model, Otsu’s and K-means methods. K-means approach showed the best performance when compared to LGE. We conclude that K-means approach can accurately delineate MI territories.
Introduction
Recent studies have demonstrated that native T1 mapping at 3T can accurately characterize chronic myocardial infarction (MI) territories.1 In comparison to LGE, it has the key advantage of enabling the characterization of scarred myocardium without exposing patients to Gd-based contrast agents. To date however, this approach has relied on semi-automated approaches, where manual identification of remote territories is necessary.2,3 Given that T1-based changes at 3T between remote and scarred myocardium is typically an order of magnitude smaller in native T1 maps compared to LGE, accurate identification of remote myocardium is essential for reliable detection of scar from native T1 maps. An approach that could automatically segment the infarct scar in native T1 maps acquired at 3T with minimal reader interaction could be immensely valuable for advancing its translation in the clinical setting. To address this, we studied the capacity of multiple computer-aided segmentation algorithms on native T1 maps acquired at 3T acquired from patients with prior MI and validated the findings against a standard approach commonly used to characterize scar from LGE images.Methods
Patients (n=30) with prior MI were recruited according to the protocols approved by the Institutional Review Board at a median of 12.0 years after acute MI. Native T1 maps (MOLLI; 8 TIs with 2 inversion blocks of 3+5 images; minimum TI=110ms; TI=80ms; TR/TE=2.2/1.1ms) and Late Gadolinium Enhancement images (LGE; IR-prepared FLASH; TI optimized to null remote myocardium; TR/TE=3.5/1.75ms) were acquired with whole-heart coverage at 3T. Three automatic algorithms (Gaussian Mixture Model (GMM), Otsu’s and K-means) were evaluated and the results were compared to standard (semi-automated, mean + 5SD) LGE measurements on a whole heart basis. Linear regression and Bland-Altman analyses were used to compare the global infarct size. 16-segment AHA model was used to localize the infarct zones of the heart.Results
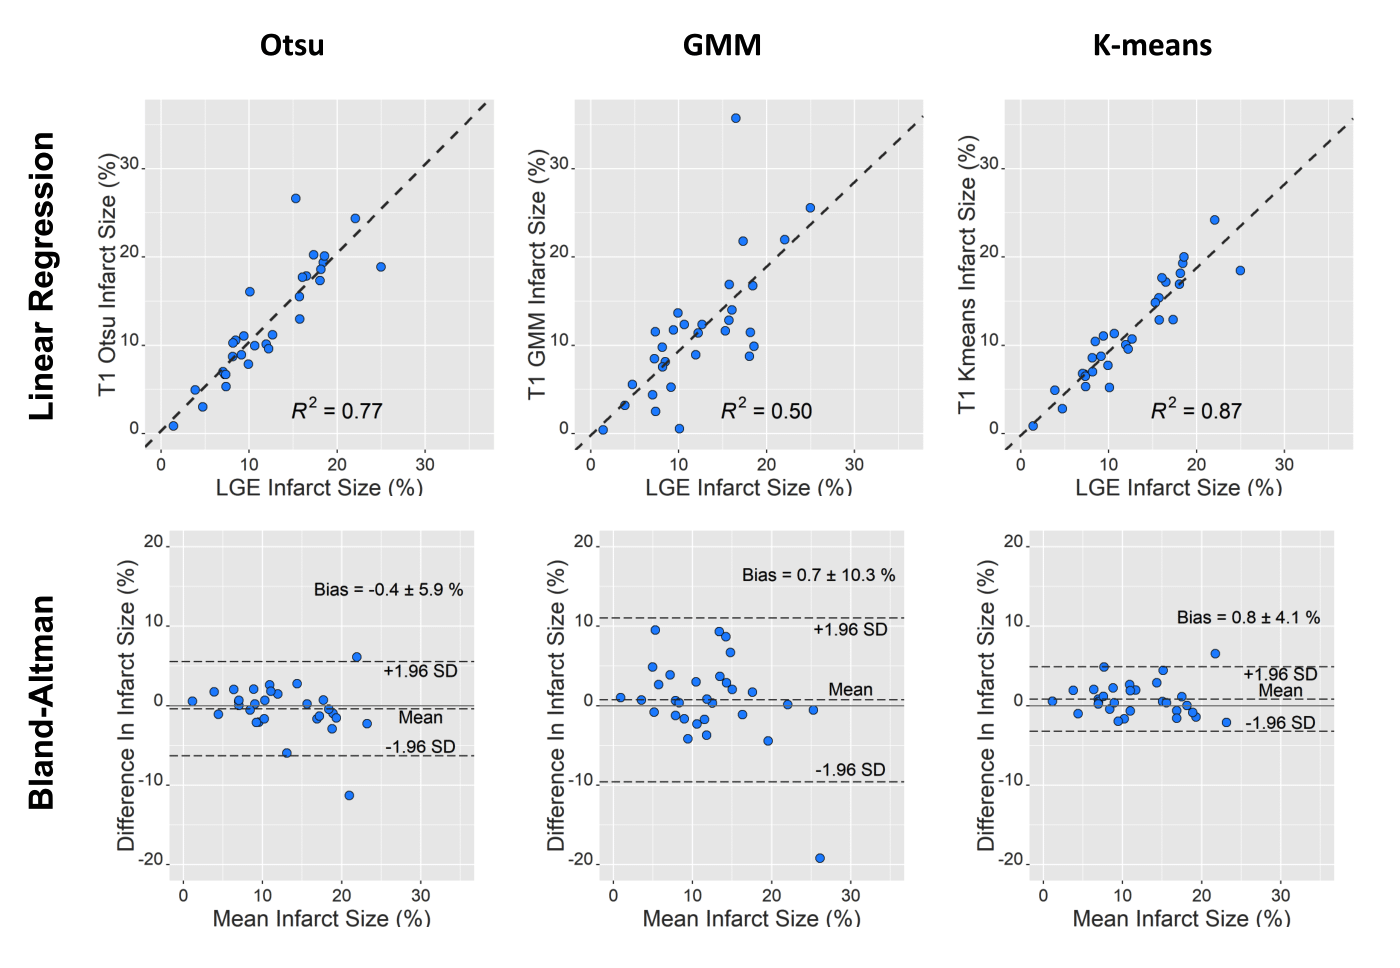
Fig. 1 shows representative segmentation results in a patient with chronic MI. As shown in AHA-segment, there is close correspondence between infarct zone identified on LGE (using mean+5SD approach) and K-means approach applied to native T1 maps. Other approaches (Otsu and GMM) applied to native T1 maps also showed spatially concordant segmentation of the infarct zones with LGE, albeit inferior to the K-means approach. Linear regression and Bland-Altman analysis of infarct sizes derived from native T1 maps using different algorithms and LGE are shown in Fig. 2. All algorithms showed significant correlation to the gold standard (all p<0.05). Among the methods studied, K-means approached showed the highest R2 (0.87), lowest bias (0.8%) and best limits of agreement when compared to the LGE segmentation.Conclusions
Our findings here support the notion that native T1 mapping at 3T, when combined with automated segmentation approaches, can accurately detect and quantify infarct scar with minimal input from the reader. If these findings can be extended in a larger cohort of patients, native T1 mapping at 3T could evolve into a clinically viable alternative to LGE for sizing infarct-related scar.Acknowledgements
This work was supported in part by NIH R01-HL136578.References
1. Kali A, Choi EY, Sharif B et al. Native T1 Mapping by 3-T CMR Imaging for Characterization of Chronic Myocardial Infarctions. JACC Cardiovasc Imaging. 2015 Sep;8(9):1019-1030.
2. Schulz-Menger J, Bluemke DA, Bremerich J et al. Standardized image interpretation and post processing in cardiovascular magnetic resonance: Society for Cardiovascular Magnetic Resonance (SCMR) board of trustees task force on standardized post processing. J Cardiovasc Magn Reson 2013;15:35.
3. Kali A, Cokic I, Tang RL, et al. Determination of location, size, and transmurality of chronic myocardial infarction without exogenous contrast media by using cardiac magnetic resonance imaging at 3 T. Circ Cardiovasc Imaging 2014 May; 7:471–81.
Figures