2007
Detection of myocardial iron overload with magnetic resonance by native T1 and T2* mapping using a segmental approach1Fondazione G. Monasterio CNR-Regione Toscana, Pisa, Italy, 2Presidio Ospedaliero ASL 5, Crotone, Italy, 3Ospedale “Santa Maria delle Croci”, Ravenna, Italy, 4Ospedale Civile “F. Ferrari”, Casarano (LE), Italy, 5Ospedale San Martino di Oristano, Oristano, Italy, 6Presidio Ospedaliero "Giovanni Paolo II" - Distretto AG2 di Sciacca, Sciacca (AG), Italy
Synopsis
T2* and T1 values assessed in the 16 myocardial segments showed a good agreement (90% concordance) in the identification of myocardial iron overload (MIO) in patients with hemoglobinopathies.
Introduction
T2* measurement of myocardial iron overload (MIO) is presently the gold standard for monitoring and tailoring the chelation in thalassemia patients1. Native T1 mapping has been proposed also for the MIO quantification because it is known that iron can reduce native T1 values2. No data are available in literature comparing T1 and T2* mapping using a segmental approach including the whole left ventricle.
The goal of our study was to assess the relationship between T1 and T2* values using a segmental approach.
Methods
54 patients with hemoglobinopathies (32 females, 41.31±15.31 years) enrolled in the Extension Myocardial Iron Overload in Thalassemia (eMIOT) Network were considered.
Native T1 and T2* images were acquired, respectively, with the Modified Look-Locker Inversion recovery (MOLLI) and with the multi-echo gradient-echo techniques3,4. Three parallel short-axis slices (basal, medium and apical) of the left ventricle (LV) were acquired with ECG-gating. The myocardial T1 and T2* distribution was mapped into a 16-segment LV model, according to the AHA/ACC model5. The lower limit of normal T1 for each segment was established as mean±2 standard deviations on data acquired on 14 healthy volunteers.
In 37 patients also post-contrastografic T1-mapping images were acquired.
Results
T1 images showed more pronounced motion artifacts and lower contrast-to-noise-ratio, determining the exclusion of 28/864 segments. No segments were excluded by T2* mapping. So, globally, 836 segmental T1 and T2* values were considered.
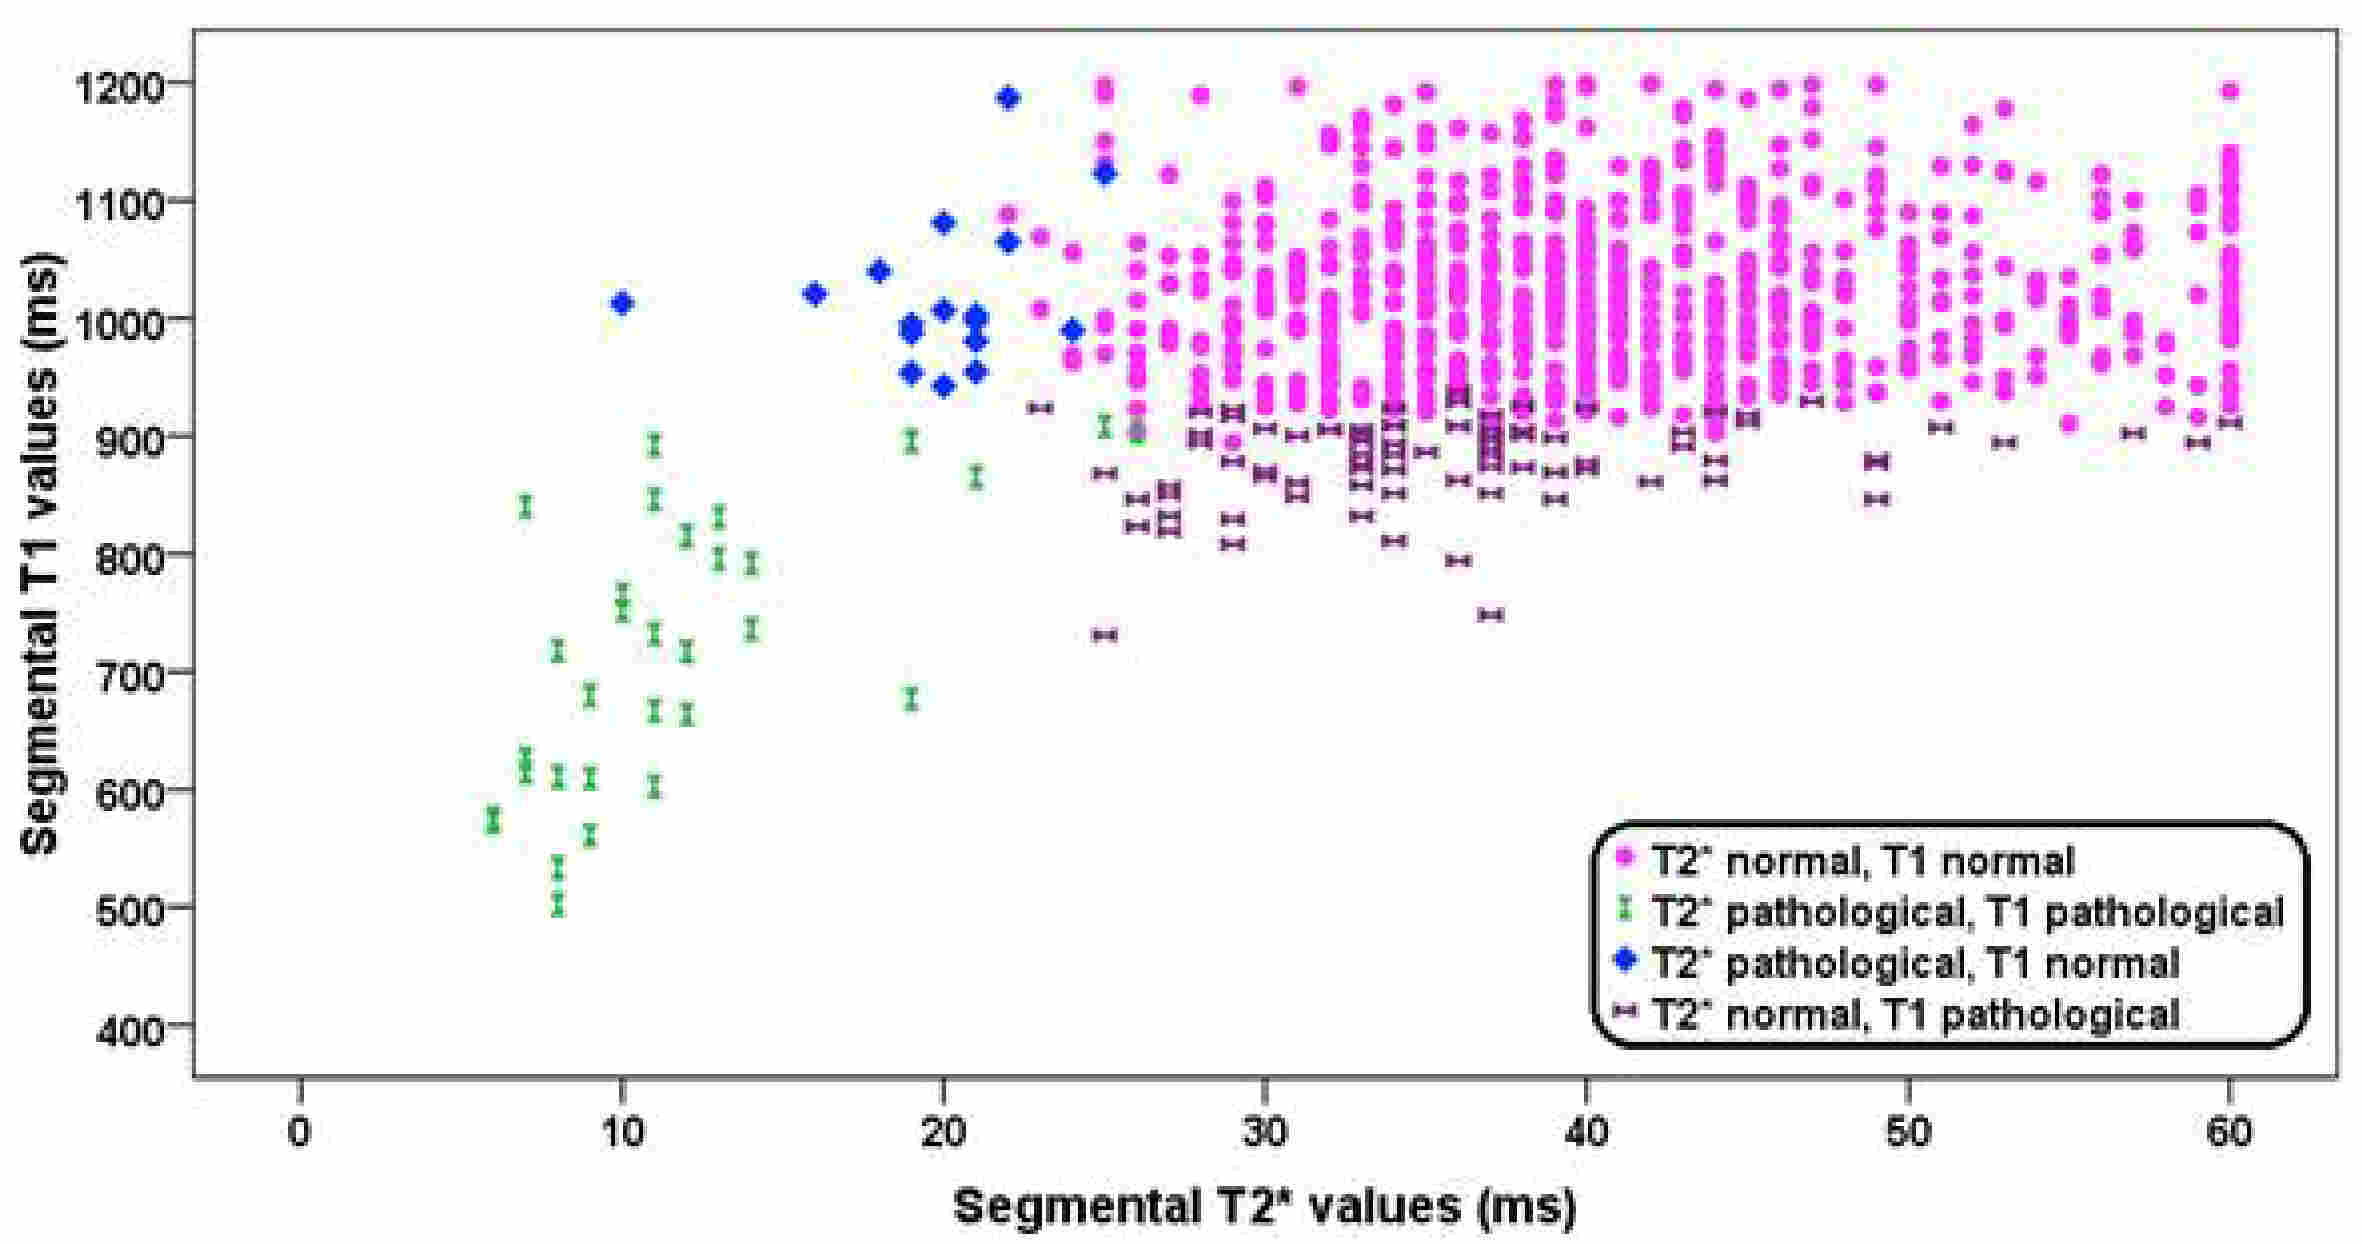
The mean of all segmental T2* and T1 values were, respectively, 38.57±10.57 ms and 998.48±97.37 ms. Normal T2* and T1 values were found in 704 segments (84.21%) while 31 (3.71%) segments had pathologic T2* and T1 values. For 84 segments (10.05%) (26 patients) a pathologic T1 value was detected in presence of a normal T2* value. For 17 segments (2.03%) a pathologic T2* value was detected in presence of a normal T1 value (Figure 1). Out of the 15 patients with pathologic T2* values in presence of normal T1, in 8 patients post-contrastografic images were acquired; in all segments with pathologic T2* value macroscopic fibrosis by late gadolinium enhancement technique and/or microscopic fibrosis by extracellular volume calculation were found. For patients with pathologic segmental T2* values there was a linear relationship between T1 and T2* values (R=0.776, P<0.0001).
Conclusions
T2* and T1 mapping showed a good correlation in identifying iron by a segmental approach, with 88% concordance. In 15 patients T1 mapping was not able to detect iron probably due to the presence of macroscopic and/or microscopic fibrosis that it is known to increase the native T1. Conversely, in 26 patients T1 mapping seemed to be more sensitive than T2*. Further studies on larger population and correlation with clinical outcome are needed.Acknowledgements
No acknowledgement found.References
1. Pennell DJ, Udelson JE, Arai AE, et al. Cardiovascular function and treatment in beta-thalassemia major: a consensus statement from the American Heart Association. Circulation 2013;128(3):281-308.
2. Sado DM, Maestrini V, Piechnik SK, et al. Noncontrast myocardial T1 mapping using cardiovascular magnetic resonance for iron overload. J Magn Reson Imaging 2015;41(6):1505-1511.
3. Messroghli DR, Radjenovic A, Kozerke S, Higgins DM, Sivananthan MU, Ridgway JP. Modified Look-Locker inversion recovery (MOLLI) for high-resolution T1 mapping of the heart. Magn Reson Med 2004;52(1):141-146.
4. Meloni A, Positano V, Pepe A, et al. Preferential patterns of myocardial iron overload by multislice multiecho T*2 CMR in thalassemia major patients. Magn Reson Med 2010;64(1):211-219.
5. Cerqueira MD, Weissman NJ, Dilsizian V, et al. Standardized myocardial segmentation and nomenclature for tomographic imaging of the heart: a statement for healthcare professionals from the Cardiac Imaging Committee of the Council on Clinical Cardiology of the American Heart Association. Circulation 2002;105(4 ):539-542.
Figures