2004
Imaging myocardial reperfusion injury using cardiac quantitative susceptibility mapping1Bioengineering, University of Pennsylvania, Philadelphia, PA, United States, 2Radiology, Perelman School of Medicine, University of Pennsylvania, Philadelphia, PA, United States, 3Biochemistry and Molecular Biophysics, University of Pennsylvania, Philadelphia, PA, United States, 4Surgery, Perelman School of Medicine, University of Pennsylvania, Philadelphia, PA, United States, 5Medicine, Perelman School of Medicine, Penn Presbyterian Medical Center, Philadelphia, PA, United States, 6Pediatrics, Children’s Hospital of Philadelphia, Philadelphia, PA, United States, 7Surgery, Columbia University, New York City, NY, United States
Synopsis
Hemorrhage is a frequent complication of reperfusion therapy for acute myocardial infarction (MI). This study investigated reperfusion injury with respect to the duration of myocardial ischemia by analyzing magnetic susceptibility, an endogenous imaging biomarker of tissue iron, in a large animal model. We demonstrate with cardiac quantitative susceptibility mapping (QSM), there is a significant shift in infarct tissue magnetic susceptibility with longer time-to-reperfusion and non-reperfused infarcts compared to remote myocardium which correlates with iron content and infarct pathophysiology.
Purpose:
Hemorrhagic reperfusion injury is a complication of reperfusion for acute myocardial infarction (MI) and is estimated to occur in 40-60% of patients1-3. While reperfusion substantially improves myocardial salvage, reperfusion injury could lead to adverse left ventricular remodeling, impaired function and increased risk of fatal arrhythmias1,4. Relaxation time (T1, T2, T2*) mapping has been used to image reperfusion injury5,6, but its specificity to iron and association with ischemia duration is uncertain. Cardiac quantitative susceptibility mapping (QSM), which uses the MR signal phase to quantify tissue magnetic susceptibility, may be a more specific marker of iron in hemorrhagic MI. The objective of this study was to analyze reperfusion injury with respect to the duration of myocardial ischemia using QSM and tissue iron content and to compare QSM to conventional cardiovascular magnetic resonance (CMR) imaging approaches.Methods:
MI was induced by coronary surgical ligation and released after 45 (N=3), 90 (N=5), 180 (N=5) minutes or permanent ligation (N=4) in male Yorkshire swine. LGE MRI was performed 7 days post-MI using 3D phase-sensitive inversion recovery segmented gradient echo at 3 T (Trio, Siemens Healthcare) followed by ex vivo multi-echo gradient-echo image acquisition of whole heart specimens at 0.2 mm3 isotropic resolution. Scan parameters include TR/TEfirst/TElast/ΔTE=42/3.3/38.5/3.2 ms, FA=16 degrees, FOV=23×23 cm2, BW=610 Hz/pixel. T2*-maps were obtained using a 3-parameter fit with least squares minimization. QSM images were reconstructed using the morphology-enabled dipole inversion image processing pipeline7-9. Three volumes-of-interest (VOIs) were obtained from T2*w images using threshold active contour segmentation (ITK-SNAP, University of Pennsylvania)10 including remote myocardium (“isointense”), infarct (“hyperintense”), infarct (“hypointense”). Validation of iron content and fibrosis includes histopathological staining (Prussian blue, Trichrome) of infarct tissue and iron concentration was quantified in adjacent slices by inductively coupled plasma-optical emission spectrometry (ICP-OES)3. Statistics included two-way analysis of variance pairwise comparisons between VOIs and reperfusion times, student’s t-test comparison between infarct and remote myocardium volumes for tissue susceptibility, T2* and iron concentration (results are reported as mean±SD, significance if P<0.05).Results:
Figure 1A displays the QSM and LGE results obtained from a 45-, 90-, 180-min reperfused and permanent MI animal groups. Infarct magnetic susceptibility showed a paramagnetic shift relative to remote myocardium (0.05± 0.03 vs. 0.003±0.02 ppm; P<0.01) (Figure 1B). This was associated with elevated infarct iron concentration (0.13± 0.11 vs. 0.04±0.02 mg/g; P<0.001) (Figure 1C). Histology (Figure 1D,E) shows extensive fibrosis with trichrome staining in both reperfused and permanent MI. Prussian blue stain of reperfused MI shows iron accumulation at the transition zone between necrotic myocytes and on the opposite side there is viable myocytes mixed with an active immune response suggesting an immune response originating outside the infarct core. Permanent MI showed less iron accumulation and localization at the periphery of the fibrotic infarct region indicating a difference in the immune response between permanent and reperfused MI.
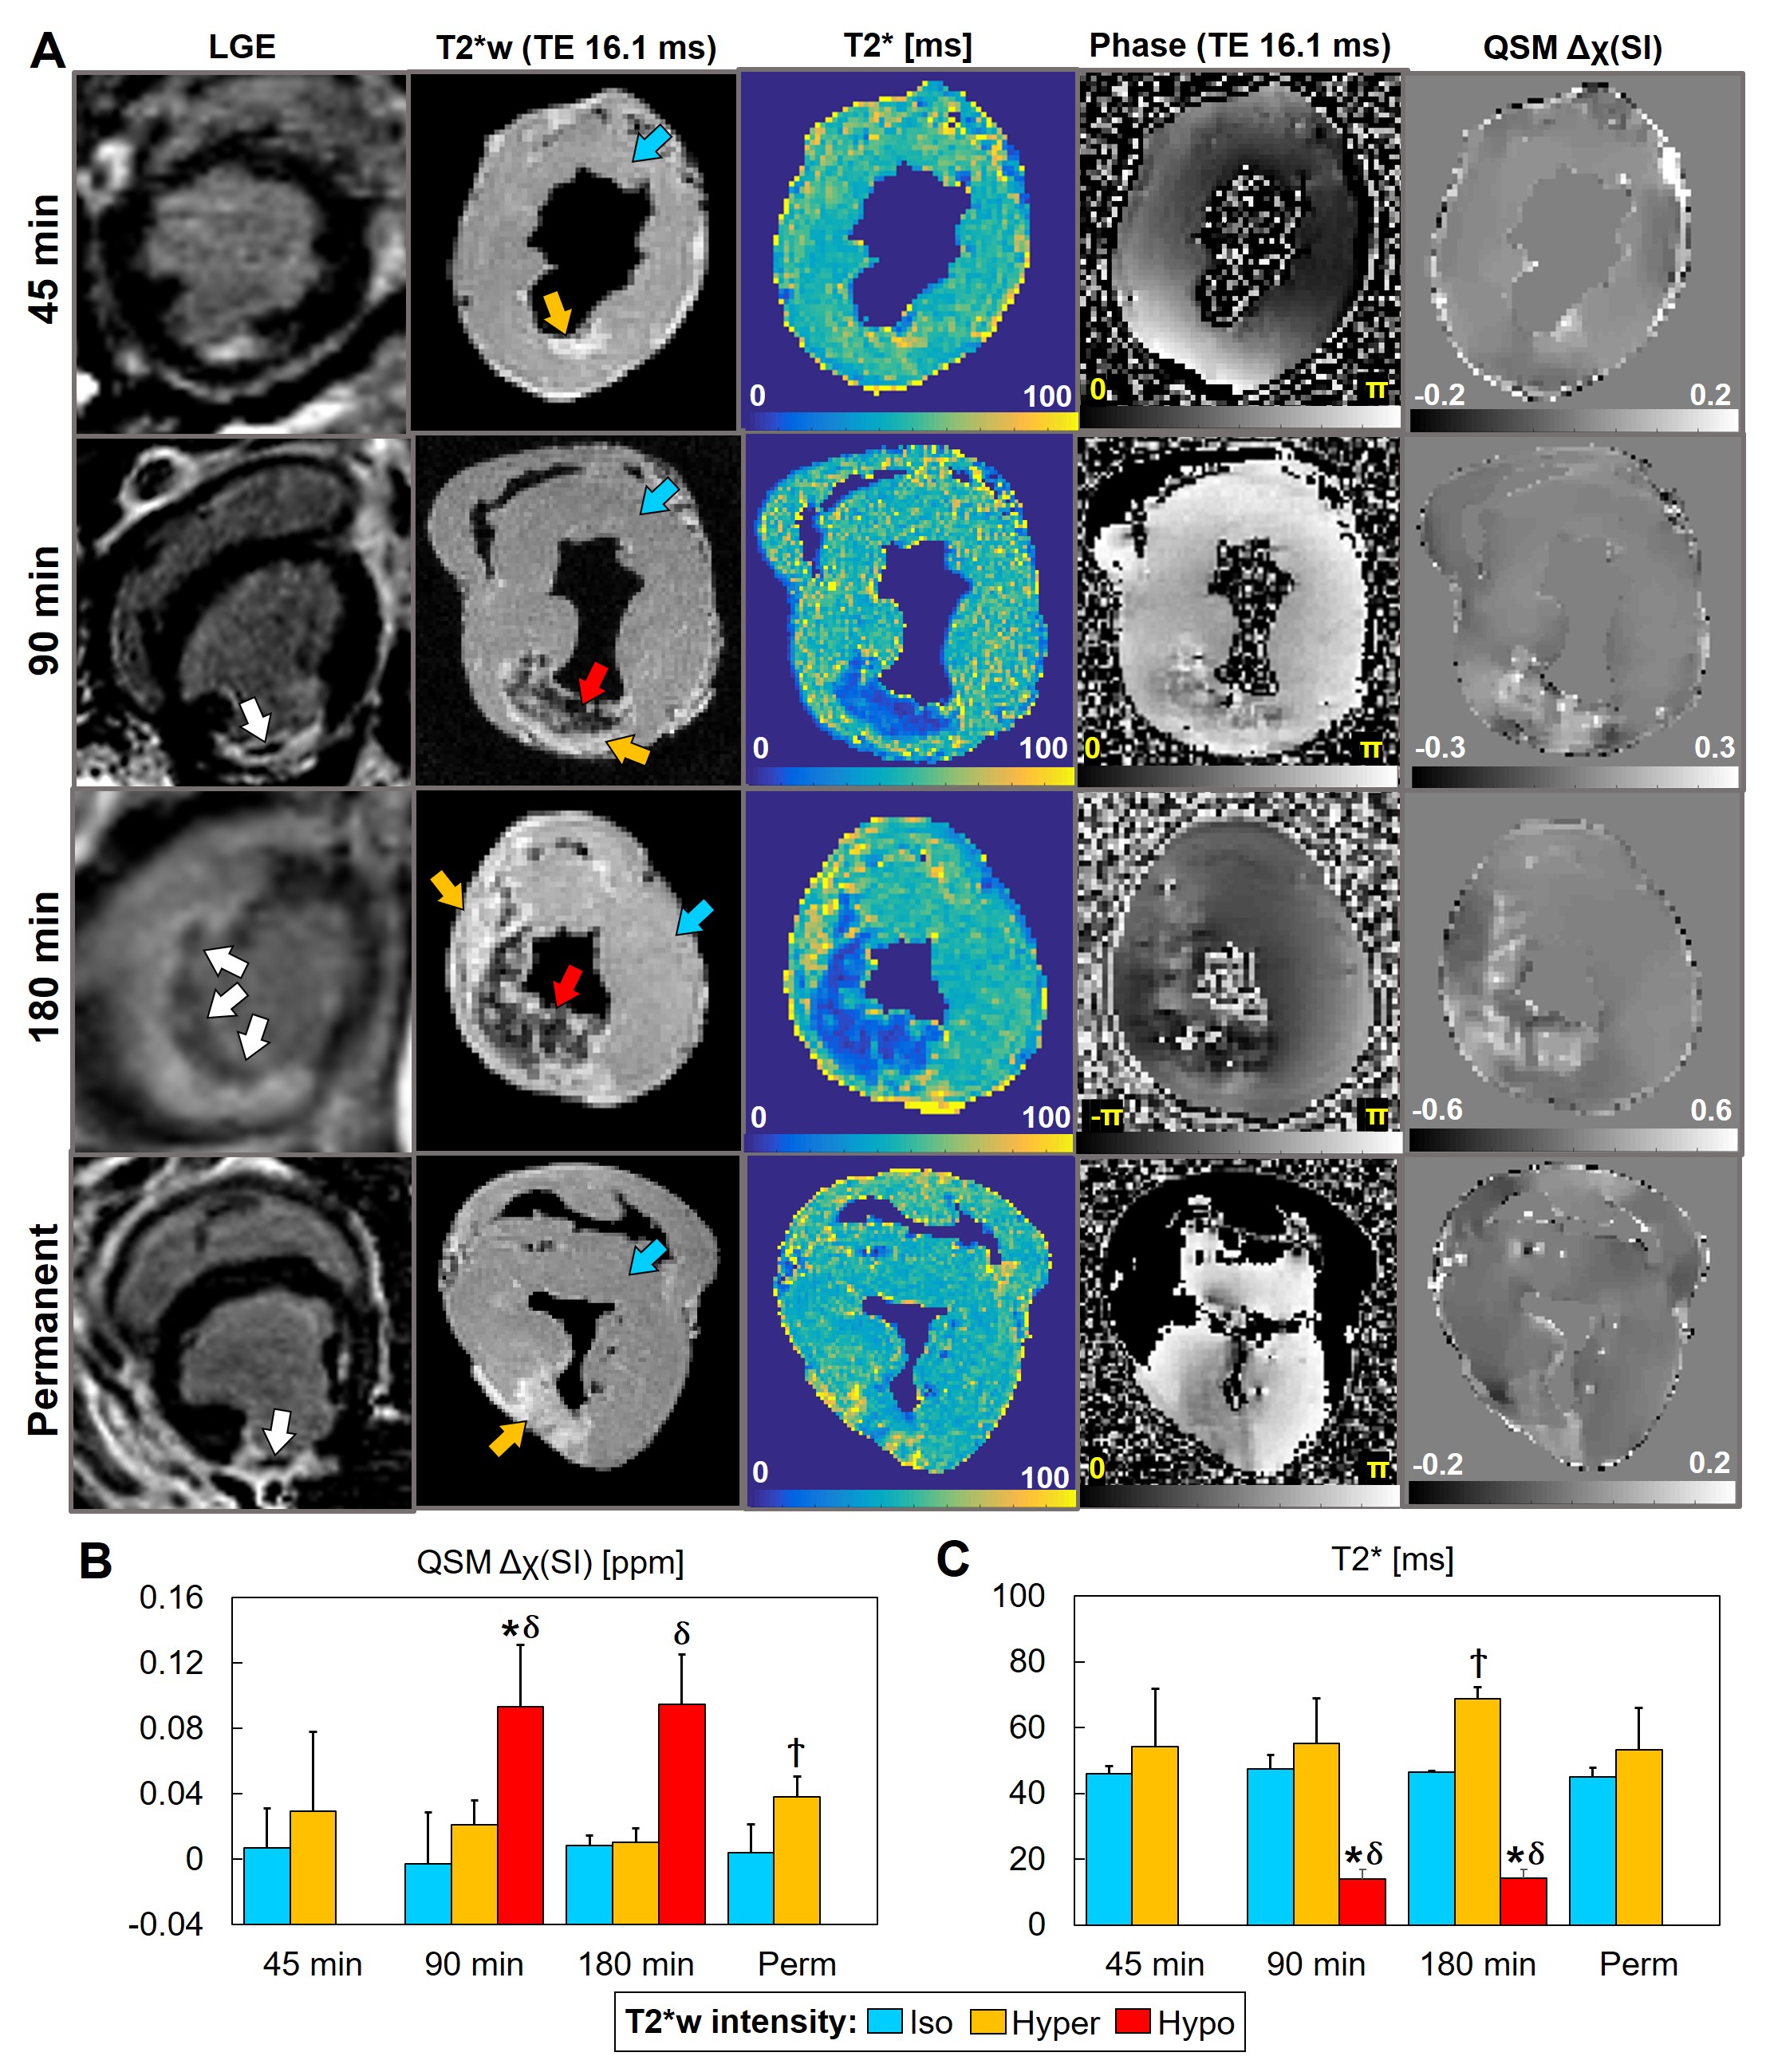
Figure 2A displays LGE, T2*-weighted (T2*w), T2*-maps, phase and QSM images of 45-, 90-, 180-min reperfused and permanent MI. T2*w images and T2*-maps showed hypointense regions after 90- and 180-min ischemia but not after 45-min or in permanently infarcted myocardium. Infarct magnetic susceptibility showed a significant paramagnetic shift in T2*w hypointense regions at 7 days after 90- and 180-min ischemia (Figure 2B). Despite the absence of T2*w hypointensity, permanent infarcts also showed a significant paramagnetic shift. As expected, hypointense regions correlated with a decrease in T2* relaxation times at 7 days after 90- and 180-min ischemia (Figure 2C). Unexpectedly, magnetic susceptibility, but not T2*, was significantly different within the infarct of the permanent MI group compared to the remote viable myocardium.
Discussion and Conclusion:
Infarct magnetic susceptibility correlates with tissue iron content, as previously discovered9. In addition, tissue magnetic susceptibility and iron content are affected by the duration of ischemia; animals with longer time-to-reperfusion (90- and 180-min) had the greatest magnetic susceptibility changes, increased infarct transmurality, and highest iron content indicating an increase in infarct severity. T2* hypointense regions were not observed in permanently infarcted animals, despite increased iron content and paramagnetic shift in magnetic susceptibility. While iron is known to reduce T2* in infarcted myocardium, T2* appears to elevate in the presence of edema and fibrosis5,6, where extensive fibrosis was present in both reperfused and permanent infarcts. To avoid confounding factors, post-MI patients require CMR scans specific to each element found in MI. In the clinic, QSM could be used to determine the severity of intramyocardial hemorrhage associated with reperfusion injury, targeted periprocedural therapy, risk stratification for aggressive pharmacologic treatment and monitoring of post-MI patients.Acknowledgements
We gratefully acknowledge support from R00-HL108157, R01-HL137984, NRSA in interdisciplinary Cardiovascular Biology NIH T32-HL007954, and HHMI-NIBIB Interfaces Program NIH T32-EB009384.References
1. Carrick D, et al. Myocardial Hemorrhage After Acute Reperfused ST-Segment-Elevation Myocardial Infarction: Relation to Microvascular Obstruction and Prognostic Significance. Circ Cardiovasc Imaging. 2016;9(1):e004148.
2. Carrick D, et al. Temporal Evolution of Myocardial Hemorrhage and Edema in Patients After Acute ST-Segment Elevation Myocardial Infarction: Pathophysiological Insights and Clinical Implications. J Am Heart Assoc. 2016;5(2).
3. Kali A, et al. Chronic manifestation of postreperfusion intramyocardial hemorrhage as regional iron deposition: a cardiovascular magnetic resonance study with ex vivo validation. Circ Cardiovasc Imaging. 2013;6(2):218-28.
4. Ganame J, et al. Impact of myocardial haemorrhage on left ventricular function and remodelling in patients with reperfused acute myocardial infarction. Eur Heart J. 2009;30(12):1440-9.
5. Lotan CS, et al. The effect of postinfarction intramyocardial hemorrhage on transverse relaxation time. Magn Reson Med. 1992;23(2):346-55.
6. Ghugre NR, et al. Quantitative tracking of edema, hemorrhage, and microvascular obstruction in subacute myocardial infarction in a porcine model by MRI. Magn Reson Med. 2011;66(4):1129-41.
7. Liu T, et al. A novel background field removal method for MRI using projection onto dipole fields (PDF). NMR Biomed. 2011;24(9):1129-36.
8. Liu T, et al. Morphology enabled dipole inversion (MEDI) from a single-angle acquisition: comparison with COSMOS in human brain imaging. Magn Reson Med. 2011;66(3):777-83.
9. Moon BF, et al. Magnetic susceptibility of hemorrhagic myocardial infarction: correlation with tissue iron and comparison with relaxation time MRI. in International Society for Magnetic Resonance in Medicine annual meeting. 2018. Paris, France.
10. Yushkevich PA, et al. User-guided 3D active contour segmentation of anatomical structures: significantly improved efficiency and reliability. Neuroimage. 2006;31(3):1116-28.
Figures