2003
3D Whole-heart High-resolution Motion Compensated Joint T1/T2 Mapping1School of Biomedical Engineering and Imaging Sciences, King's College London, London, United Kingdom, London, United Kingdom, 2Siemens Healthcare, London, United Kingdom
Synopsis
Tissue characterization including identification and quantification of fibrosis and oedema plays an important role in many myocardial diseases. Conventionally T1 and T2 maps are acquired sequentially under several breath-holds. These approaches however achieve limited spatial resolution and coverage. Furthermore, partial volume effects at water-fat interfaces may affect the T1 and T2 quantification. In this work, we propose a free-breathing high-resolution whole-heart joint T1 and T2 mapping sequence with Dixon encoding which provides co-registered 3D T1 and T2 maps and complementary 3D fat images.
Introduction
Tissue characterization including identification and quantification of fibrosis and oedema plays an important role in many myocardial diseases. Conventionally T1 and T2 maps are acquired sequentially under several breath-holds [1-2]. These approaches however achieve limited spatial resolution and coverage. In this work, we sought to develop a high-resolution 3D whole-heart motion compensated sequence for joint T1/T2 mapping and fat quantification. The feasibility of the proposed approach was tested in a standardized T1/T2 phantom and five healthy subjects in comparison to conventional 2D T1 and T2 mapping techniques.Methods
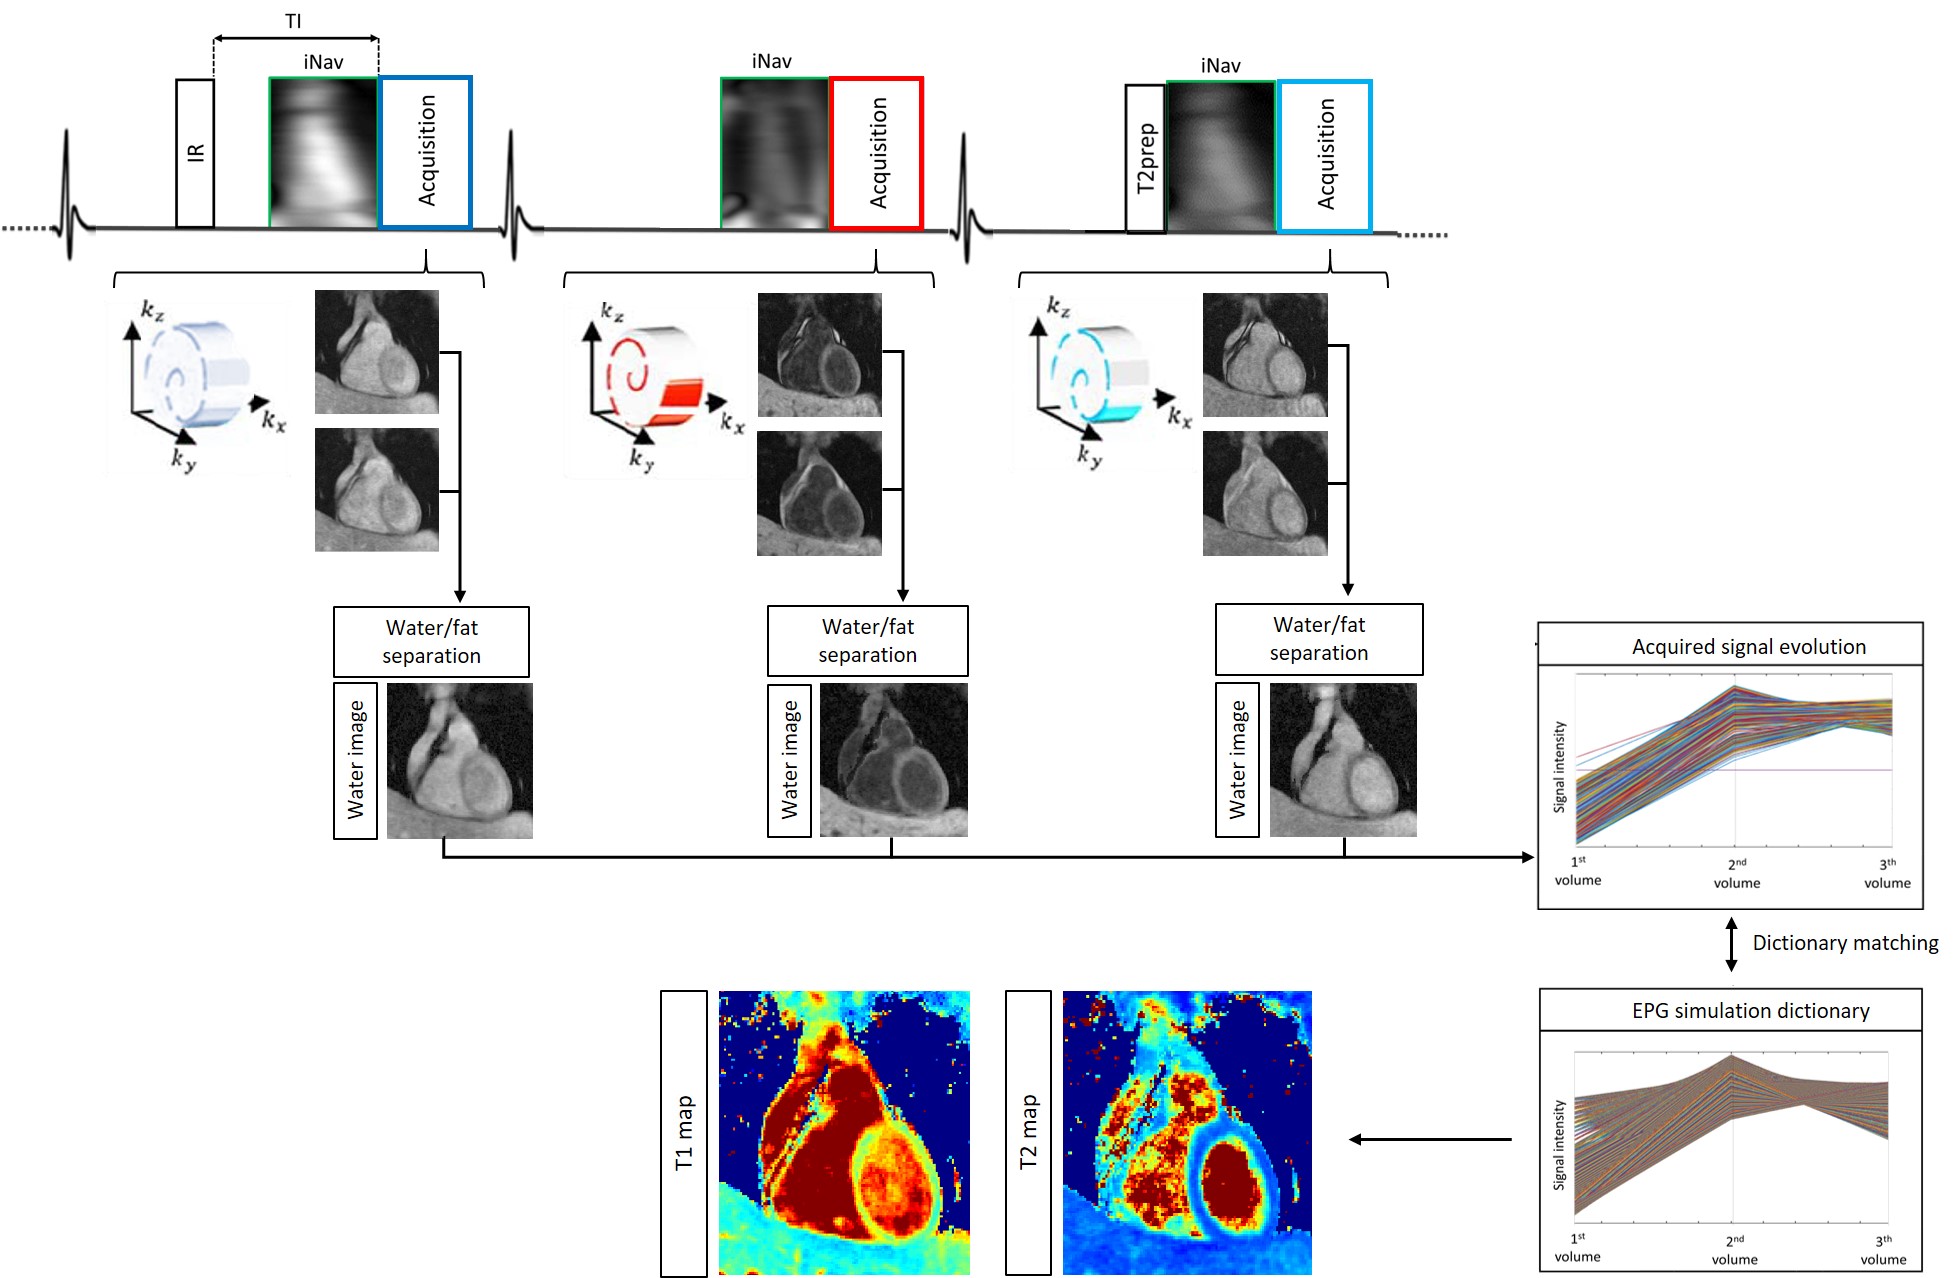
The framework of the proposed sequence is shown in Fig.1. Three interleaved 3D volumes are acquired with ECG-triggered two-point bipolar Dixon, spoiled gradient echo (GRE) readout and Variable Density Cartesian trajectory with spiral profile order and an undersampling factor of 4x [3-4]. The three datasets are acquired with 1) Inversion Recovery (IR) preparation, 2) no preparation and 3) T2 preparation pulse (T2prep). Low resolution 2D image navigators (iNAVs) [5] are acquired prior to imaging to estimate superior-inferior and left-right translational respiratory motion without data rejection. Translational motion correction is performed for each echo, and each undersampled volume is independently reconstructed with a 3D patch-based reconstruction method (3D-PROST) [4]. A water-fat separation algorithm [6] is used to generate fat and water images for each dataset and affine registration is exploited to co-register the water images. Finally, the 3D water images are normalized on a voxel-by-voxel basis in time to obtain the signal evolution across the three acquired volumes. Extended phase graph (EPG) simulations [7], matching the acquisition parameters, are carried out to generate a subject-specific dictionary. Quantitative T1 and T2 maps are generated by matching each measured signal evolution to the closest dictionary entry, corresponding to a T1/T2 pair.
Acquisition: A standardized T1/T2 phantom and five healthy subjects were scanned on a 1.5T scanner (Siemens Magnetom Aera, Erlangen, Germany) to validate the proposed prototype free-breathing sequence. Acquisition parameters included FA=8deg, resolution=1.4x1.4x2mm3, FOV=320x320x88-120mm3, 14 start-up echoes for iNAV acquisition, subject specific mid-diastolic trigger-delay and acquisition window of 93-107ms, TR/TE1/TE2=6.71/2.38/4.76ms, bandwidth=485Hz/pixel, T2prep=50ms, TI=120ms, total scan time=17.3±2.1min. Accuracy and precision of T1 and T2 quantification and heart rate dependency were investigated in phantom scans. Conventional 2D MOLLI T1 mapping and T2prep based 2D bSSFP T2 mapping sequences were acquired in 3 short axis views for comparison purposes. Both reference T1 and T2 mapping sequences were acquired with a spatial resolution of 1.8x1.8x8mm3 in a ~10sec breath-hold for each slice.
Results
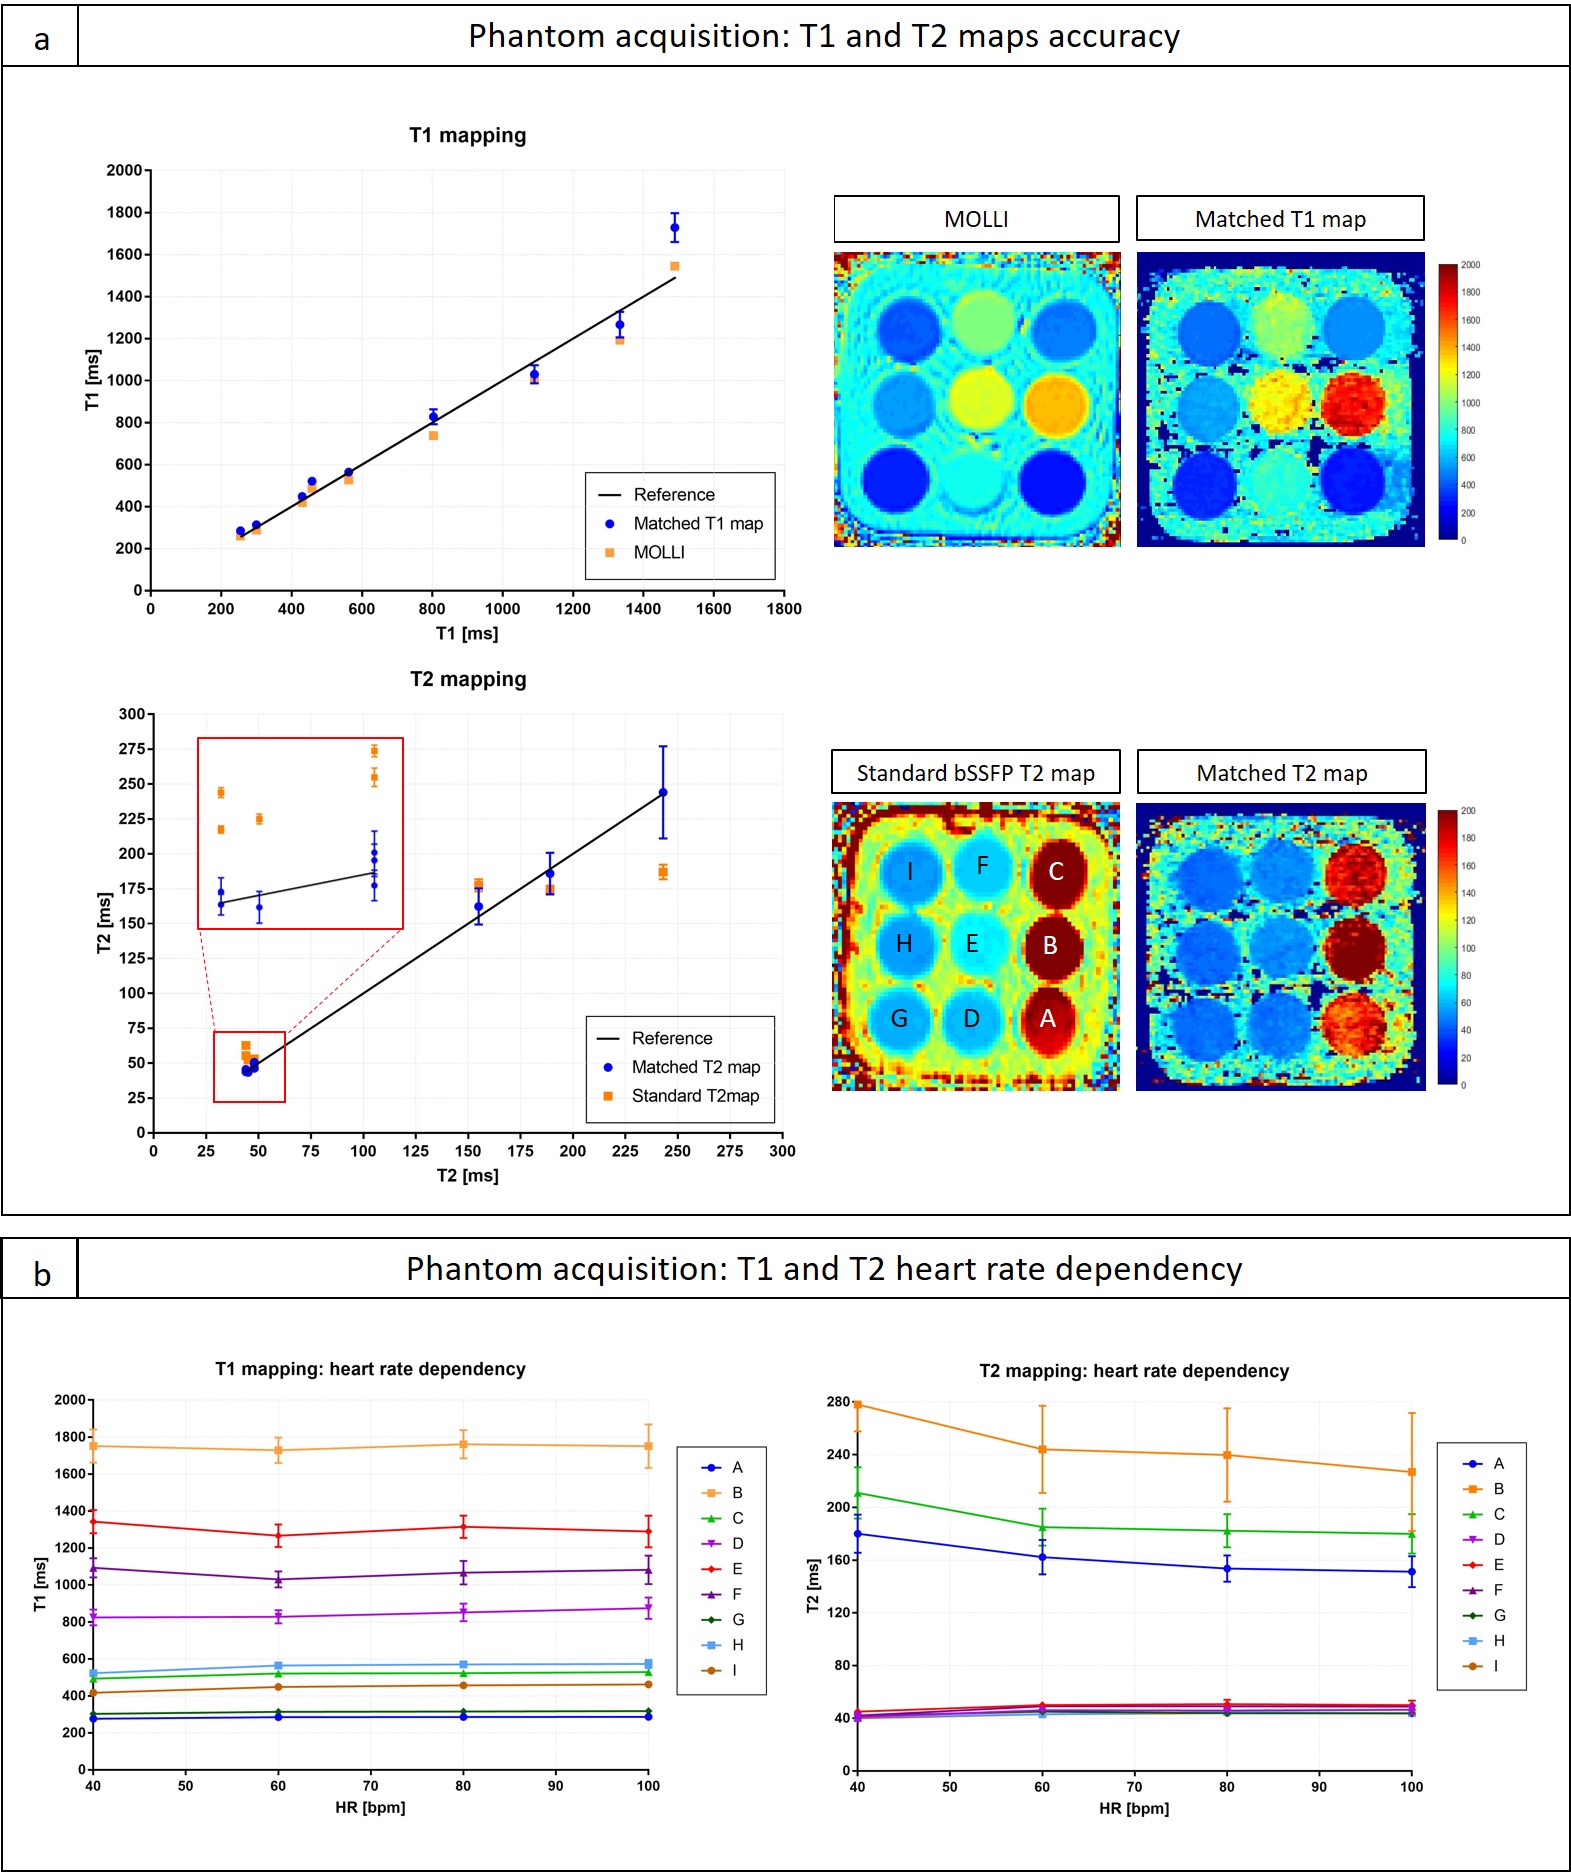
T1/T2 phantom: Good agreement was found between the proposed sequence and reference phantom values [8] for both T1 and T2 quantification (R2 = 0.968 and R2 = 0.998 respectively). The proposed approach showed better quantification of long T2 values compared to reference bSSFP T2 mapping, whereas similar T1 values were observed in comparison to the MOLLI acquisition, although a slight overestimation of T1 in vial B (T1=1489ms / T2=243ms corresponding to blood) was observed (Fig.2a). Fig.2b shows excellent heartrate insensitivity of the proposed sequence for T1 quantification for heart rates between 40 and 100bpm. For T2 quantification a slight overestimation for long T2 values (vials A, B and C corresponding to blood) was observed for slow heart rates and little heart rate dependency was observed for normal and high rates.
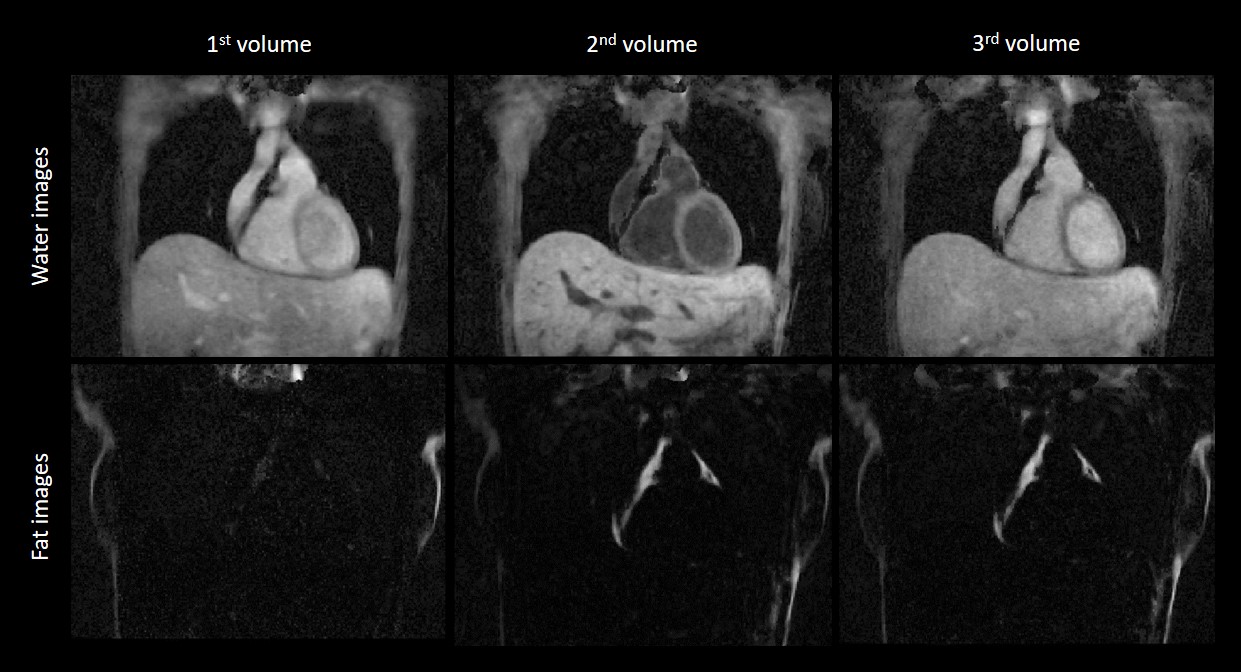
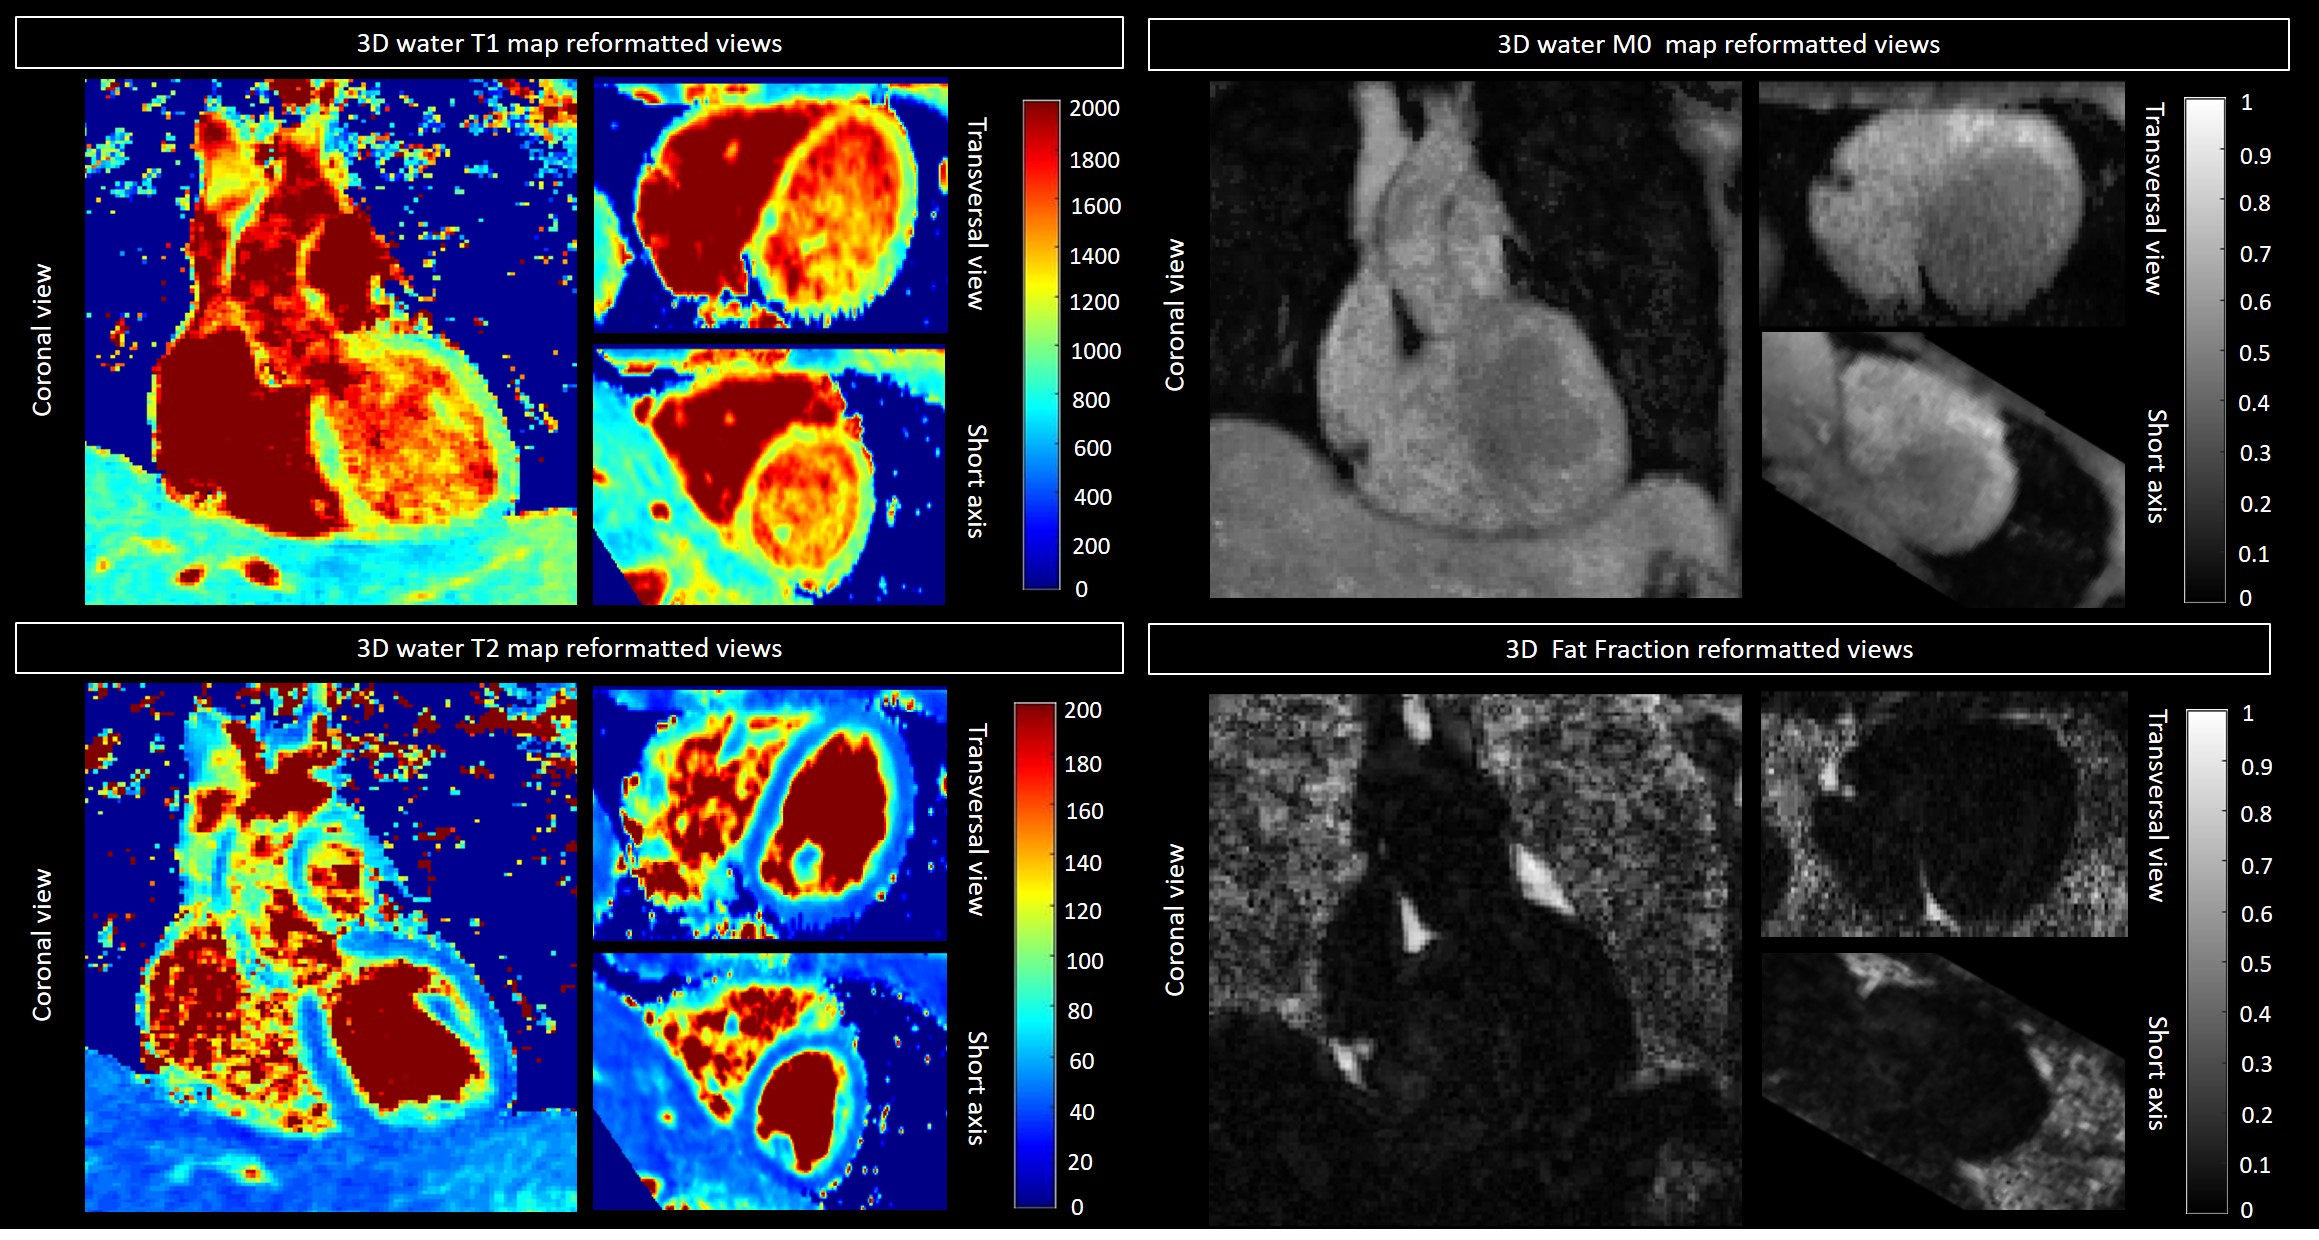
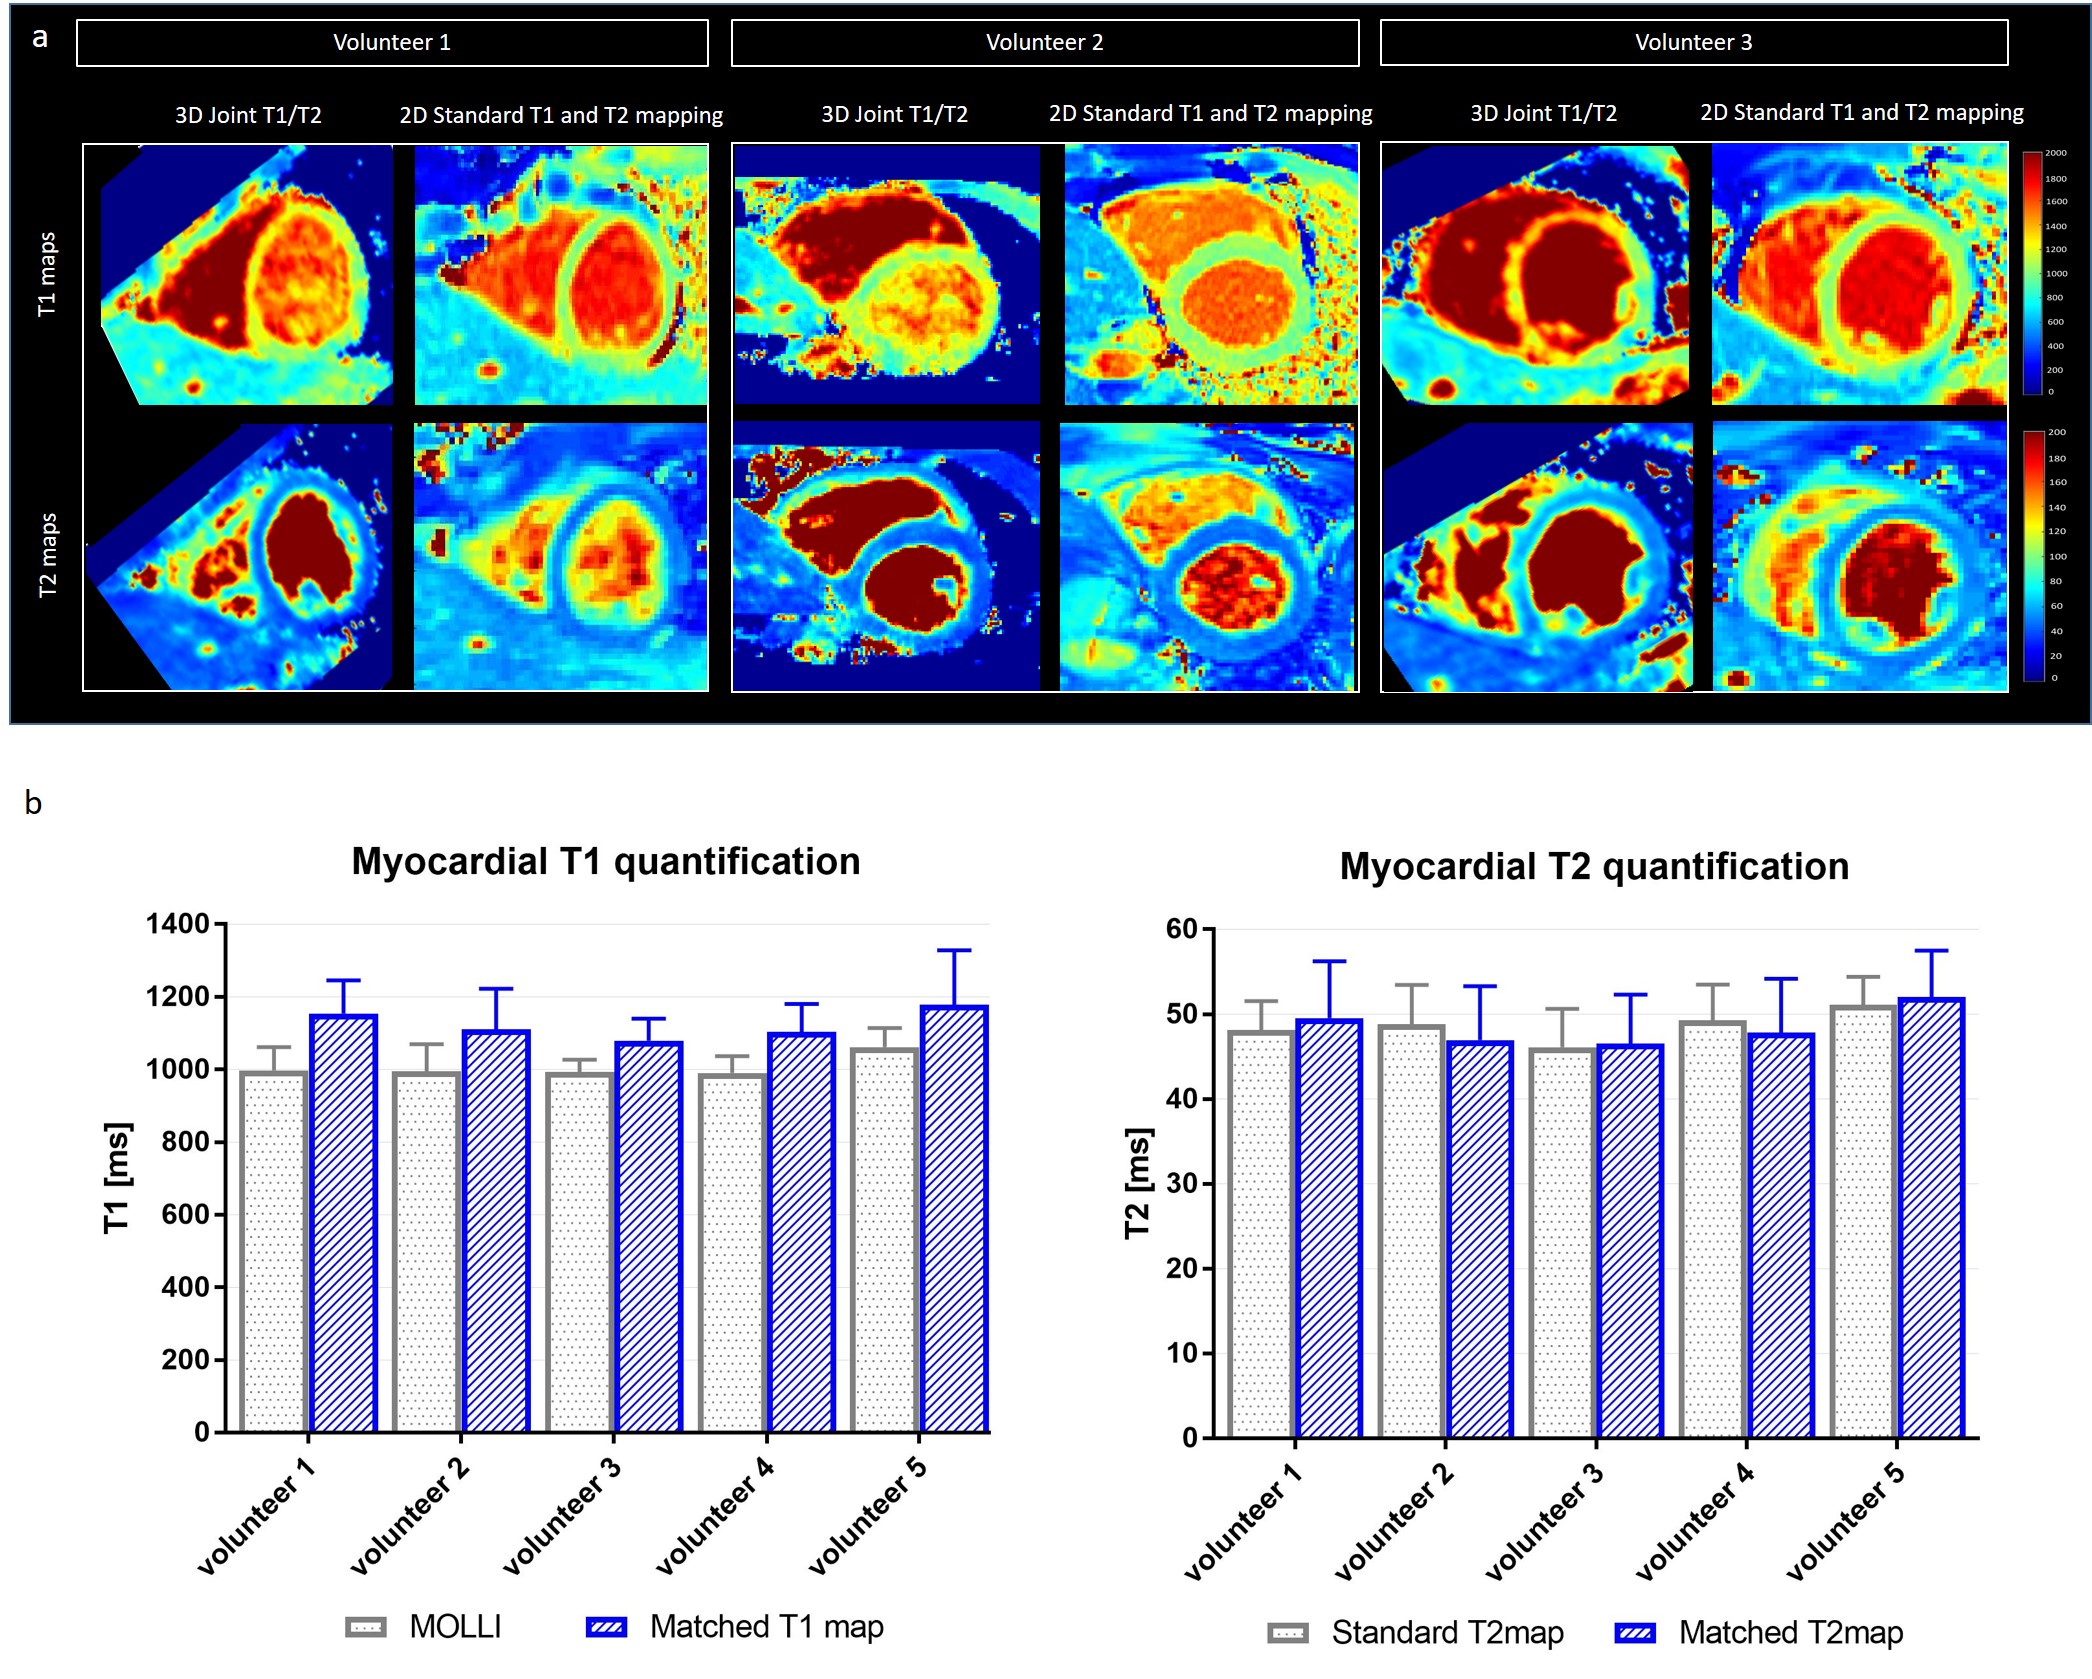
Healthy subjects: The translational motion corrected water and fat images for each acquired volume are shown in Fig.3. The first volume shows a significant underestimation of fat due to STIR fat suppression, however fat fraction could be estimated from the second and third heartbeat datasets. 3D water T1 and T2 maps, water M0 map and fat fraction reformatted in coronal, transversal and short axis views are shown in Fig.4 for one representative subject. Short-axis T1 and T2 maps reformatted from the proposed sequence and acquired with the reference 2D bSSFP and MOLLI are shown in Fig.5a for three representative healthy subjects. T2 quantification obtained with the proposed joint T1/T2 mapping sequence showed good agreement with the reference 2D bSSFP T2 mapping sequence, while an expected overestimation of myocardial T1 was observed with respect to the MOLLI sequence (Fig.5b), which is however in good agreement with literature values (T1myoc = 1100ms).
Conclusion
The proposed high resolution motion compensated joint T1/T2 sequence showed good agreement with reference T1 and T2 values in the T1/T2 phantom and good agreement with 2D MOLLI T1 mapping and 2D bSSFP T2 mapping in healthy subjects. Future work will focus on the reconstruction framework to obtain high resolution T1 and T2 maps in a clinically feasible scan time and validation in patients with cardiovascular disease.Acknowledgements
This work was supported by EPSRC (EP/L015226/1, EP/P001009/1, EP/P007619 and EP/P032311/1) and the Wellcome EPSRC Centre for Medical Engineering (NS/A000049/1).References
[1] D. R. Messroghli, A. Radjenovic, S. Kozerke, D. M. Higgins, M. U. Sivananthan, and J. P. Ridgway, “Modified Look-Locker inversion recovery (MOLLI) for high-resolutionT1 mapping of the heart,” Magn. Reson. Med., vol. 52, no. 1, pp. 141–146, Jul. 2004.
[2] P. Montant, M. Sigovan, D. Revel, and P. Douek, “MR imaging assessment of myocardial edema with T2 mapping,” Diagn. Interv. Imaging, vol. 96, no. 9, 2015.
[3] C. Prieto et al., “Highly efficient respiratory motion compensated free-breathing coronary MRA using golden-step Cartesian acquisition,” J. Magn. Reson. Imaging, vol. 41, no. 3, 2015.
[4] A. Bustin et al., “Five-minute whole-heart coronary MRA with sub-millimeter isotropic resolution, 100% respiratory scan efficiency, and 3D-PROST reconstruction,” Magn. Reson. Med., vol. 0, no. 0, Jul. 2018.
[5] M. Henningsson, P. Koken, C. Stehning, R. Razavi, C. Prieto, and R. M. Botnar, “Whole-heart coronary MR angiography with 2D self-navigated image reconstruction,” Magn. Reson. Med., vol. 67, no. 2, 2012.
[6] J. Liu, D. C. Peters, and M. Drangova, “Method of B0 mapping with magnitude-based correction for bipolar two-point Dixon cardiac MRI,” Magn. Reson. Med., vol. 78, no. 5, pp. 1862–1869, Dec. 2016.
[7] M. Weigel, “Extended phase graphs: Dephasing, RF pulses, and echoes - pure and simple,” J. Magn. Reson. Imaging, vol. 41, no. 2, pp. 266–295, Feb. 2015.
[8] G. Captur et al., “A medical device-grade T1 and ECV phantom for global T1 mapping quality assurance the T1 Mapping and ECV Standardization in cardiovascular magnetic resonance (T1MES) program,” J. Cardiovasc. Magn. Reson., vol. 18, no. 1, p. 58, Sep. 2016.
Figures