2002
3D whole-heart free-breathing BOOST-T2 mapping1School of Biomedical Engineering and Imaging Sciences, King's College London, London, United Kingdom, London, United Kingdom, 2Siemens Healthcare, London, United Kingdom
Synopsis
Cardiac MRI enables the assessment of whole-heart anatomy with both bright-and-black-blood contrasts. Additionally, quantitative myocardial T2 mapping is an emerging technique that enables non-contrast tissue characterization. However, conventional T2 mapping is performed under breath-hold with limited spatial resolution and coverage. Moreover, anatomic and quantitative images are acquired sequentially with different geometries and at different motion states. Here, we propose a novel quantitative 3D whole-heart sequence (qBOOST-T2) which provides co-registered 3D high-resolution bright-blood, black-blood and T2 map volumes from a single free-breathing scan. qBOOST-T2 was evaluated in a standardized T1/T2 phantom and healthy subjects and compared to current gold standard techniques.
Introduction
Cardiac MRI enables the assessment of whole-heart anatomy with both bright- and black-blood contrast. Quantitative myocardial T2 mapping is an emerging technique that enables non-contrast tissue characterization, with increased myocardial T2 values reported to correlate with oedema and myocardial inflammation. However, conventional T2 mapping is performed under several breath-holds with limited spatial resolution and coverage [1]. Moreover, anatomic and quantitative images are acquired sequentially with different geometries and at different motion states, further increasing scan time and requiring offline image registration thus further extending image analysis times. Here we propose a novel accelerated quantitative 3D whole-heart sequence (qBOOST-T2) which provides co-registered high-resolution 3D bright-blood, black-blood and T2 map volumes from a single free-breathing scan. This is achieved by extending the recent Bright-blood and black-blOOd phase SensiTive (BOOST) inversion recovery sequence [2] to also provide high-resolution 3D whole-heart T2 maps. Feasibility of qBOOST-T2 was investigated in a standardized T1/T2 phantom and six healthy subjects and compared to current gold standard techniques.Methods
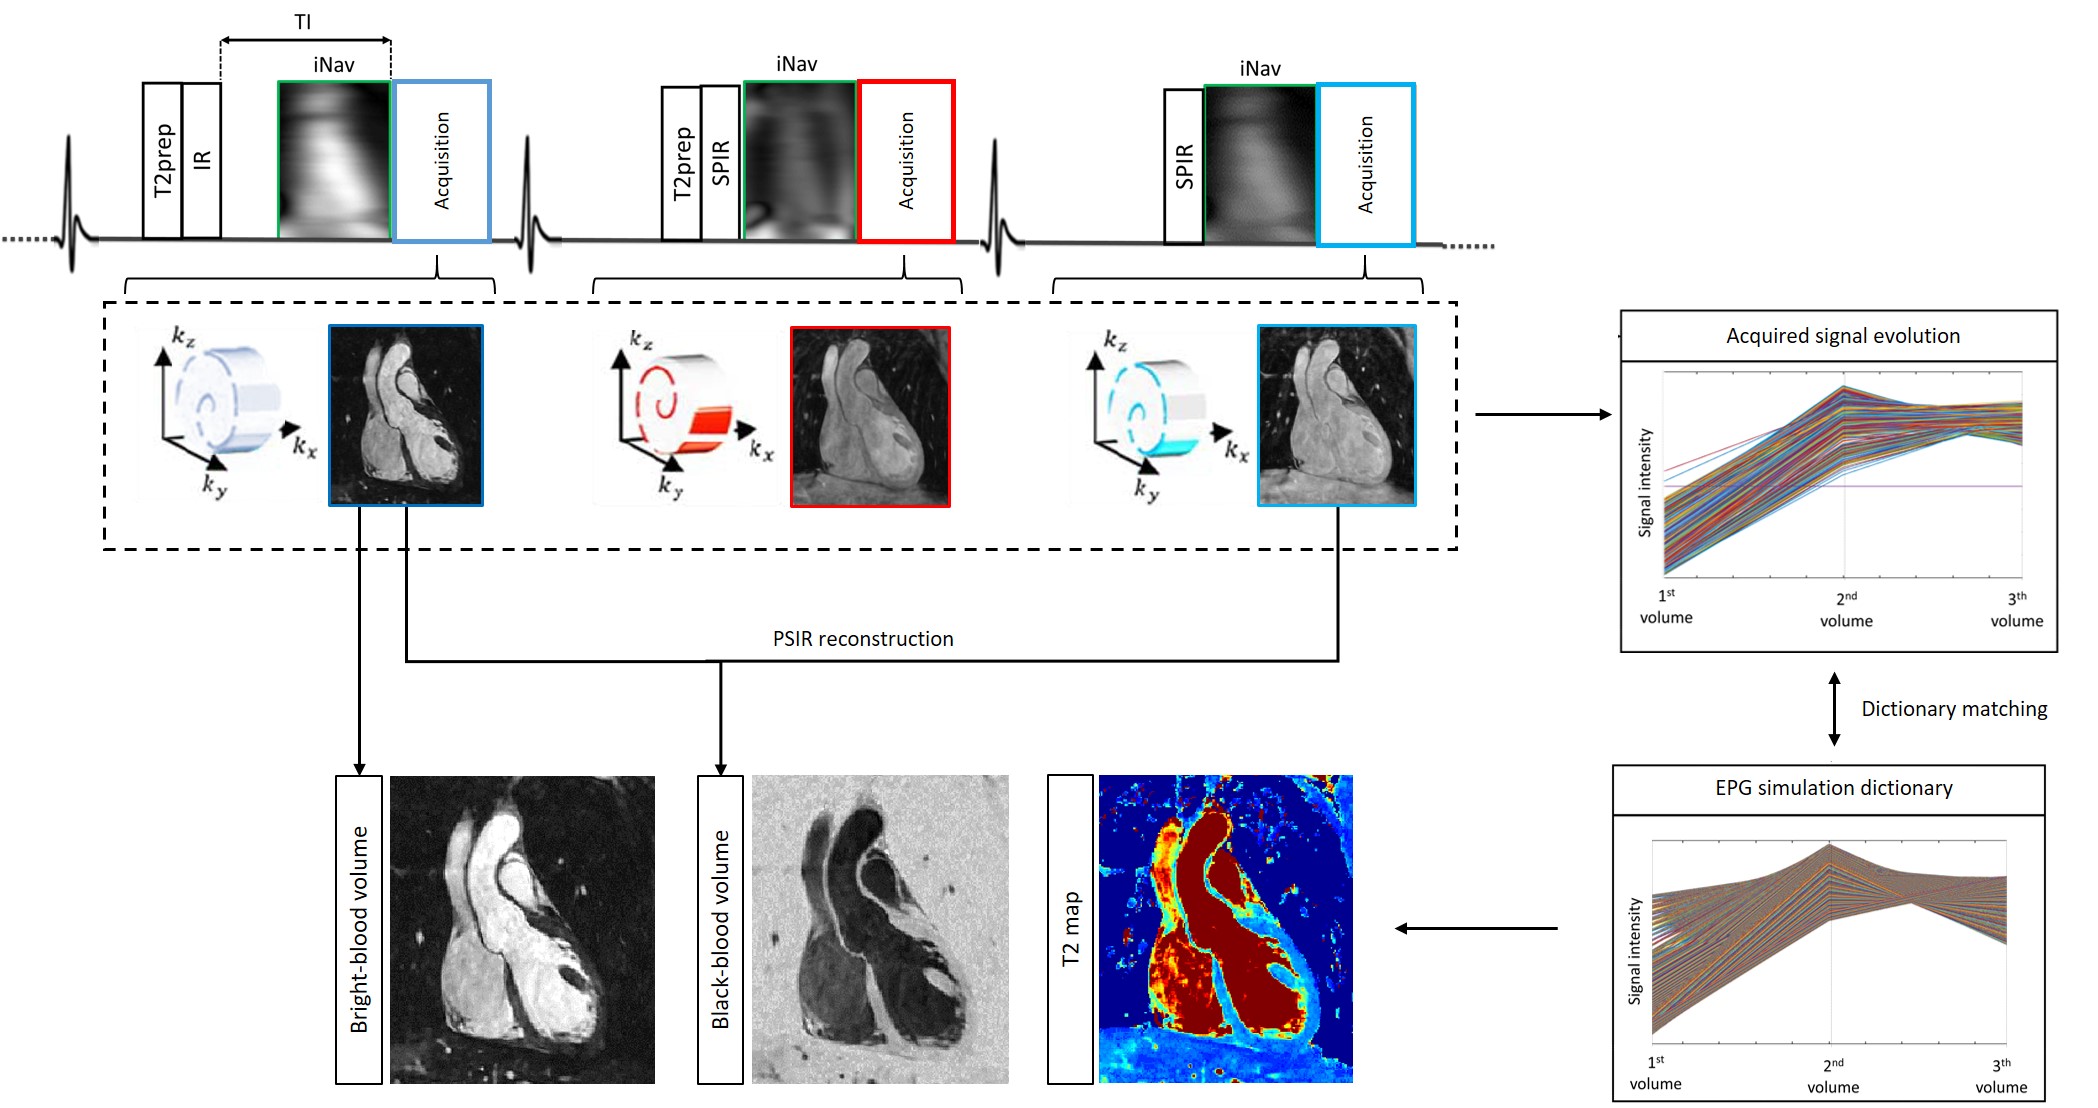
The framework of the proposed qBOOST-T2 sequence is shown in Fig.1. Three interleaved bSSFP bright-blood volumes are acquired with a Variable Density Cartesian trajectory with spiral profile order [3-4] and an undersampling factor of 4 allowing a total scan time of ~10min. A T2-prepared inversion recovery (T2prep-IR) module is applied prior to the first dataset acquisition. T2-preparation is performed prior to the second volume, whereas the third volume is acquired with no preparation. 2D low resolution image navigators (iNAVs) [5] are acquired prior to each image acquisition in order to estimate and correct for superior-inferior and left-right translational respiratory motion, enabling 100% respiratory scan efficiency. Each 4x undersampled 3D volume is independently reconstructed with a 3D patch-based reconstruction (3D-PROST) [4]. A voxel-wise time normalization is performed to obtain the signal evolution of each voxel through the three motion corrected volumes. EPG simulations [6], matching the acquisition parameters, are carried out to generate a subject-specific signal evolution dictionary. Quantitative T2 maps are generated by matching each measured signal evolution to the closest dictionary entry.
Acquisition: T1/T2 phantom and six healthy subjects were scanned on a 1.5T scanner (Siemens Magnetom Aera, Erlangen, Germany). 3D qBOOST-T2 acquisition parameters included flip-angle=90deg, resolution=1x1x2mm3, FOV=320x320x88-120mm3, 14 start-up echoes for iNAV, subject specific diastolic trigger-delay and acquisition window (90-104ms), T2prep1st-heartbeat=50ms, T2prep2nd-heartbeat=30ms, TI=110ms and total scan time=9±1.6min. A conventional 3 slices breath-hold 2D-bSSFP T2 map (TEs=[0,28,55]ms, resolution=1.8x1.8x8mm and acquisition time of ~10s per breath-hold) and a 3D fully sampled bright-blood T2-prepared (40ms) coronary magnetic resonance angiography (CMRA) sequence (scan time of ~9min) with imaging parameters matching that of qBOOST-T2 were acquired in-vivo for comparison purposes.
Results
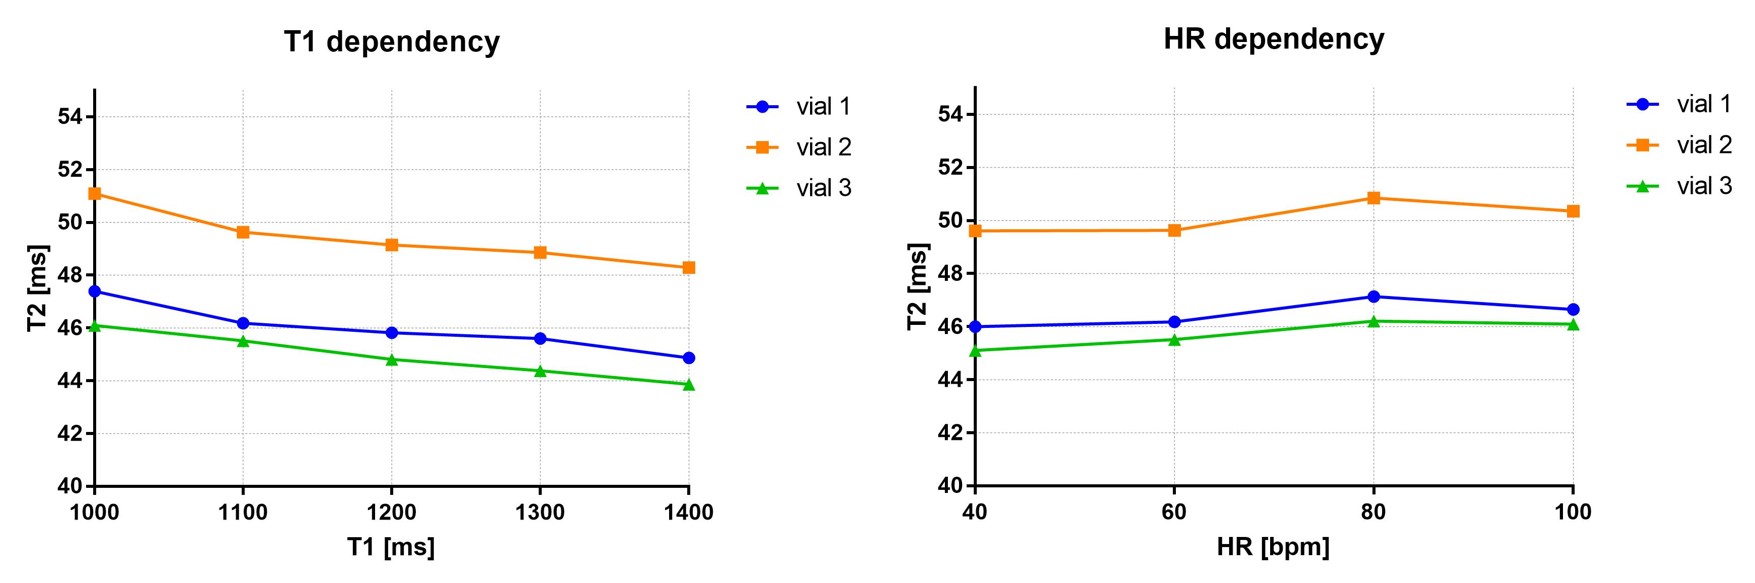
Phantom: Good agreement was found between T2 quantification with the proposed sequence, standard 2D T2 mapping and phantom reference values. The proposed approach quantified a T2 value of 47±1ms, 50±1ms, and 46±1ms for the three different myocardium vials, whereas standard T2 map resulted in T2 = 47±1ms, 47±1ms and 50±1ms, respectively with reference value being T1/T2= 1090/48ms, 1333/50ms, 803/48ms respectively [7]. T1 and heartrate (HR) variability of the proposed approach are shown in Fig.2. A T2 variability of ~2ms was observed for a relevant T1 range of 1000-1400ms, whereas a T2 increment of only 1ms was observed for HR ranging between 40 and 100bpm.
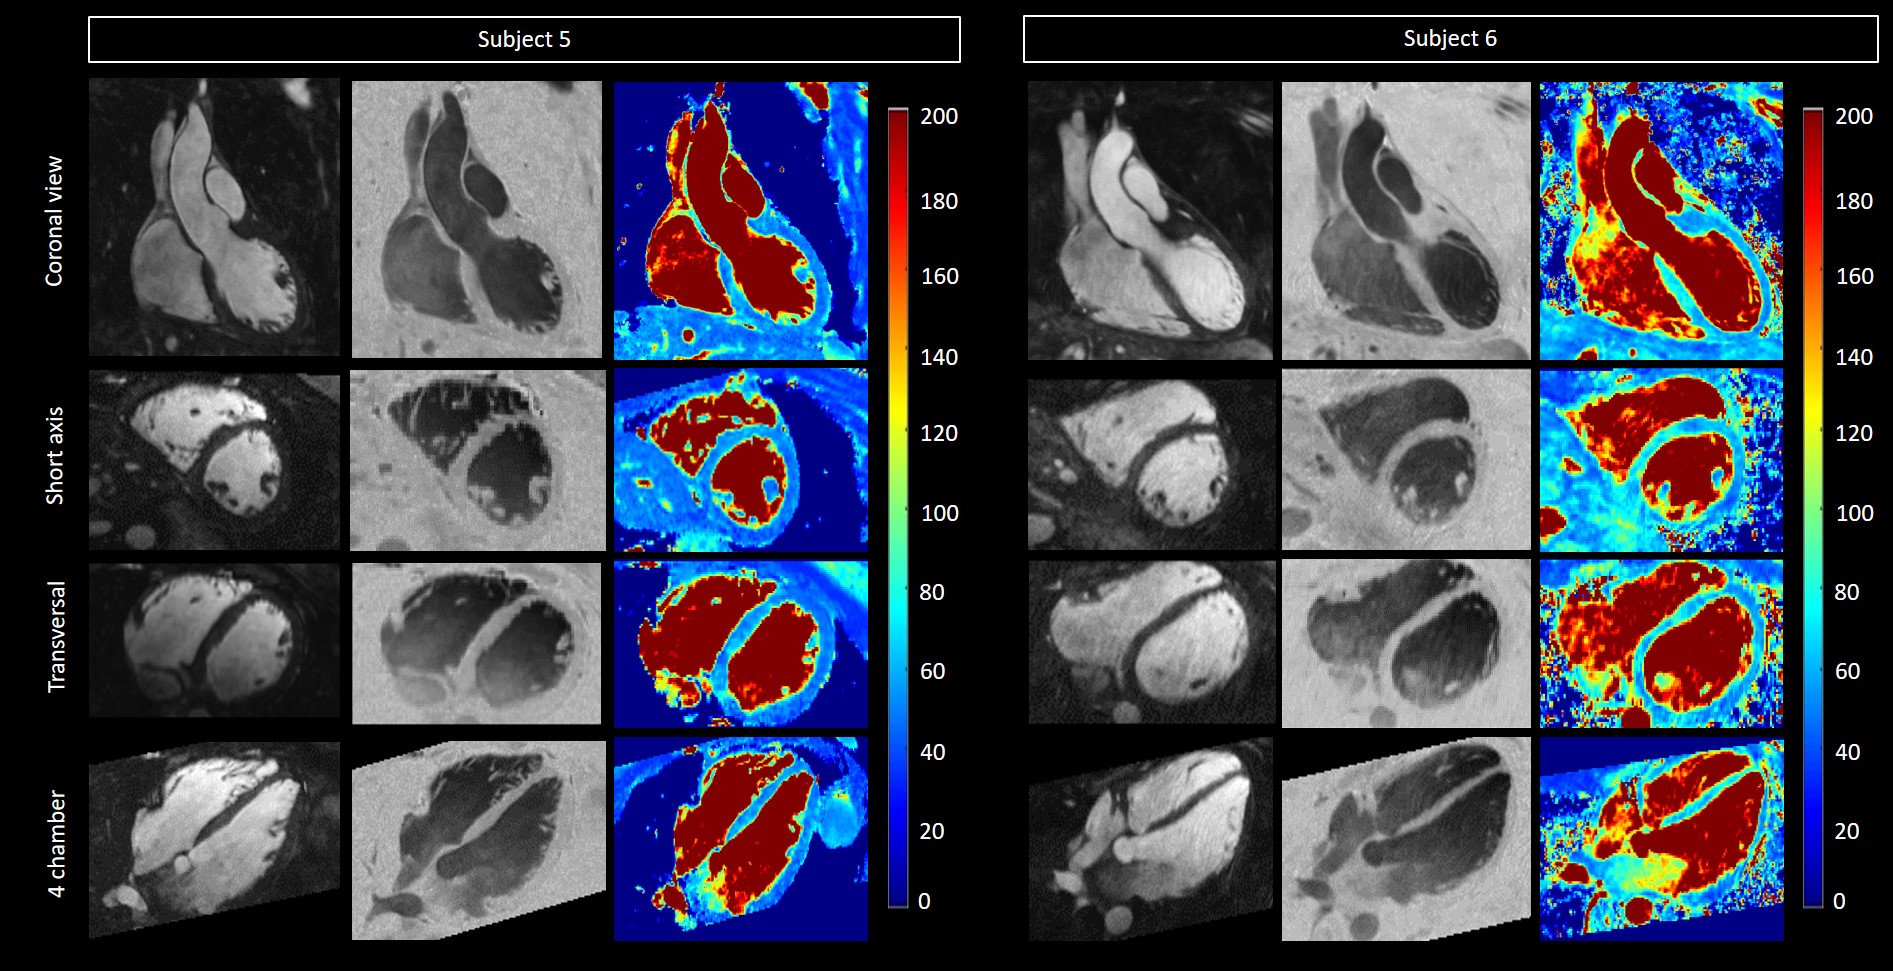
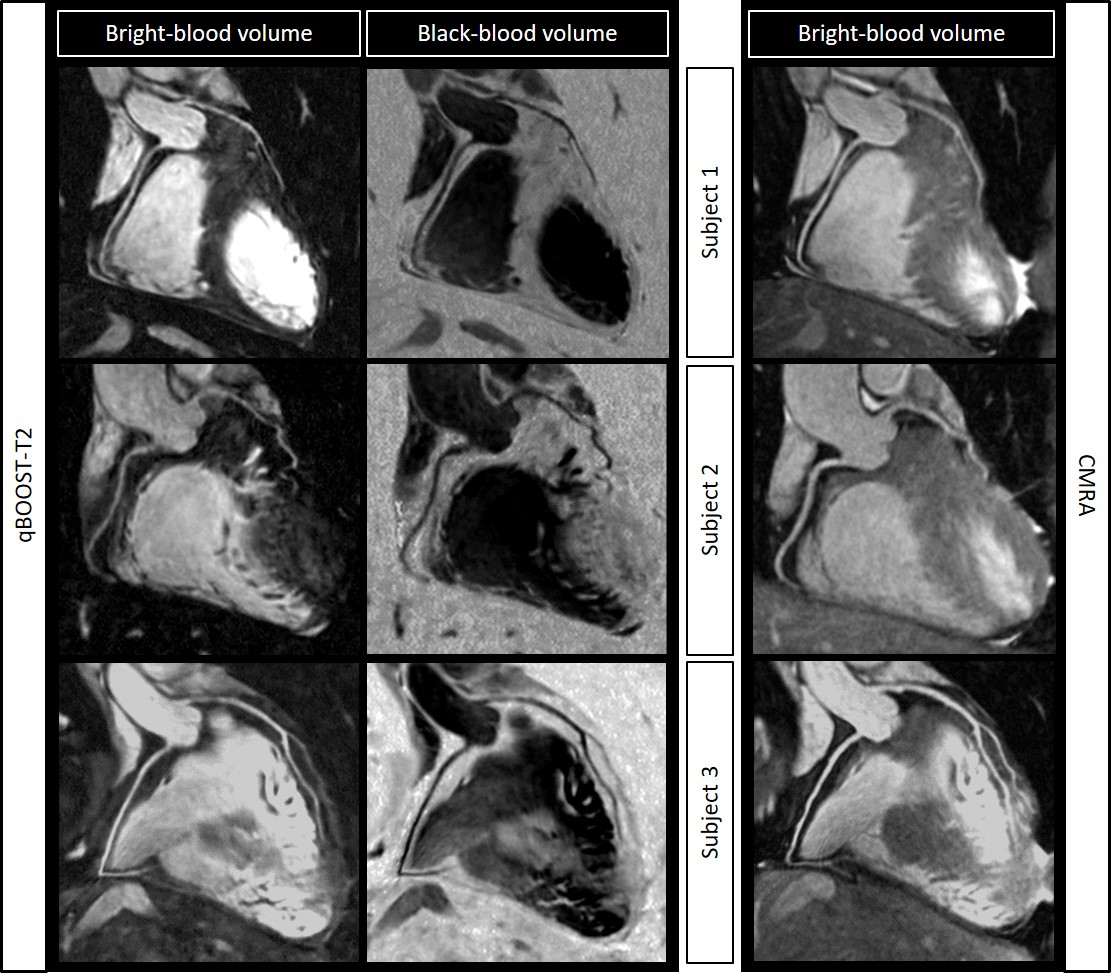
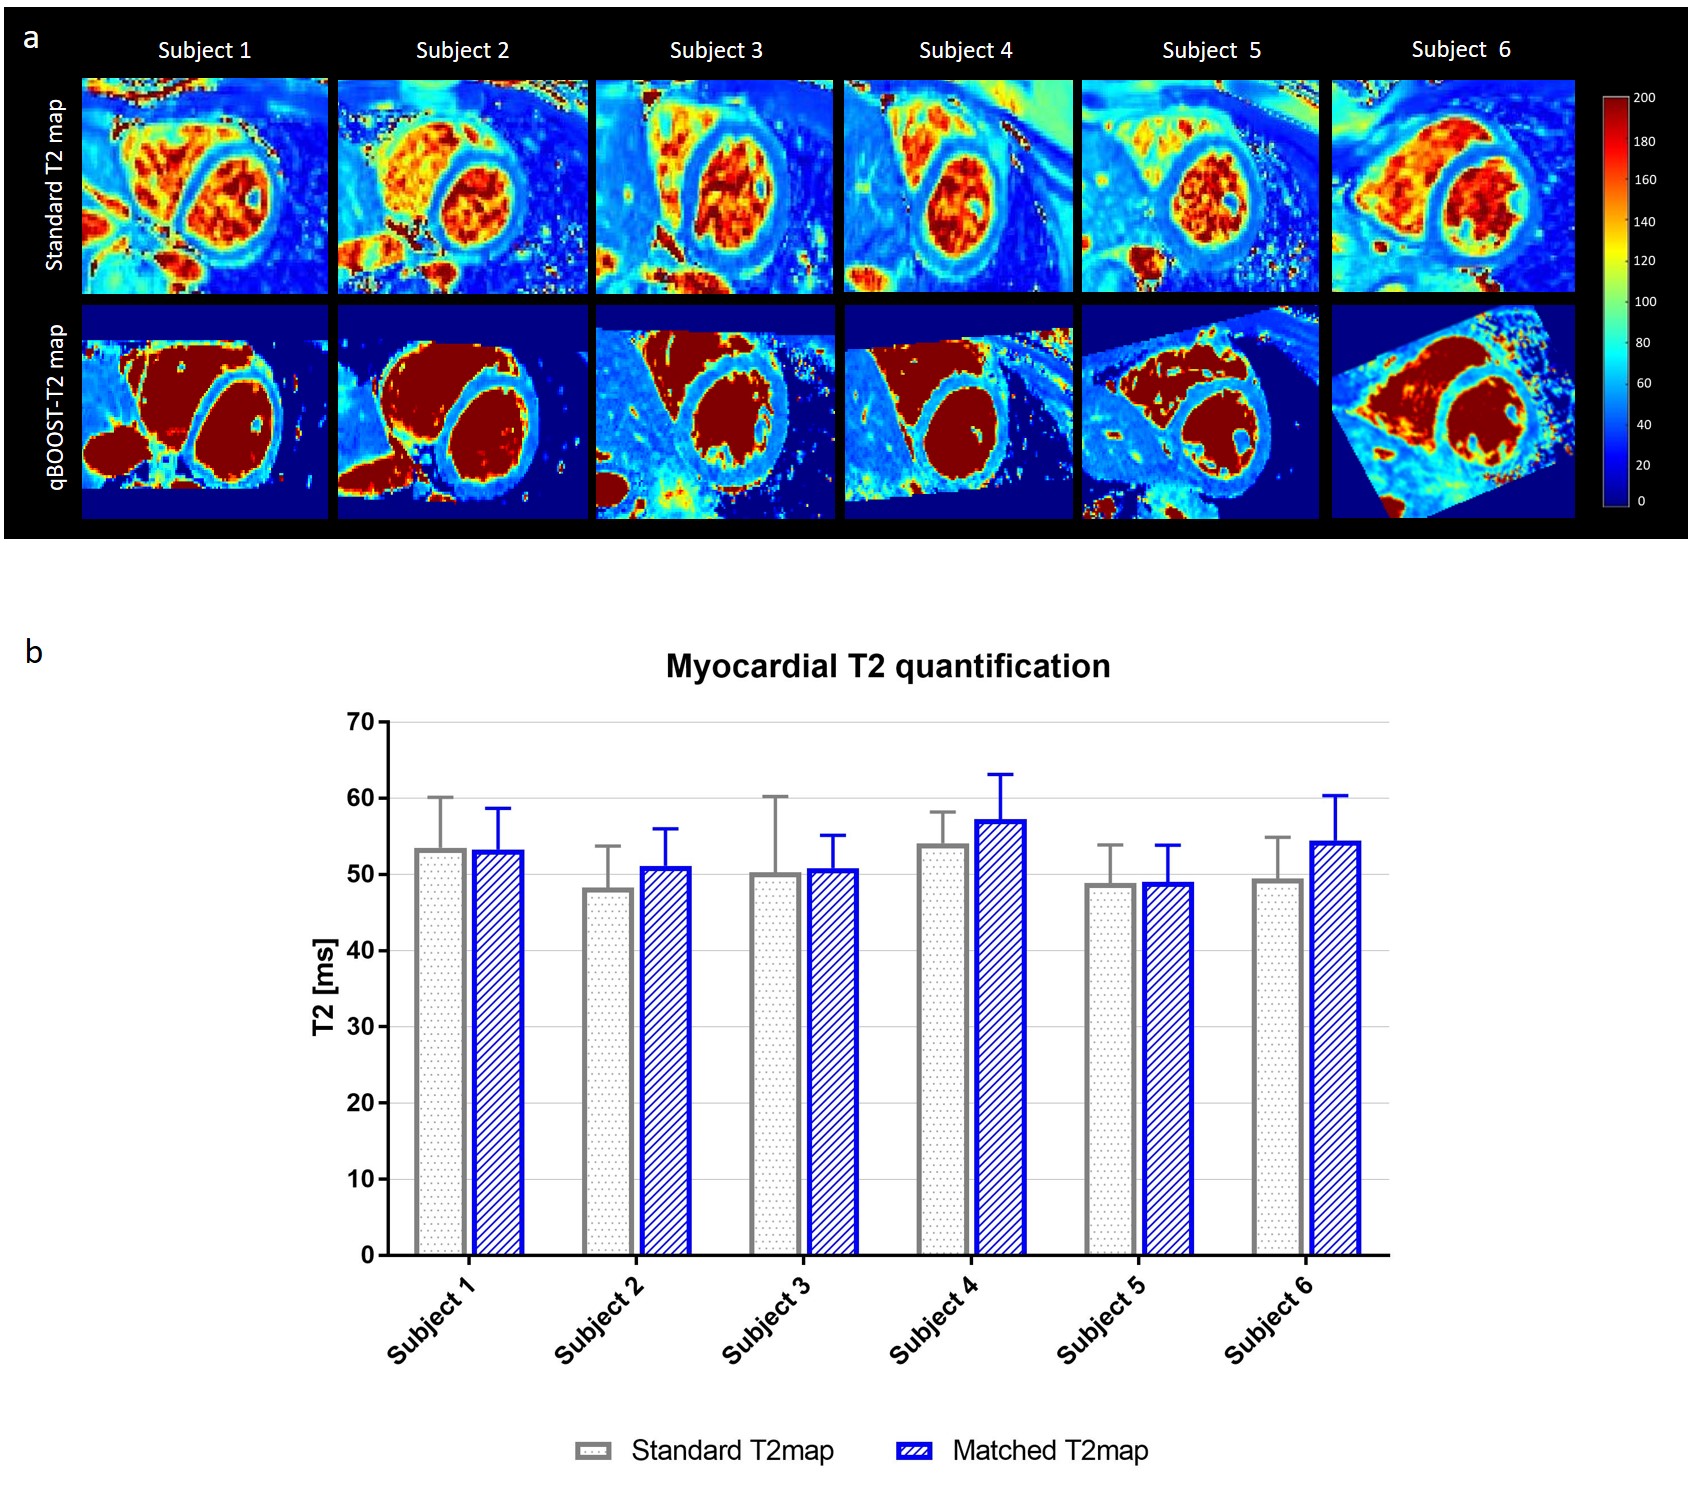
Healthy subjects: 3D co-registered bright- and black-blood volumes and T2 maps for two representative healthy subjects in coronal, short axis, transversal and four-chamber views are shown in Fig.3. Coronary artery reformats and comparison with reference standard CMRA are shown in Fig.4 for three representative healthy subjects. Good coronary artery depiction was observed both in bright- and black-blood volumes with the proposed sequence. Reformatted short-axis T2 maps obtained with the proposed sequence and reference standard 2D T2 maps are shown in Fig.5 for all six healthy subjects. T2 quantification obtained with qBOOST-T2 showed good agreement with the reference standard 2D T2 mapping.
Conclusion
The proposed accelerated qBOOST-T2 sequence allows the acquisition of 3D co-registered high-resolution bright- and black-blood volumes and T2 maps for comprehensive assessment of cardiovascular disease in a clinically feasible scan time of ~10min (comparable with standard CMRA acquisition time). The proposed approach showed promising results in terms of accurate T2 quantification when compared to standard 2D T2 mapping. Future work will include further validation in healthy subjects and patients with cardiovascular disease.Acknowledgements
This work was supported by EPSRC (EP/L015226/1, EP/P001009/1, EP/P007619 and EP/P032311/1) and the Wellcome EPSRC Centre for Medical Engineering (NS/A000049/1).References
[1] P. Montant, M. Sigovan, D. Revel, and P. Douek, “MR imaging assessment of myocardial edema with T2 mapping,” Diagn. Interv. Imaging, vol. 96, no. 9, 2015.
[2] G. Ginami, R. Neji, A. Phinikaridou, J. Whitaker, R. M. Botnar, and C. Prieto, “Simultaneous bright‐ and black‐blood whole‐heart MRI for noncontrast enhanced coronary lumen and thrombus visualization,” Magn. Reson. Med., vol. 79, no. 3, pp. 1460–1472, 2018.
[3] C. Prieto et al., “Highly efficient respiratory motion compensated free-breathing coronary MRA using golden-step Cartesian acquisition,” J. Magn. Reson. Imaging, vol. 41, no. 3, 2015.
[4] A. Bustin et al., “Five-minute whole-heart coronary MRA with sub-millimeter isotropic resolution, 100% respiratory scan efficiency, and 3D-PROST reconstruction,” Magn. Reson. Med., vol. 0, no. 0, Jul. 2018.
[5] M. Henningsson, P. Koken, C. Stehning, R. Razavi, C. Prieto, and R. M. Botnar, “Whole-heart coronary MR angiography with 2D self-navigated image reconstruction,” Magn. Reson. Med., vol. 67, no. 2, 2012.
[6] M. Weigel, “Extended phase graphs: Dephasing, RF pulses, and echoes - pure and simple,” J. Magn. Reson. Imaging, vol. 41, no. 2, pp. 266–295, Feb. 2015.
[7] G. Captur et al., “A medical device-grade T1 and ECV phantom for global T1 mapping quality assurance---the T1 Mapping and ECV Standardization in cardiovascular magnetic resonance (T1MES) program,” J. Cardiovasc. Magn. Reson., vol. 18, no. 1, p. 58, Sep. 2016.
Figures