2000
Inter-Scanner, Inter-Software, and Inter-Reader Cross-over Interindividual Comparison of Quantitative Parameters in 4D Flow MRI1Department of Radiology and Nuclear Medicine, University Hospital Schleswig-Holstein, Campus Lübeck, Lübeck, Germany, 2Siemens Healthcare GmbH, Hamburg, Germany, 3Philips GmbH, Hamburg, Germany
Synopsis
Before introduction into clinical routine 4D Flow MRI has to be tested in larger scale studies. For data to meet quality standards for these studies various potential error sources have to be addressed. The aim of this study was to provide a comprehensive inter-scanner, inter-vendor, inter-individual cross-over evaluation of a 4D Flow sequence. The thoracic aorta of eight volunteers was examined on two 3T MRI-Scanners of different vendors and analyzed by two readers using three different software. While there was no significant difference between readers and MRI scanners, differences between analysis-software where beyond clinically acceptable limits.
Purpose
4D Flow MRI has become more and more recognized by clinicians to assess pathology (1, 2). However, prior to being fully introduced into clinical routine, further studies are necessary, e.g. to define threshold values for quantitative parameters and develop dedicated protocols. Next to inherent limitations regarding the underlying sequence, various other potential sources of errors with regard to inter-scanner and inter-vendor repeatability have to be addressed (3, 4). Moreover, a plethora of commercially available software solutions, each relying on different approaches to process 4D Flow data, is available to extract quantitative flow and velocity information as well as anatomical detail from each scan. Consistency and comparability of data is fundamental to meet quality standards for the execution of larger-scale studies. However, available comparative data are scarce. Hence, the aim of this study was to provide a comprehensive evaluation by performing an inter-scanner, inter-vendor, inter-individual cross-over comparison to assess quantitative results of a 4D Flow sequence on two 3T MRI scanners using three different analysis software tools.Methods
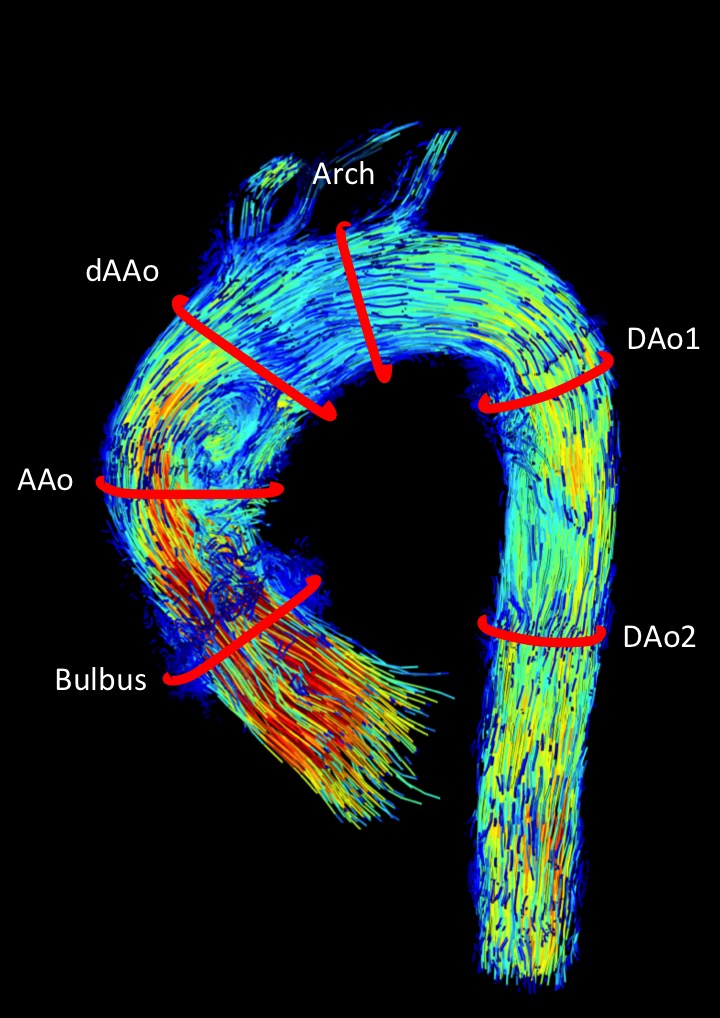
Eight healthy volunteers (“Vol”, 3f, age 27±3) were examined on two 3T MRI-scanners of different vendors (MRI1: Ingenia, Philips; MRI2: Skyra, Siemens) with a retrospectively ECG-gated 4D Flow sequence. Imaging parameters were chosen as closely matching as possible following the consensus guidelines provided elsewhere (5) and checked with each vendor’s application specialist. Typical imaging parameters on both scanners were: Venc=200cm/s; vendor-specific parallel imaging with an acceleration factor of two in phase-encoding direction; spatial resolution was kept constant inter-individually and was 2.2-2.5mm interpolated to 2.0mm in all spatial directions. Data were reconstructed to 24 time frames. Depending on the heart rate (49-87/min), an effective temporal resolution of 32-58ms was achieved. Data were assessed by two readers blinded to each others’ results. The following software tools were used: SW1=GTFlow (v3.1.13, Gyrotools, CH), SW2=cvi42 (v5.9.2, Circle Cardiovascular Imaging, CAN), SW3=CAAS (v5.0, Pie Medical Imaging, NL) to extract flow, velocity, and anatomical parameters such as forward and net stroke volumes (SVfw [ml], SVnet [ml], respectively), peak flow (Qmax [ml/s]), maximum velocity (Vmax [cm/s]), and maximum area (Amax [mm2]) on six predefined contours at reproducible anatomical landmarks as illustrated in Fig. 1.Results
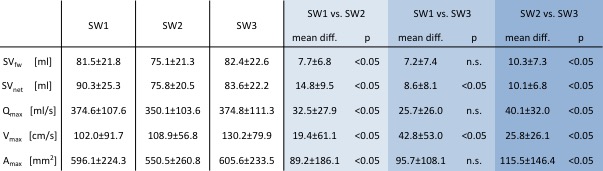
Acquisitions were performed in 18±4min (MRI1) and 12±2min (MRI2), p<0.05. The MRI exam of a single volunteer could not be processed with SW2 and was therefore excluded. In total, both readers analyzed 96 contours for each software. There was no significant difference in between readers and MRI scanners for all quantitative parameters (p=n.s.). Results of the inter-software comparison are summarized in table 1. As opposed to the inter-scanner comparison, using different software tools resulted in high average and relative differences. These were most notable for Vmax and Amax. When analyzed with S3 Bland-Altman analysis revealed an overestimation of Vmax compared to SW 1 and SW 2 (Vmax: BA [SW1-SW3]: 42±53cm/s=54±40%; BA [SW1-SW2]: 19±61cm/s=29±34%; BA [SW2-SW3]: 26±26cm/s=30±35%, all p<0.05). SW3 also produced generally higher values for Amax, these differences were most pronounced in comparison between SW2 and SW3 (Vmax: BA [SW1-SW3]: 95±108cm/s=16±20%, p=n.s.; BA [SW1-SW2]: 89±186cm/s=22±22%; BA [SW2-SW3]: 115±146cm/s=21±19%, both p<0.05). SW2 had a systematic tendency to underestimate values versus the other software, these differences reached statistical significance for all parameters. Relative differences between SVfw, SVnet and Qmax did not surpass a limit of 15% for all software.Conclusion
The inter-scanner and inter-reader results indicate a sound and exchangeable basis for 4D Flow MR exams and seem well-suited for multi-center studies. Regarding the inter-scanner comparison, subtle differences are difficult to attribute to a single technical issue and are most likely the sum of limitations known to influence 4D Flow MRI. However, care must be taken when using or comparing results of different software tools used for quantification. Although all software was fed the same data, error and spread of results are beyond acceptable limits. Possible error source inherent to the study protocol may be the generalized reconstruction to 24 time frames, therefore not achieving optimized temporal resolution for each volunteer. Differences for Amax may be indicating contouring errors, affecting other quantitative parameters. Anyway, these results call for further standardization and normalization with respect to data format and quantification of 4D Flow MRI data.Acknowledgements
No acknowledgement found.References
1. Jarvis K, Vonder M, Barker AJ, et al. Hemodynamic evaluation in patients with transposition of the great arteries after the arterial switch operation: 4D flow and 2D phase contrast cardiovascular magnetic resonance compared with Doppler echocardiography. J Cardiovasc Magn Reson 2016;18(1):59.
2. Reiter U, Reiter G, Fuchsjager M. MR phase-contrast imaging in pulmonary hypertension. Br J Radiol 2016;89(1063):20150995.
3. Jarvis K, Schnell S, Barker AJ, et al. Caval to pulmonary 3D flow distribution in patients with Fontan circulation and impact of potential 4D flow MRI error sources. Magn Reson Med 2018.
4. Gatehouse PD, Rolf MP, Graves MJ, et al. Flow measurement by cardiovascular magnetic resonance: a multi-centre multi-vendor study of background phase offset errors that can compromise the accuracy of derived regurgitant or shunt flow measurements. J Cardiovasc Magn Reson 2010;12:5.
5. Dyverfeldt P, Bissell M, Barker AJ, et al. 4D flow cardiovascular magnetic resonance consensus statement. J Cardiovasc Magn Reson 2015;17:72.
Figures