1999
Assessment of Pulmonary Hypertension using 4D flow and SSFP MRI1Northwestern University, Chicago, IL, United States, 2Mayo Clinic, Rochester, MN, United States
Synopsis
Right heart catheterization (RHC) is the current gold standard for the diagnosis of pulmonary hypertension (PHTN). However, the use of invasive and ionizing procedures during RHC has driven research to find alternative ways for PHTN assessment using MRI. We propose time resolved 3D imaging (4D flow) and SSFP cardiac MRI as an alternative method for assessing hemodynamics for PHTN. Using One-way Analysis of Variance (ANOVA), inter-observer variability, and post hoc analysis our findings indicate the possibility of MRI to detect hemodynamic changes among various groups of PHTN and healthy controls which could lead to successful diagnostic distinctions between groups.
Introduction
Right heart catheterization (RHC) provides diagnostic data for the detection of elevated pulmonary pressures and abnormal hemodynamics and is the current gold standard for the diagnosis and classification of pulmonary hypertension (PHTN).1 Despite its valuable capabilities, RHC is limited by its invasive nature and exposure to radiation. 4D Flow and SSFP MRI is a non-invasive modality which provides blood flow visualization, comparable hemodynamic information, and volumetric assessment of the left atrium without exposure to radiation. Recent studies have shown the capability of time resolved 3D imaging (4D flow) and SSFP MRI to detect hemodynamic differences in World Health Organization (WHO) group 1 PHTN (pulmonary arterial hypertension (PAH)), compared to healthy controls.2-5 Also, one study6 compared PAH to pulmonary venous hypertension (PVH) using MRI, however small sample size and no comparison to healthy controls were limitations of the study. The following analysis attempts to overcome prior limitations by comparing PHTN patients with elevated pulmonary vascular resistance (WHO groups 1,3,4&5) to PHTN patients with low pulmonary vascular resistance (WHO group 2 (PVH)) to healthy controls. Patients with PAH (WHO group 1) and patients in WHO groups 3,4&5 were used in the same analysis sample because of their elevated pulmonary vascular resistance. What follows is an interim analysis of a standardized 4D flow analysis workflow by two independent readers as well as left atrial volume (LAV) analysis to compare PVH to WG1,3,4&5 to healthy controls.Methods
Cohort organization is provided in Figure 1. With IRB approval and subject consent, a total of 17 PVH patients were compared to 13 WG1,3,4&5 patients who were also compared to 17 healthy controls. Patients were confirmed to have PHTN using RHC conducted within 28 days of the research MRI. No RHCs were conducted for the healthy controls.
One contrast enhanced research MRI using 4D flow in vivo was acquired during free breathing and prospective ECG gating using the following sequence parameters: spatial resolution (SR) = 2.3mm x 2.3mm x 2.9mm, temporal resolution (TR) = 40ms, velocity sensitivity (venc) = 160cm/s. SSFP cine was acquired with the following parameters: (SR) = 1.8mm x 1.8mm x 6.0mm, (TR) = 35.49ms.
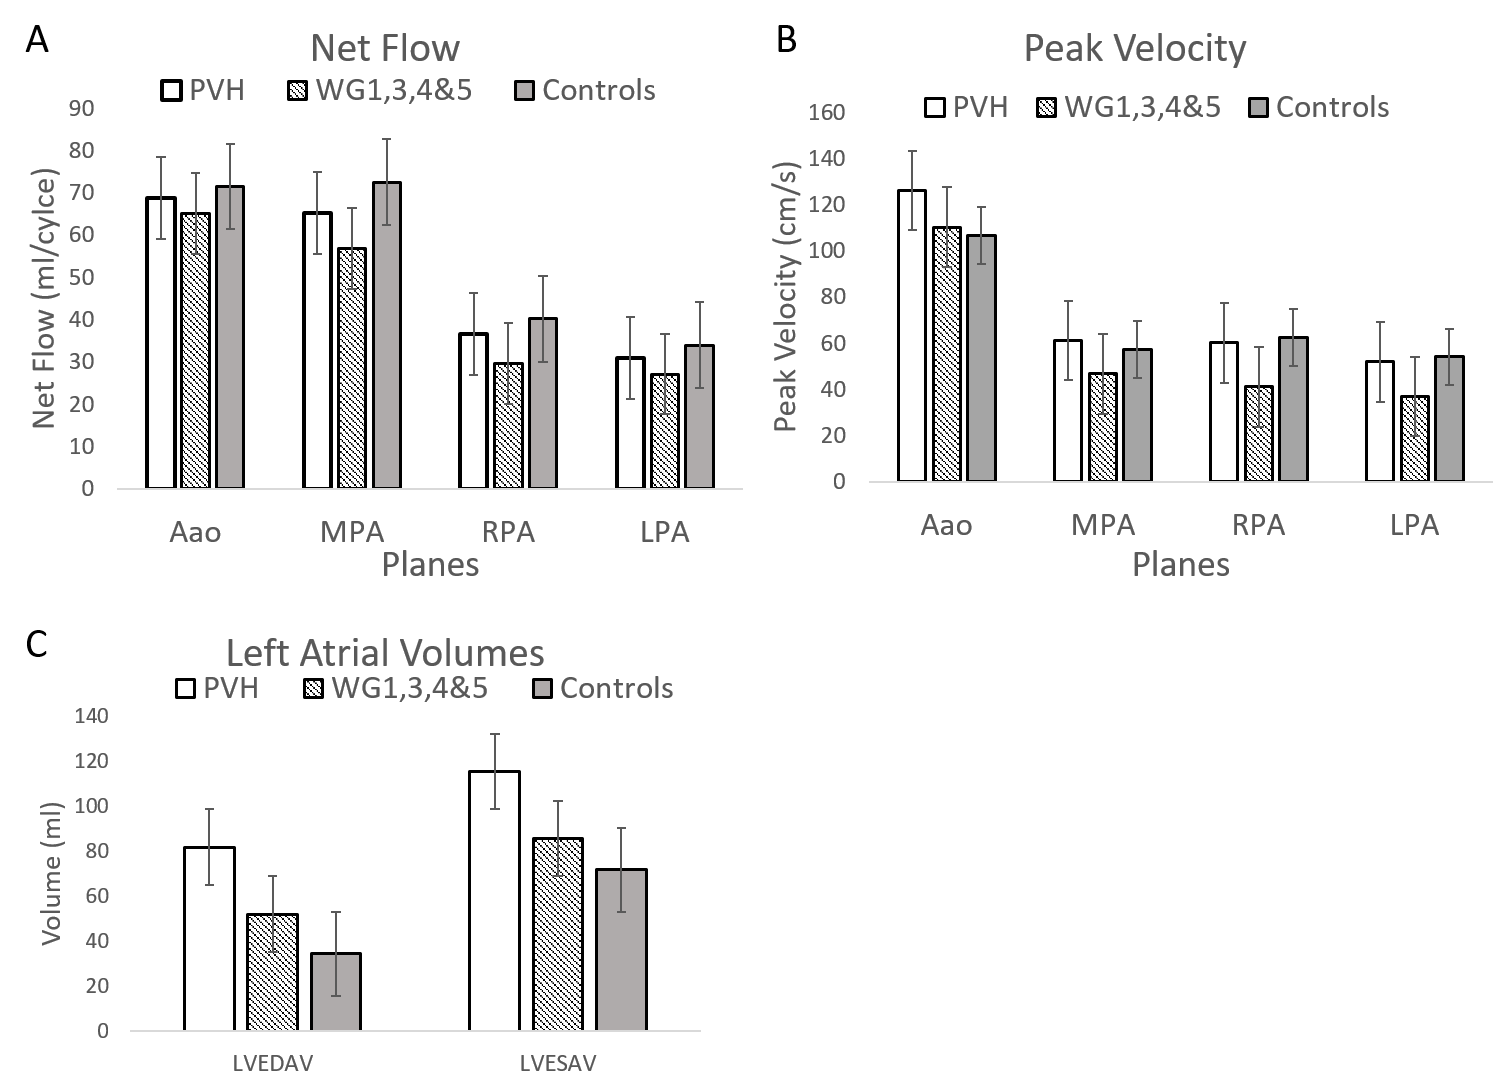
Image analysis was performed on a commercial software prototype (Circle CVI, Calgary, Canada). To mitigate differences in inter-observer variability for 4D flow analysis, the workflow was standardized by having both observers practice a set of separate 4D flow cases from those used for the PHTN analysis. Analysis planes were placed in four agreed upon anatomic locations; the ascending aorta (AAo) at the location of highest velocity using velocity maximum intensity projections (MIP), the main pulmonary artery (MPA) immediately before bifurcation, and in both branches of the MPA immediately after bifurcation. Net flow and peak velocity were the two 4D flow metrics analyzed.
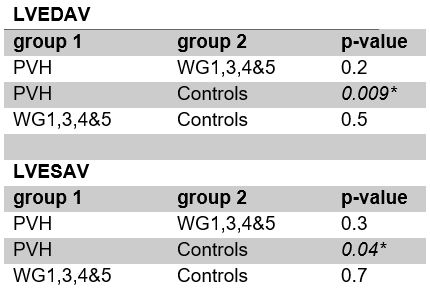
The left atrium was manually contoured at left ventricular end systole and diastole from both 2 and 4 chamber SSFP cine image stacks to obtain LAV using a monoplane and biplane segmentation tool.
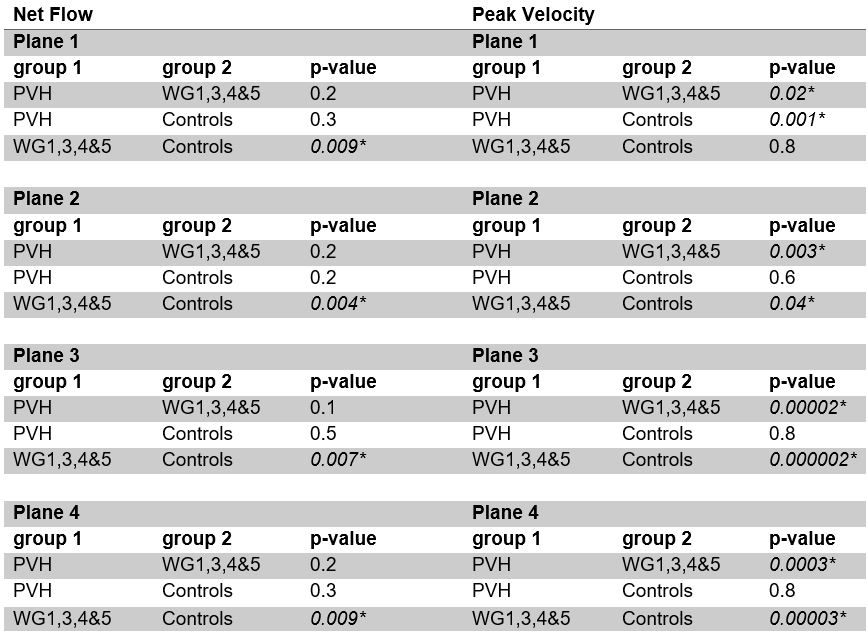
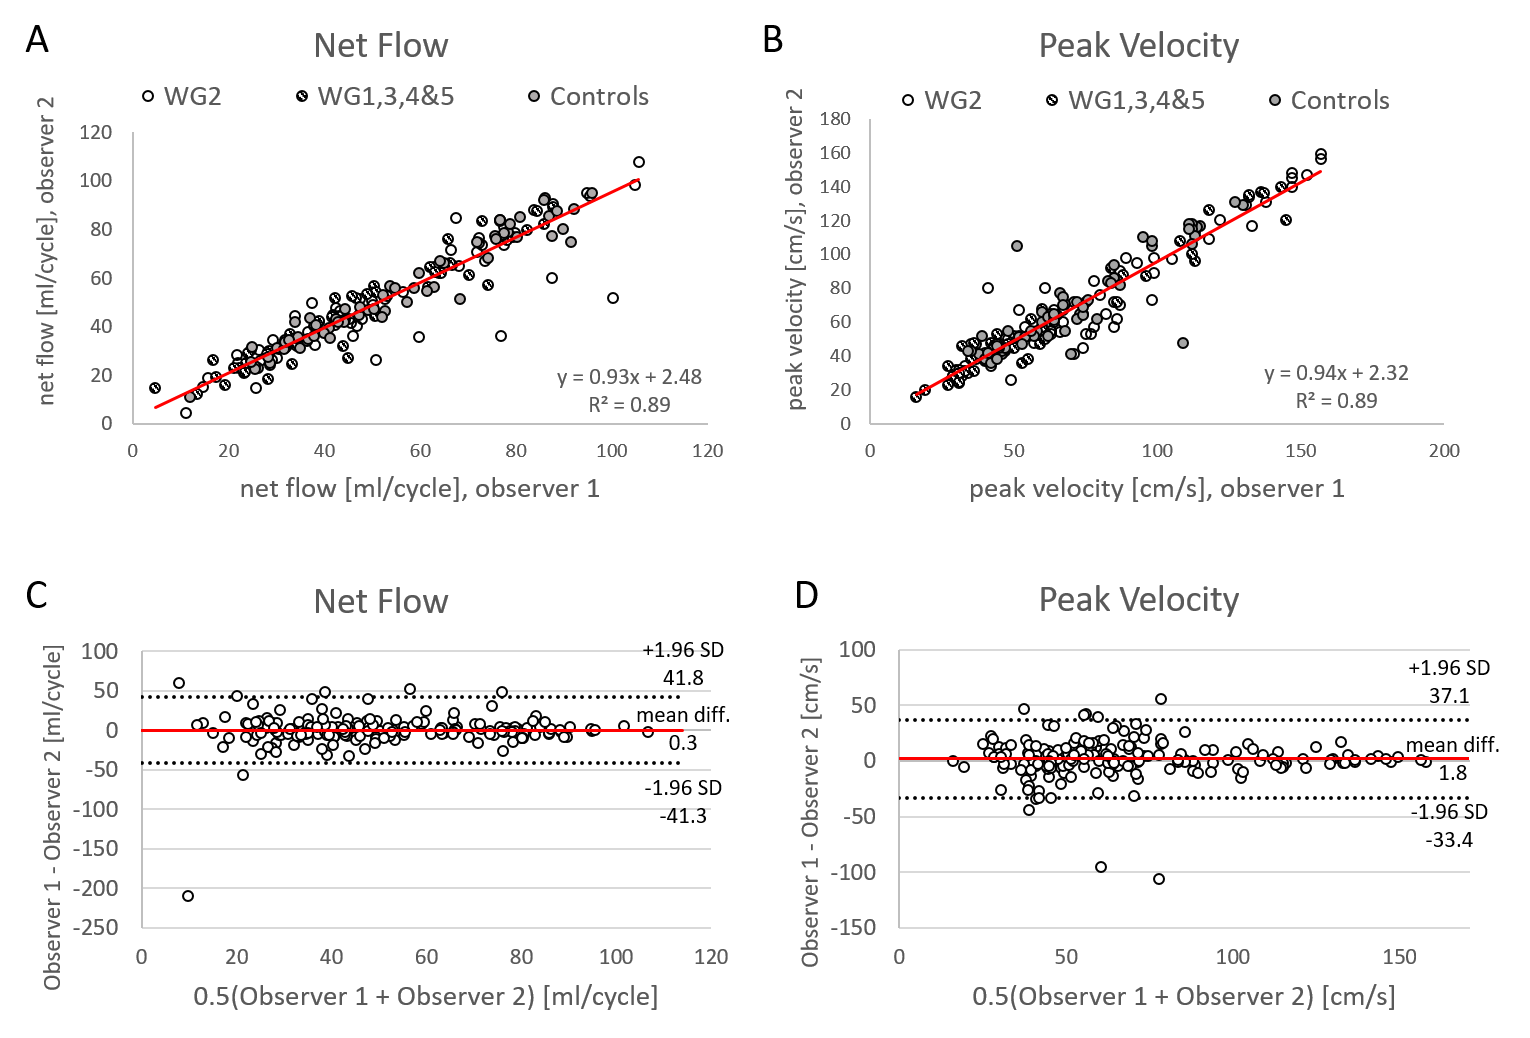
Statistical analysis comparing PVH, WG1,3,4&5, and controls was performed using One-way Analysis of Variance (ANOVA) and Tukey’s HSD (Honestly Significant Difference) post hoc test. Inter-observer variability was assessed using linear regression and Bland-Altman plots.
Results
ANOVA was used to test the relationship between PVH, WG1,3,4&5, and healthy controls, results of which are summarized in Figure 2. Tukey’s HSD post hoc analysis was used to determine which of the relationships for 4D flow and LAV were significant and the results are summarized in Tables 1 & 2. Linear regression and Bland Altman analysis were conducted for inter-observer variability and results are summarized in Figure 3.Discussion
The results shown demonstrate the ability of 4D flow and SSFP cine MRI to be a reproducible method of detecting hemodynamic changes based on different manifestations of PHTN. Peak velocity was shown to be a better indicator of the type and presence of PHTN due to its increased sensitivity compared to net flow, although net flow was not without its significance. Post hoc tests further demonstrate the ability of 4D flow and SSFP MRI to distinguish between the different types of PHTN and healthy controls.Conclusion
Though RHC is regarded as the gold standard for pressure and hemodynamic diagnostics, MRI may be a suitable contender for assessing PHTN with the added benefit of being noninvasive and nonionizing. Future studies warrant the evaluation of more extensive flow analysis including a comparison to additional clinical diagnostic data with a larger cohort of PHTN patients.Acknowledgements
Bayer AGReferences
1. “Pulmonary Hypertension.” National Heart Lung and Blood Institute, U.S. Department of Health and Human Services, www.nhlbi.nih.gov/health-topics/pulmonary-hypertension.
2. Odagiri, Keiichi, et al. “Non-Invasive Evaluation of Pulmonary Arterial Blood Flow and Wall Shear Stress in Pulmonary Arterial Hypertension with 3D Phase Contrast Magnetic Resonance Imaging.” SpringerPlus, vol. 5, no. 1, 2016, doi:10.1186/s40064-016-2755-7.
3. Wehrum, Thomas, et al. “Age Dependence of Pulmonary Artery Blood Flow Measured by 4D Flow Cardiovascular Magnetic Resonance: Results of a Population-Based Study.” Journal of Cardiovascular Magnetic Resonance, vol. 18, no. 1, 2016, doi:10.1186/s12968-016-0252-3.
4. Barker, Alex J., et al. “Four-Dimensional Flow Assessment of Pulmonary Artery Flow and Wall Shear Stress in Adult Pulmonary Arterial Hypertension: Results from Two Institutions.” Magnetic Resonance in Medicine, vol. 73, no. 5, 2014, pp. 1904–1913., doi:10.1002/mrm.25326.
5. Crawley, Stephen F., et al. “LA Volume by CMR Distinguishes Idiopathic From Pulmonary Hypertension Due to HFpEF.” JACC: Cardiovascular Imaging, vol. 6, no. 10, 2013, pp. 1120–1121., doi:10.1016/j.jcmg.2013.05.014.
6. Bane, Octavia, et al. “A Non-Invasive Assessment of Cardiopulmonary Hemodynamics with MRI in Pulmonary Hypertension.” Magnetic Resonance Imaging, vol. 33, no. 10, 2015, pp. 1224–1235., doi:10.1016/j.mri.2015.08.005.
Figures