1996
The assessment of aortic regurgitation using phase contrast MRI is influenced by complex flow1Institute of Clinical Scientist, Gothenburg, Sweden, 2Institute of Medicine, Gothenburg, Sweden, 3Institute of Clinical Sciences, Gothenburg, Sweden
Synopsis
Assessment of aortic regurgitation (AR) severity by cardiovascular MRI can be obtained directly by phase-contrast MRI. For some AR-patients, especially those with aortic dilatation and bicuspid aortic valve, the flow profile can be highly complex displaying asymmetric outflow jets, helical vortex flow and systolic backward flow. This study showed that such complex flow influences the accuracy of the AR assessment and needs to be taken into account in clinical practice as it may compromise the decision-making and timing of surgery.
Purpose
Assessment of aortic regurgitation (AR) severity by cardiovascular MRI can be obtained directly by through-plane phase contrast MRI (PC-MRI) in the ascending aorta.1 For some AR-patients, especially those with aortic dilatation and bicuspid aortic valve (BAV), the flow profile can be highly complex displaying asymmetric outflow jets, helical vortex flow,2,3 and systolic backward flow.4 We hypothesize that such complex flow affects the accuracy of the AR assessment as the PC-MRI only measures velocity components orthogonal to the imaging slice.
Accordingly, the aim of this study was to investigate the influence of complex flow on the accuracy of PC-MRI in the assessment of chronic AR severity.
Methods
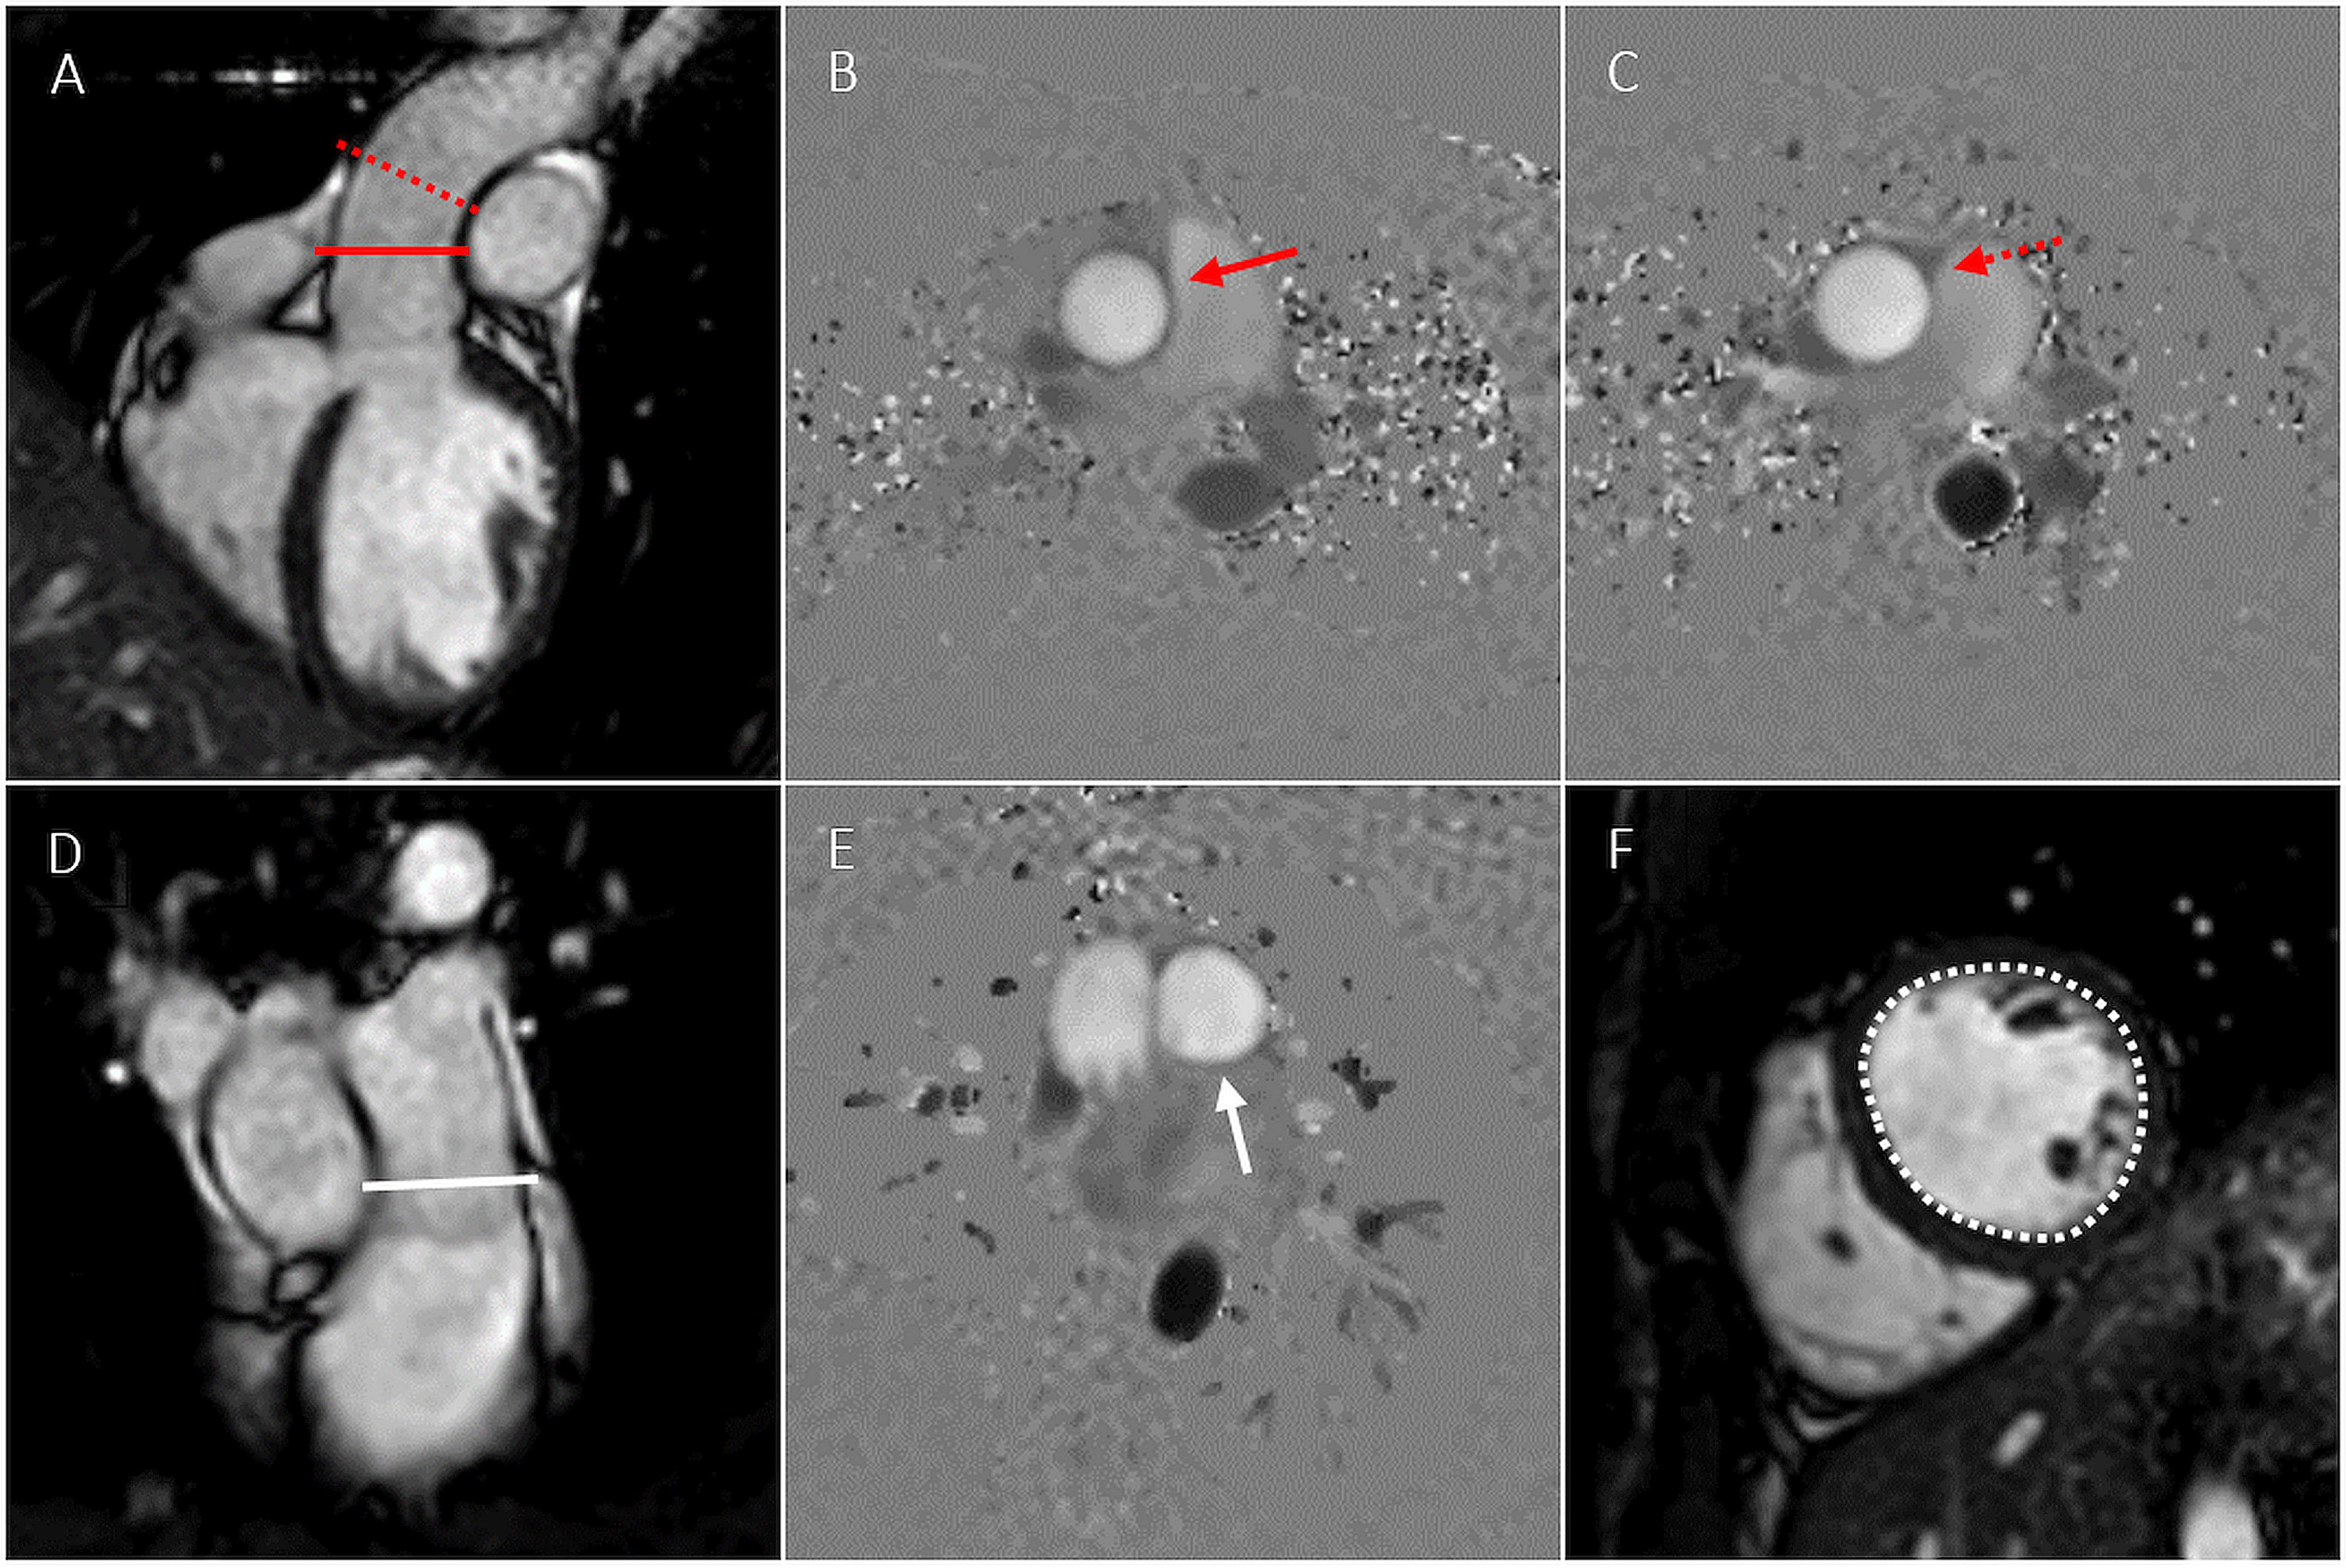
Patients with moderate (n=15) and severe (n=28) chronic AR were included in the study. PC-MRI was performed at the level of the sinotubular (ST)-junction (Ao1) and 1 cm above the ST-junction (Ao2) (Figure 1).
To investigate the influence of complex flow on the assessment of AR using PC-MRI, a reference method (left ventricular stroke volume - pulmonary stroke volume), unaffected by complex flow, was used for comparisons of regurgitation volumes (RVol) (Figure 1).
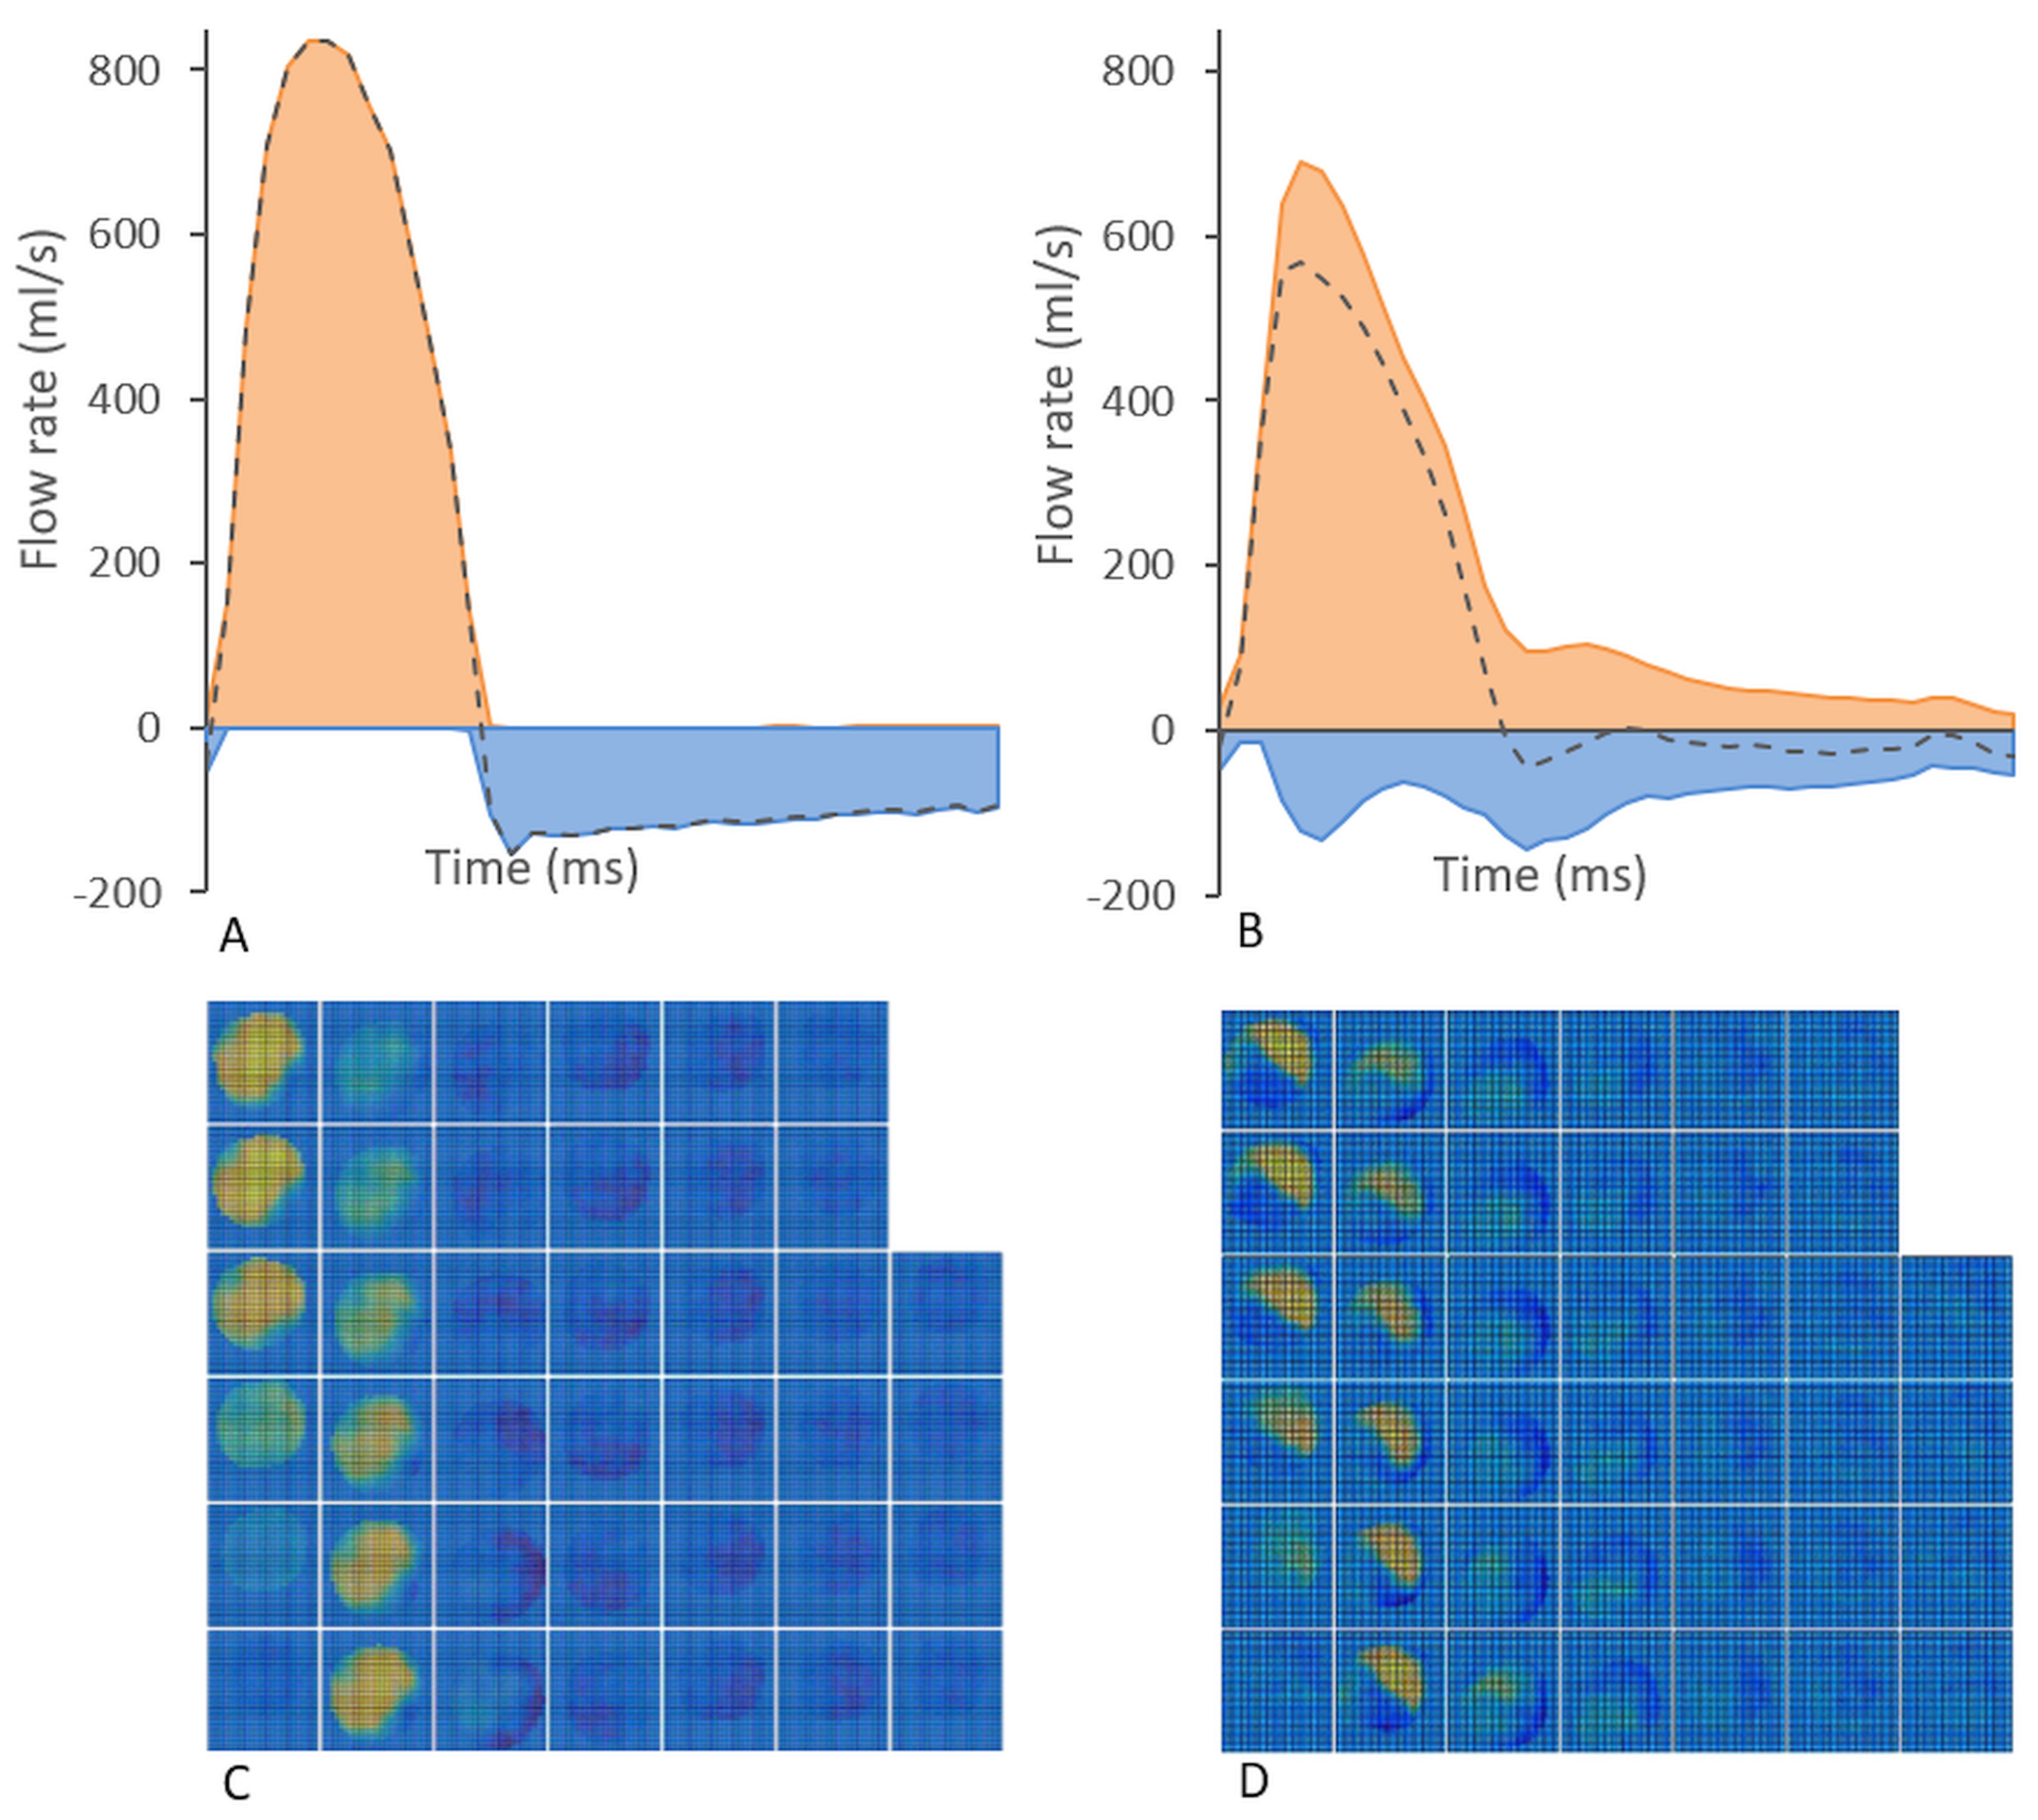
Detailed flow analysis using an offline research tool (Segment v1.9 R2046 5) was performed to characterize the complexity of the flow at the position of the PC-MRI measurement. The backward flow volume (BFV) during systole and the forward flow volume (FFV) during systole were calculated. Net, forward and backward flow curves, as well as velocity profiles describing the velocity distribution over the vessel area were plotted for all phases of the cardiac cycle (Figure 2).
Based on the detailed flow analysis, patients were then grouped into presence of complex flow (CF) or non-complex flow (NCF). Patients with presence of CF fulfilled at least one of the following conditions: 1) Backward flow present during the majority of the systolic cardiac phases, and/or 2) BFV ≥ 10 ml (Figure 2).
Results
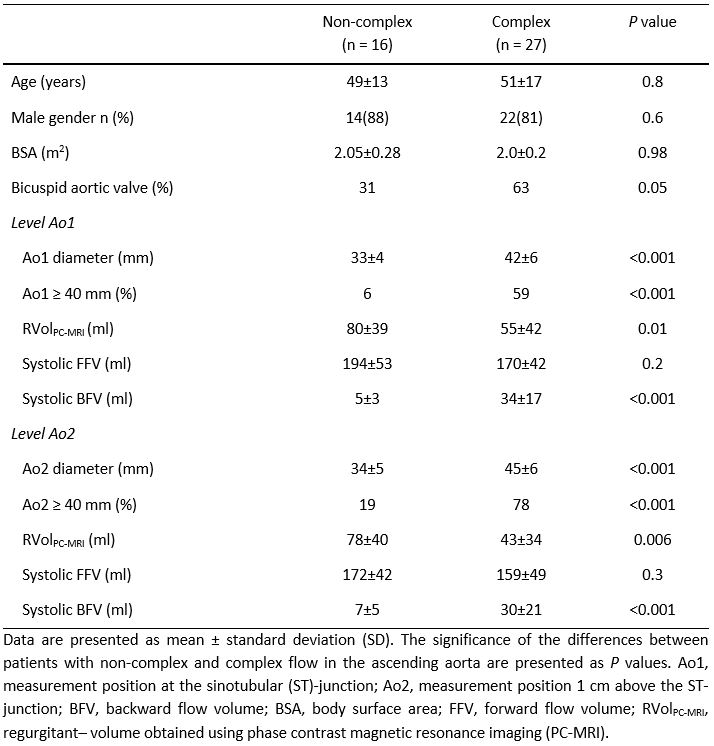
Patient characteristics are shown in Table 1. Patients with CF had significantly larger ascending aortas and more systolic backward flow than patients with NCF. Also, patients with CF had significantly smaller RVols compared to patients with NCF, and BAV was more common in patients with CF than in patients with NCF. No significant differences were found regarding systolic FFV, age, gender and BSA.
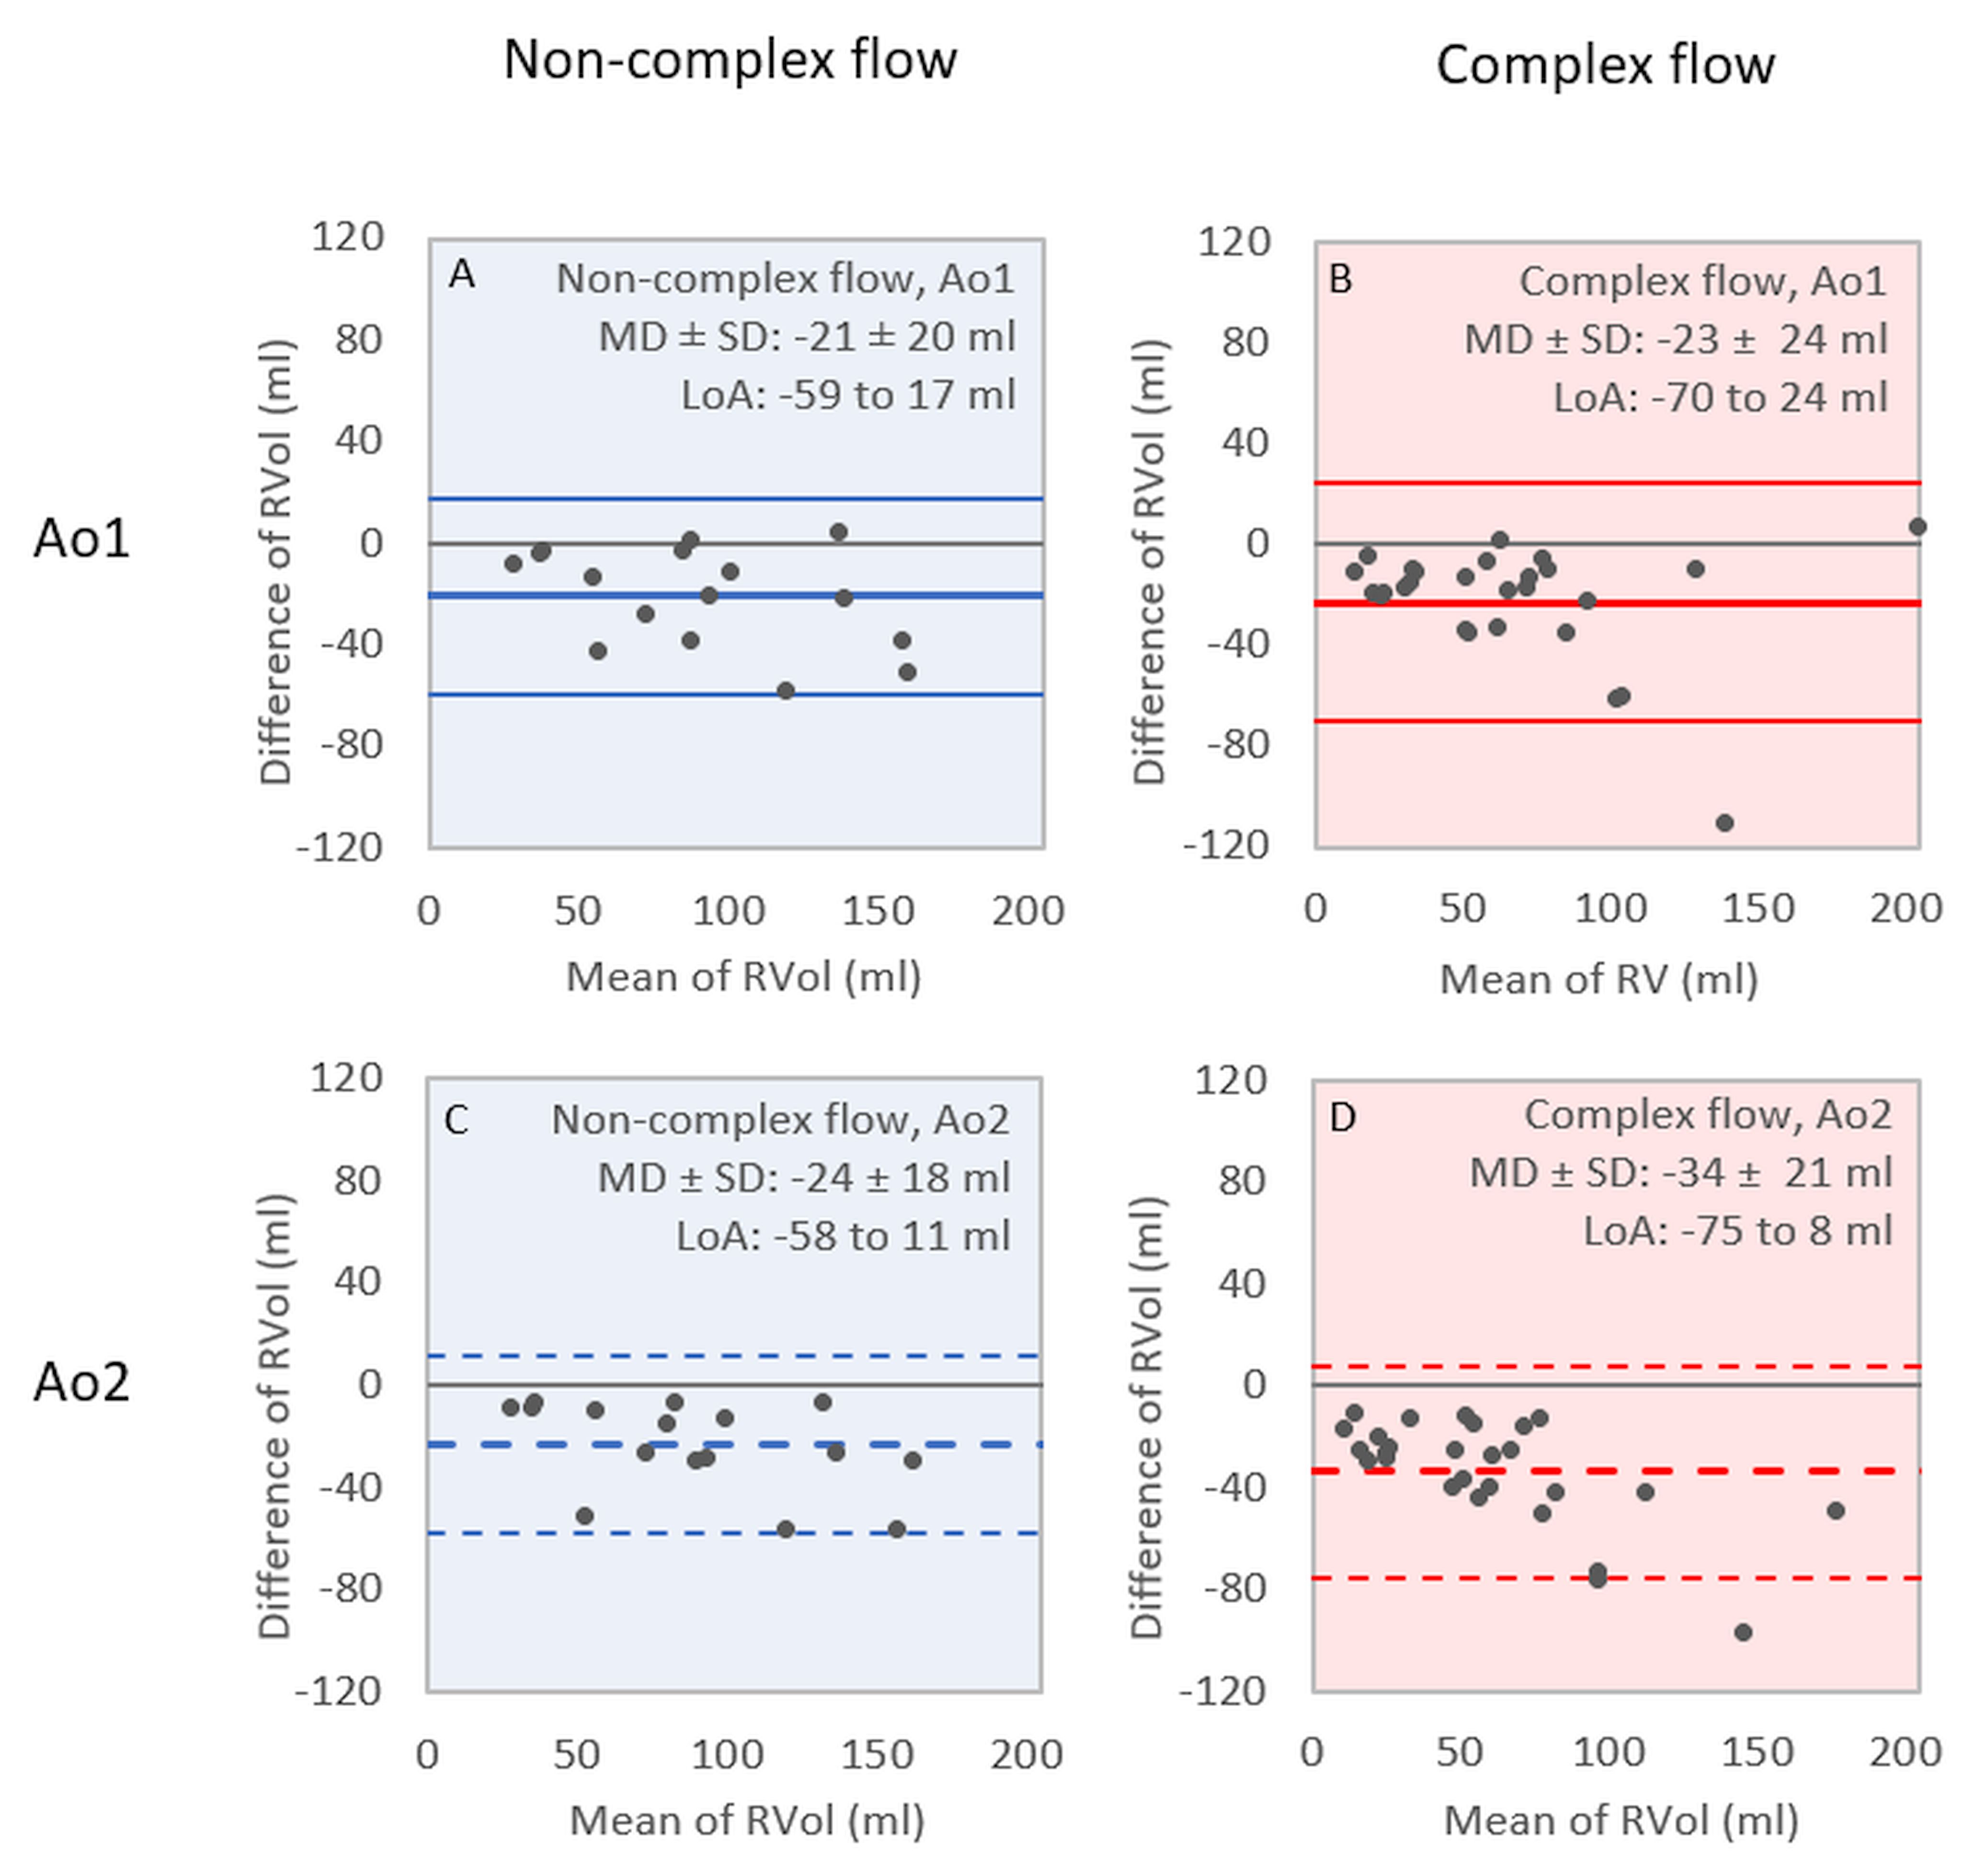
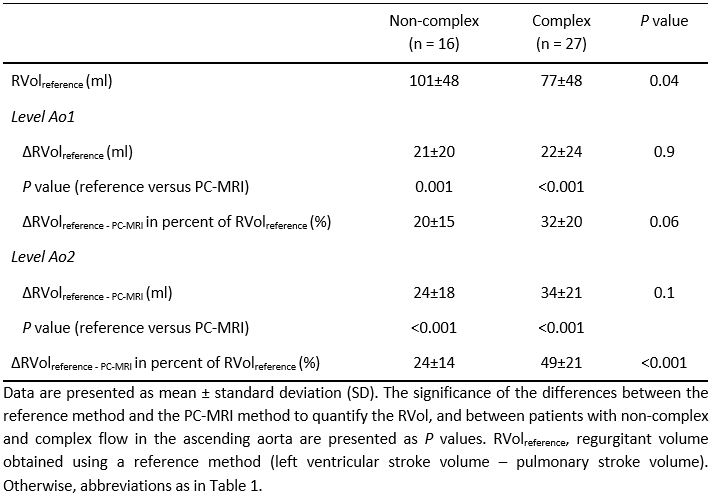
Overall, the PC-MRI method measured significantly smaller RVols than the reference method (Table 2). The underestimation was lager in patients with CF than in patient with NCF (Bland-Altman analysis, Figure 3, Table 2). The relative difference in RVol between the methods was significantly larger for patients with CF than for patients with NCF at Ao2 and had a tendency to be larger at Ao1 (Table 2).
Aortic dimensions were significantly greater at the distal measurement position Ao2 (38±8 mm) than at the level of the ST-junction Ao1 (35±7 mm, P<0.001). Moreover, the grade of flow complexity, as indicated by systolic BFV, was shown to increase with increasing aortic dimension (R=0.8, P<0.001).
Discussion
This study investigated if complex flow, associated with asymmetric outflow jets and helical vortex flow, compromises the assessment of AR using PC-MRI. The comparison between the PC-MRI and reference method confirmed a systematic offset in RVol between the methods 1,6-11, which was shown to increase with increased flow complexity. We also showed that the accuracy of the PC-MRI measurements decreases with increasing aortic dimension, associated with higher flow complexity.
Hence, this study shows that complex flow indeed influences the assessment of AR using PC-MRI and that larger aortas, such as dilated aortas, are more prone to these effects. This needs to be taken into account in clinical practice as it may compromise the decision-making and timing of surgery.
Acknowledgements
The authors acknowledge support from; C4I center, Sahlgrenska University Hospital, Gothenburg, Sweden.References
- Myerson SG. Heart valve disease: investigation by cardiovascular magnetic resonance. J Cardiovasc Magn Reson. 2012;14:7-7.
- Barker AJ, Markl M, Burk J, et al. Bicuspid aortic valve is associated with altered wall shear stress in the ascending aorta. Circ Cardiovasc Imaging. 2012;5:457-466.
- Hope MD, Hope TA, Meadows AK, et al. Bicuspid Aortic Valve: Four-dimensional MR Evaluation of Ascending Aortic Systolic Flow Patterns. Radiology. 2010;255:53-61.
- Barker AJ, Lanning C, Shandas R. Quantification of hemodynamic wall shear stress in patients with bicuspid aortic valve using phase-contrast MRI. Ann Biomed Eng. 2010;38:788-800.
- Heiberg E, Sjögren J, Ugander M, et al. Design and validation of Segment - freely available software for cardiovascular image analysis. BMC Med Imaging. 2010;10:1-13.
- Kilner PJ, Gatehouse PD, Firmin DN. Flow measurement by magnetic resonance: a unique asset worth optimising. J Cardiovasc Magn Reson. 2007;9:723-728.
- Iwamoto Y, Inage A, Tomlinson G, et al. Direct measurement of aortic regurgitation with phase-contrast magnetic resonance is inaccurate: proposal of an alternative method of quantification. Pediatr Radiol. 2014;44:1358-1369.
- Chatzimavroudis GP, Walker PG, Oshinski JN, et al. Slice location dependence of aortic regurgitation measurements with MR phase velocity mapping. Magn Reson Med. 1997;37:545-551.
- Kozerke S, Scheidegger MB, Pedersen EM, Boesiger P. Heart motion adapted cine phase-contrast flow measurements through the aortic valve. Magn Reson Med. 1999;42:970-978.
- Papavassiliu T, Kuhl HP, Schroder M, et al. Effect of endocardial trabeculae on left ventricular measurements and measurement reproducibility at cardiovascular MR imaging. Radiology. 2005;236:57-64.
- Marcus JT, Gotte MJ, DeWaal LK, et al. The influence of through-plane motion on left ventricular volumes measured by magnetic resonance imaging: implications for image acquisition and analysis. J Cardiovasc Magn Reson. 1999;1:1-6.
Figures