1994
4D Flow Assessment of Aortic Valve Stenosis in a Single Breath-Hold1Biomedical Engineering, The Ohio State University, Columbus, OH, United States, 2Dorothy M. Davis Heart and Lung Research Institute, The Ohio State University, Columbus, OH, United States, 3Electrical Engineering, The Ohio State University, Columbus, OH, United States, 4Siemens Healthcare, Columbus, OH, United States, 5Division of Cardiovascular Medicine, Department of Internal Medicine, The Ohio State University, Columbus, OH, United States
Synopsis
MRI-based 4D flow imaging is capable of yielding spatially and temporally resolved mapping of the blood velocity vector. Long acquisition times associated with 4D flow imaging limits its clinical utility. In this work, we apply a recently proposed technique, called ReVEAL4D, to perform 4D flow imaging in 19 patients with aortic valve stenosis. The peak velocity obtained using ReVEAL4D shows good agreement with both transthoracic echocardiography (TTE) and traditional GRAPPA-based 4D flow imaging.
Introduction
The clinical gold standard for measuring the severity of aortic valve stenosis (AVS) is TTE, which offers a fast and inexpensive exam that can quantify key biomarkers. However, TTE is sensitive to direction and misalignment of the beam with the aortic jet can cause underestimation of the peak velocity. In addition, certain patient anatomies prohibit proper beam alignment and necessitate transesophageal echocardiography, which is an invasive procedure. TTE has been shown to be suboptimal in 30% of patients1. Phase-contrast MRI (PC-MRI) based 4D flow measurements do not suffer from the misalignment issues of TTE. However, conventional 4D flow requires long acquisition time, exceeding 10 or even 20 minutes, limiting its clinical applications. The recently proposed ReVEAL4D2 demonstrated the feasibility of acquiring 4D flow data within a single breath-hold for peak velocity estimation at the aortic valve. In this work, we compare the efficacy of single breath-hold 4D flow imaging prototype against TTE and navigator respiratory-gated free-breathing 4D flow imaging to assess the severity of AVS in nineteen patients.Methods
For this study, 19 patients with moderate to severe AVS, as measured by TTE, were recruited to undergo a 4D flow MRI scan within two months of the TTE exam. TTE measured the maximum velocity above the aortic valve (Vmax). All MRI exams were performed on 1.5T clinical scanner (MAGNETOM Avanto, Siemens Healthcare, Germany). The MRI protocol included two 4D flow scans, each covering a thin (48 mm) slab encompassing the aortic valve. First, a respiratory navigator-gated acquisition accelerated with rate 3 GRAPPA was performed with an average scan time of 14 min . Second, a single breath-hold (24 heartbeats) 4D flow scan at R=21-27 was performed. The single breath-hold scan was reconstructed using ReVEAL4D2 offline with custom Matlab (Mathworks, Natick Massachusetts) code. Vmax was calculated from the PC-MRI scans by contouring the four imaging planes above the aortic valve. To extract Vmax, the maximum velocity within the region of interest over imaging plane and all cardiac phases was found for each patient. For single breath-hold scans, relevant scan parameters were as follows: TR 4.4 ms, TE 2.18 ms, TRES 36ms, flip angle 10°, FOV 430x346-280x217 mm, matrix size [144,108,12]-[144,84,12] with 50% oversampling, in plane resolution <= 3x3 mm2, and slice thickness 6 mm. For respiratory navigator-gated GRAPPA the relevant scan parameters are as follows: TR 4.4 ms, TE 2.18 ms, TRES 36ms, flip angle 10°, FOV 217x310-343x490 mm, matrix size [160,120,12], in plane resolution <=3mm, and slice thickness 6 mm. Bland-Altman, Pearson correlation, and linear regression where performed to compare the Vmax of ReVEAL4D to TTE, ReVEAL4D to GRAPPA, and GRAPPA to TTE.Results
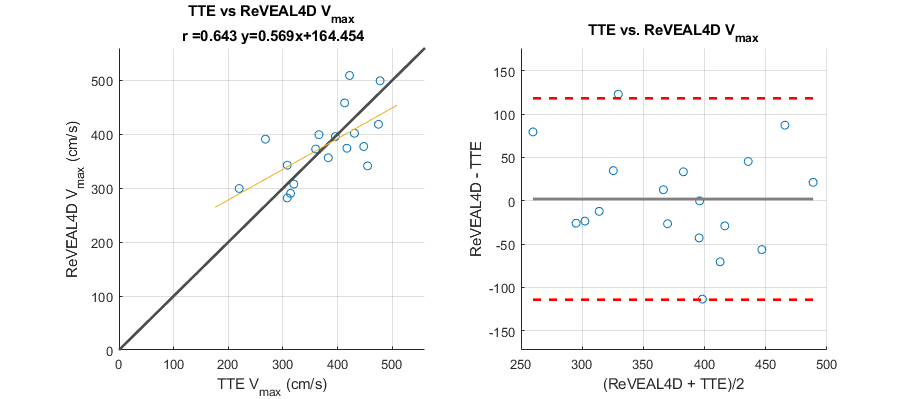
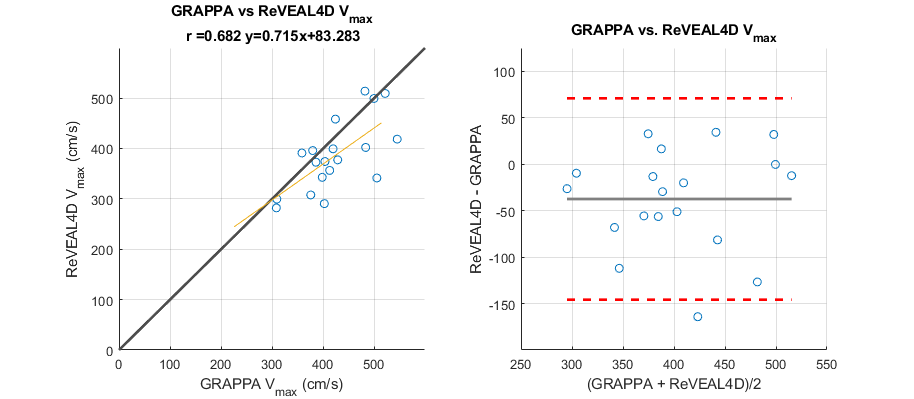
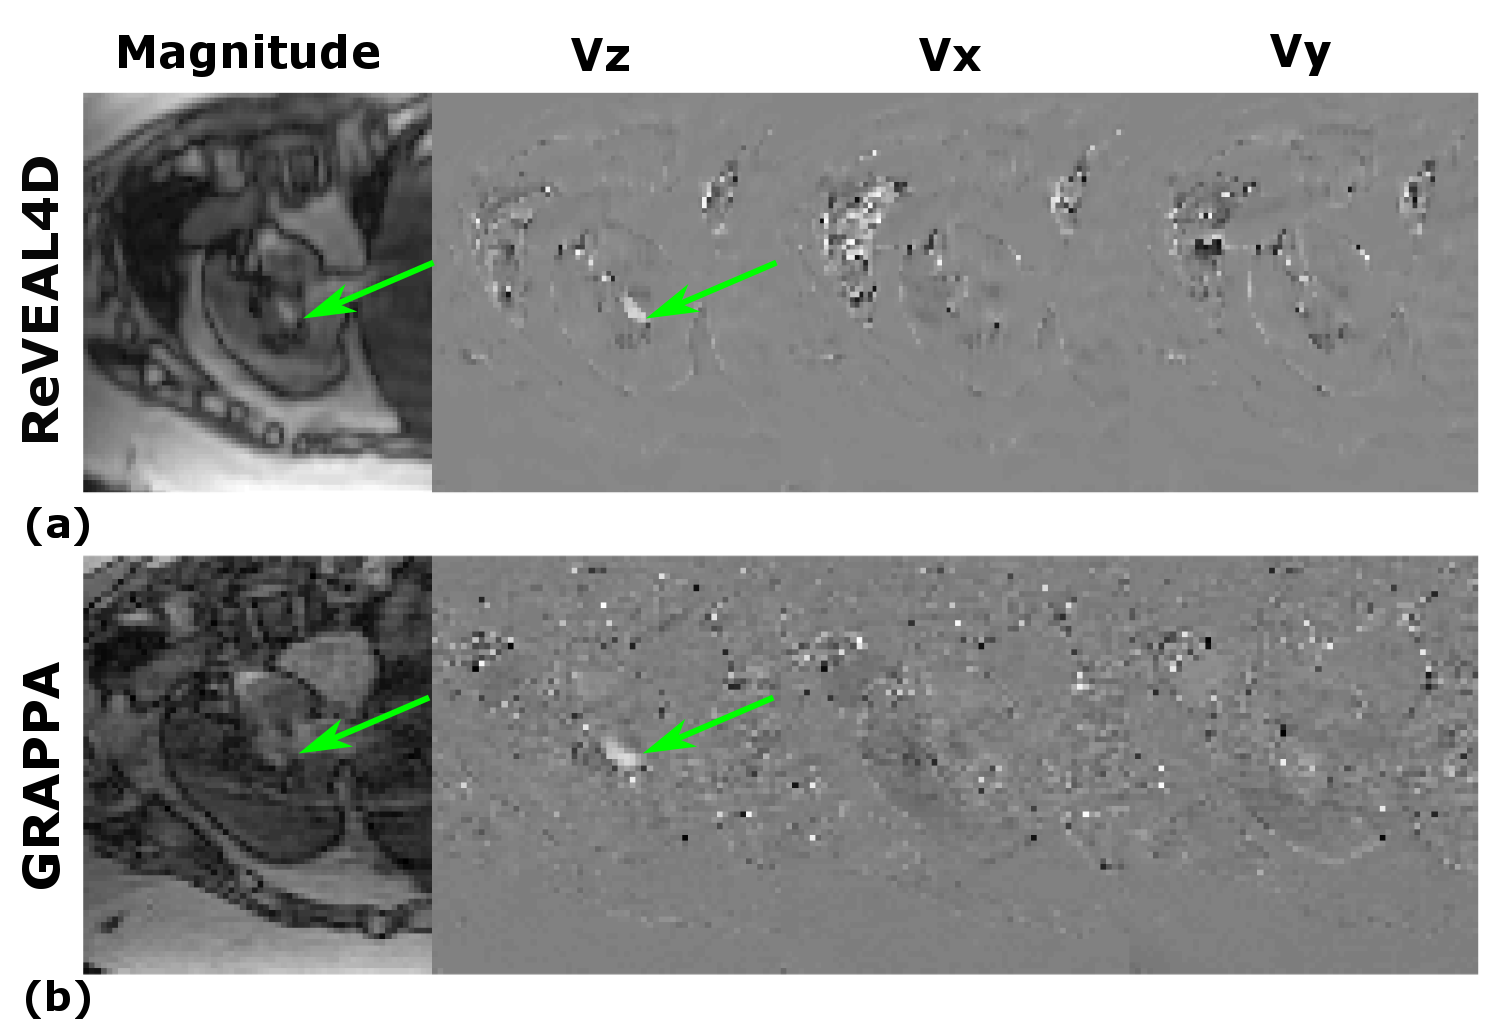
Statistics comparing ReVEAL4D and TTE are shown in Figure 1. Vmax estimated using ReVEAL4D is in good agreement (r = 0.643) with TTE. In Figure 2, the statistics comparing Vmax estimated from ReVEAL4D and GRAPPA are shown. ReVEAL4D shows stronger agreement with GRAPPA (r=0.682) than with TTE. Comparison between TTE and GRAPPA is shown in Figure 3. GRAPPA and TTE show the strongest agreement (r=0.843). However, GRAPPA consistently overestimates the peak velocity and takes 20-30 times longer to acquire. Representative magnitude and velocity maps from GRAPPA and ReVEAL4D reconstructions for a single slice are shown in Figure 4.Discussion and Conclusion
We have demonstrated the feasibility of quantifying Vmax in a single breath hold using 4D flow imaging. Future work will explore additional AVS biomarkers calculated from single breath-hold acquisitions, such as effective valve area and peak pressure gradient across the aortic valve.Acknowledgements
This work was funded in part by NIH projects R21EB021655 and R01HL135489. The Tesla K40 used for this research was donated by the NVIDIA Corporation. RA and OPS receive research support from Siemens Healthineers. OPS receives funding support from The Robert F. Wolfe and Edgar T. Wolfe Foundation.References
[1] Senior R, Dwivedi G, Hayat S, Lim TK. Clinical benefits of contrast-enhanced echocardiography during rest and stress examinations. Eur J Echocardiogr. 2005;6 Suppl 2:S6–13.
[2] Rich A., Potter L. C., Jin N., et al. A Bayesian approach for 4D flow imaging of aortic valve in a single breath‐hold. Magn Reson Med. 2018;00:1–14. https://doi.org/10.1002/mrm.27386
Figures