1992
Hemodynamics of Severely Stenosed Carotid Artery before and after Endarterectomy by 4D Flow MRI with a High Spatiotemporal ResolutionDon-Gwan An1, Seungbin Ko1, Jeesoo Lee1,2, Jee-Hyun Cho3, Doosang Kim4, Sang Hyung Lee5, and Simon Song1,2
1Dept. of Mechanical Engineering, Hanyang University, Seoul, Korea, Republic of, 2Institute of Nano Science and Technology, Hanyang University, Seoul, Korea, Republic of, 3Bioimaging Research Team, Korea Basic Science Institute, Cheongju, Korea, Republic of, 4Dept. of Thoracic and Cardio-vascular Surgery, Veterans Health Service Medical Center, Seoul, Korea, Republic of, 5Dept. of Neurosurgery, SMG-SNU Boramae Medical Center, Seoul National University College of Medicine, Seoul, Korea, Republic of
Synopsis
In vitro 4D flow MRI measurements were performed for patient-specific carotid artery phantoms subject to a pulsatile flow before and after carotid endarterectomy (CEA) to secure a high-spatiotemporal resolution of 0.35 mm and 0.025 sec. As a result, we observed that the flow rate ratio of
Introduction
The relationship between vascular hemodynamic behavior and the pathological features of vascular atherosclerosis, such as onset, progression, rupture, remodeling, etc has been studied for decades1-6 often by numerical simulations7-9 or in vivo 4D flow MRI10-12. However, patient-specific, detailed hemodynamic changes before and after CEA with and without patch repairs have not been investigated. We propose in vitro 4D flow MRI along with a 3D-printed, patient-specific phantom subject to a pulsatile flow rather than in vivo study because uncovering the hemodynamic changes in detail requires a high spatiotemporal resolution and a relatively long scan time. We aim to analyze the changes in the volumetric hemodynamic features in terms of NTA|WSS|, oscillatory shear index (OSI), abnormal (stenosis-prone or high shear) regions, etc.Methods
The rigid and real-sized carotid phantom sets were fabricated with a 3D printer using CT angiography of two patients (Figure 1). Each set consists of pre-operative, post-operative (one week after CEA), and contralateral carotid phantom of a patient. One patient was repaired with a patch and the other without a patch. We set a custom-made closed-loop flow circuit to generate a patient-specific pulsatile flow. A glycerin aqueous solution matching a human blood viscosity was used as a working fluid. Volumetric, time-resolved flow visualization was performed with a high-spatiotemporal resolution of 0.3 mm and 0.25 sec by using a 4.7 T MRI machine (BioSpec 47/40, Bruker).Results
The abnormal region was displayed for the two patients in Figure 2. It was defined as a region satisfying the condition of a continuous high-shear region (NTA|WSS| > 0.25 and OSI < 0.05) or a chaotic low-shear region (i.e., stenosis-prone region, NTA|WSS| < 0.05 and OSI > 0.15)9. A large abnormal region of post CEA (Figure 3) is attributed to a recirculation motion in the ICA bulb (Figure 4). It is caused by a sudden volumetric expansion in the ICA bulb of the patch case. However, it appears to be much greater in the patch case than the other although the angles between CCA and ICA are similar for the two cases (153° vs 152°). The 4D flow imaging revealed that this could be attributed to the expansion of ICA bulb in the lateral plane in the patch case (Figure 4). Due to the large recirculation motion, the flow is inhibited to ICA despite the large lumen in the patch case. As a result, the flow rate ratio of ICA to CCA is only 26.72 % in the patch case while it recovers to almost 50 % in the no-patch case (Figure 5).Discussion
An important finding in the study is that the large recirculation motion could block the flow passage into ICA despite a large lumen, resulting in a small fraction of flow rate into ICA (Figure 5). We found that the recirculation motion persists during the entire cardiac cycle (omitted for simplicity). This implies that hemodynamic features may not be improved as much as expected with angiography only. It should be emphasized that we are not questioning the utility of the patch itself, but the presence of a recirculation motion due to an abruptly widened ICA bulb may lead to re-stenosis in future, and we do not imply that the recirculation should be eliminated completely because it is a common phenomenon in a branching or abruptly changing flow passage and is often found in healthy carotids. We insist that a patient-specific, detailed hemodynamic investigation would help the prognosis of CEA and in vitro measurements help to improve the accuracy of hemodynamic parameter estimations due to its high spatiotemporal resolution. Finally, the implication and clinical significance of the study should be elucidated further with a large cohort study and a long term follow-up.Conclusion
We investigated the hemodynamics of severely stenosed carotid arteries before and after CEA with and without patch repair by 4D flow MRI. Patient-specific, real-sized, solid carotid phantoms and a closed-loop flow circuit were prepared to perform in vitro experiments with a high spatiotemporal resolution. An abnormal region indicated that the patch repair case led to a noticeably larger region of chaotic low shear than either contralateral carotid phantoms or no-patch case due to the presence of a large recirculation zone in the ICA bulb of the patch/postoperative carotid. Moreover, we found that the recirculation motion blocks the flow into ICA allowing only 26.7 % of the flow rate from CCA into ICA. The results obtained with more cohorts (four or six patients) will be presented in the symposium.Acknowledgements
This work was supported by the National Research Foundation of Korea (NRF) grant funded by the Korea government (No. 2016R1A2B3009541 and 2012R1A6A1029029).References
- Caro C, Fitz-Gerald J, Schroter R. Atheroma and arterial wall shear-Observation, correlation and proposal of a shear dependent mass transfer mechanism for atherogenesis. Proc R Soc Lond B 1971;177:109-33.
- Ku DN, Giddens DP, Zarins CK, Glagov S. Pulsatile flow and atherosclerosis in the human carotid bifurcation. Positive correlation between plaque location and low oscillating shear stress. Arteriosclerosis, Thrombosis, and Vascular Biology 1985;5:293-302.
- Malek AM, Alper SL, Izumo S. Hemodynamic shear stress and its role in atherosclerosis. JAMA 1999;282:2035-42.
- Markl M, Kilner PJ, Ebbers T. Comprehensive 4D velocity mapping of the heart and great vessels by cardiovascular magnetic resonance. J Cardiovasc Magn Reson 2011;13:7.
- Hays AG, Iantorno M, Schar M, et al. Local coronary wall eccentricity and endothelial function are closely related in patients with atherosclerotic coronary artery disease. J Cardiovasc Magn Reson 2017;19:51.
- Harloff A, Mirzaee H, Lodemann T, et al. Determination of aortic stiffness using 4D flow cardiovascular magnetic resonance - a population-based study. J Cardiovasc Magn Reson 2018;20:43.
- Conti M, Long C, Marconi M, Berchiolli R, Bazilevs Y, Reali A. Carotid artery hemodynamics before and after stenting: A patient specific CFD study. Computers & Fluids 2016;141:62-74.
- Guerciotti B, Vergara C, Azzimonti L, et al. Computational study of the fluid-dynamics in carotids before and after endarterectomy. J Biomech 2016;49:26-38.
- Harrison GJ, How TV, Poole RJ, et al. Closure technique after carotid endarterectomy influences local hemodynamics. J Vasc Surg 2014;60:418-27.
- Markl M, Wallis W, Harloff A. Reproducibility of flow and wall shear stress analysis using flow-sensitive four-dimensional MRI. J Magn Reson Imaging 2011;33:988-94.
- van Ooij P, Powell AL, Potters WV, Carr JC, Markl M, Barker AJ. Reproducibility and interobserver variability of systolic blood flow velocity and 3D wall shear stress derived from 4D flow MRI in the healthy aorta. J Magn Reson Imaging 2016;43:236-48.
- Dyverfeldt P, Hope MD, Sigovan M, Wrenn J, Saloner D. Reproducibility of quantitative analysis of aortic 4D flow data. J Cardiovasc Magn Reson 2013;15:P126.
Figures
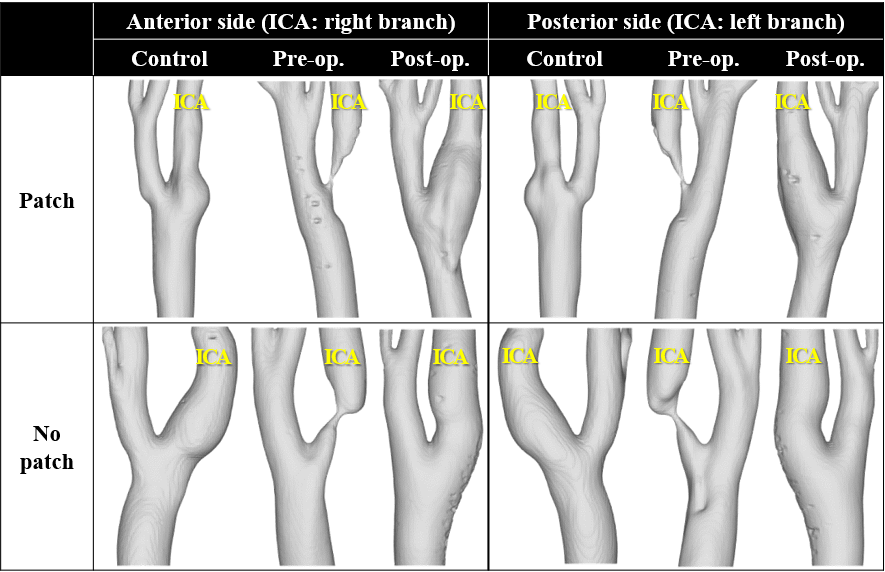
Figure 1. Reconstructed
carotid geometries from 4D flow MRI measurements. The contralateral carotid was
selected as the control for each patient. 4D = four-dimensional; ICA = internal
carotid artery; MRI = magnetic resonance imaging; Post-op. = postoperative
carotid; Pre-op. = preoperative carotid.
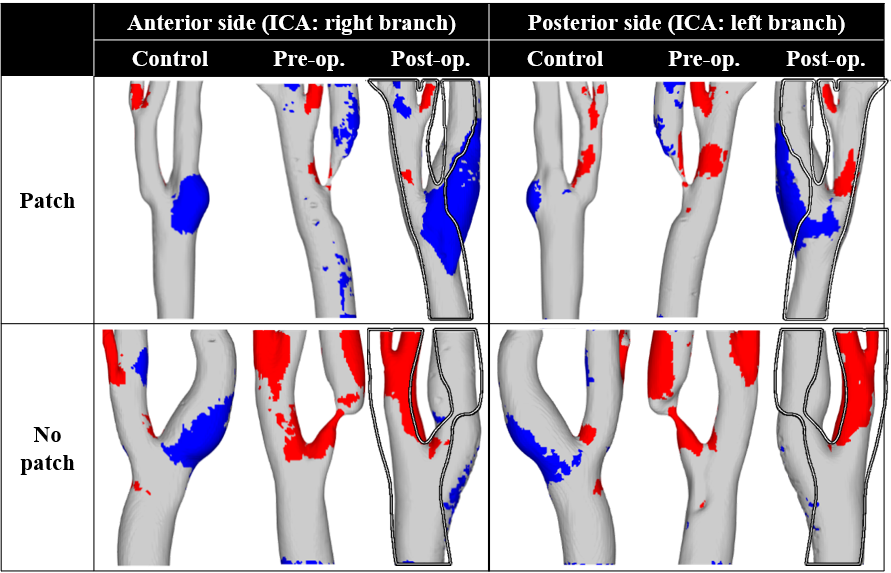
Figure 2. Contour plot of the abnormal region. The red region indicates a continuous high shear region (NTA|WSS|>0.25 and OSI<0.05) and the blue region shows a stenosis-prone region (NTA|WSS|<0.05 and OSI>0.15). The hollow line in the postoperative carotid cases represents an outline of the preoperative carotid shape. NTA|WSS| = normalized time-averaged wall shear stress; OSI = oscillatory shear index; other abbreviations as in Figure 1.
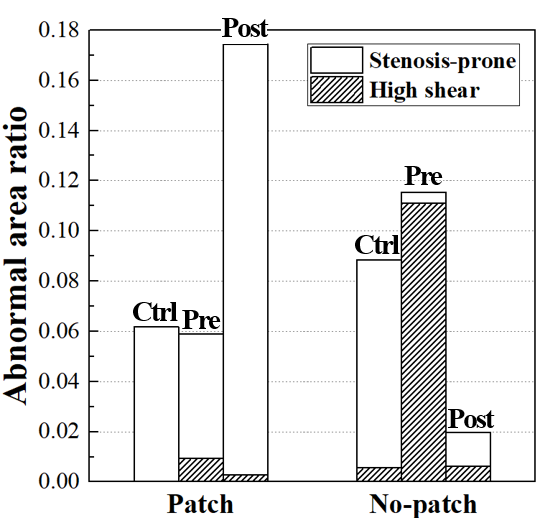
Figure 3. Area ratio of the abnormal region to the surface summation of internal carotid artery and common carotid artery.
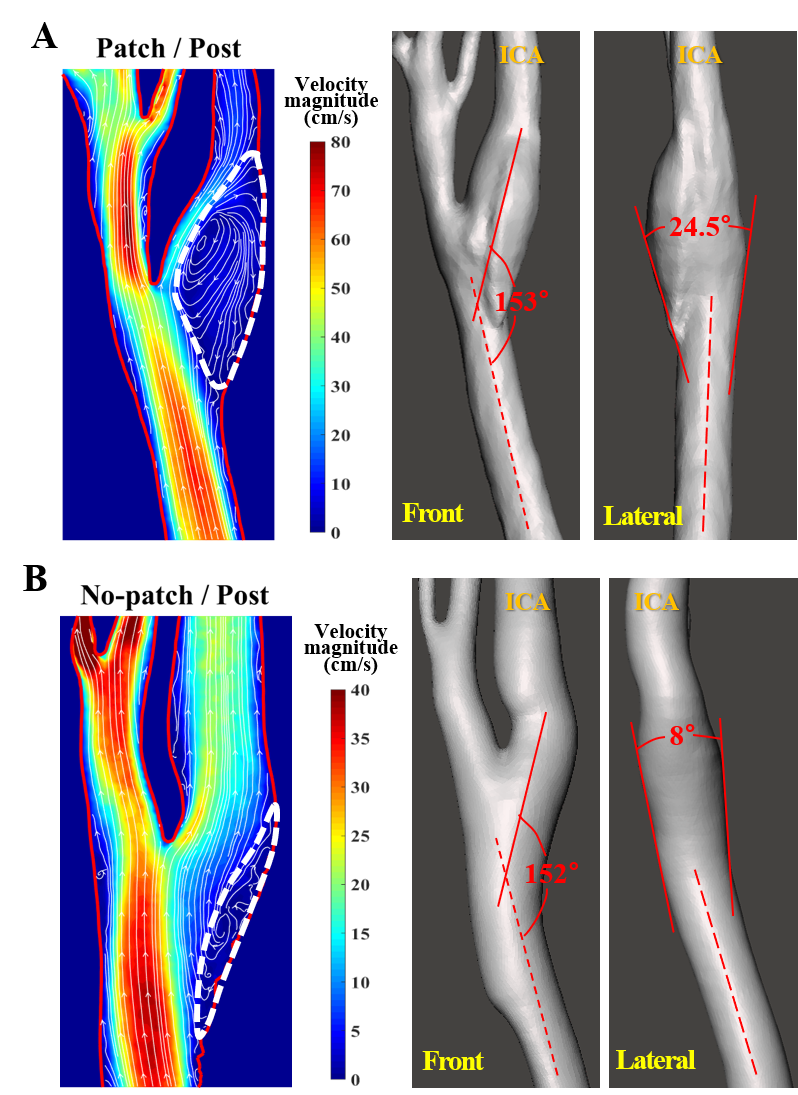
Figure 4. Streamlines at the peak flow rate and ICA-CCA spread angle in the (A) patch and (B) no-patch cases. Only post-operative carotids are presented for simplicity. The velocity magnitude contour is shown alongside the streamline plot. The recirculation zone of ICA is indicated with a white dotted line in the streamline plot. CCA = common carotid artery; ICA = internal carotid artery.
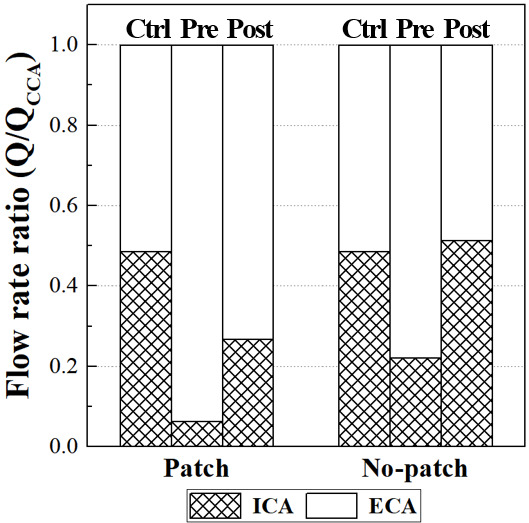
Figure
5. Flow
rate ratio of carotid branches. The ratio is calculated by normalizing the mean
flow rate of each carotid branch by the mean CCA flow rate. ECA = external
carotid artery; other abbreviations as in Figure 4.