1990
Hemodynamic Evaluation for Idiopathic Pulmonary Artery Hypertension Patients Using 4D Flow MRI1Center for Biomedical Imaging Research, Department of Biomedical Engineering, Tsinghua University, Beijing, China, 2Lab of Imaging Processing and Analysis, Depart of Biomedical Engineering, Yale University, New Haven, CT, United States, 3Department of MR, Shijitan Hospital of Capital Medical University, Beijing, China, 4Vascular Imaging Laboratory, Department of Radiology, University of Washington, Seattle, WA, United States
Synopsis
We collected 4D flow MRI data and right heart catheterization (RHC) data from 20 idiopathic pulmonary artery hypertension (IPAH) patients and applied parameter analysis. The results indicate the difference of the flow characteristics in the main pulmonary artery (MPA) between the patients with right ventricle (RV) function loss and the patients with normal RV function. To conclude, 4D flow MRI is a good tool to detect hemodynamics and has the potential to assist in evaluating the state and the curative effect of IPAH.
Introduction
Pulmonary hypertension (PH) is a condition of increased blood pressure within the pulmonary arteries. PH has been defined as a resting mean pulmonary arterial pressure (mPAP) >25 mm Hg, or an mPAP with exercise >30 mm Hg1,2. As a subgroup, idiopathic pulmonary artery hypertension (IPAH) refers to the cases with high pressure in pulmonary arteries without known causes2,3. The estimated prevalence of IPAH is about 6 cases per million1,3. Right ventricular (RV) function is the most important determinant of longevity in patients with IPAH, which can be evaluated by cardiac output (CO)4. The normal range of CO is 4-8 L/min5. At the beginning of the disease, the CO of the patients may keep in the normal range in the presence of an increase of the afterload, depending on systolic function adaptation with secondary diastolic changes and altered RV-left ventricle (LV) interactions6,7. With the development of the disease, the CO begin to drop due to the exhaustion of the adaptation mechanisms, finally leading to RV failure6,7. The property of RV continues to change during the process, which may result in the change of the flow characteristics in the main pulmonary artery (MPA).
The diagnosis of IPAH depends on right heart catheterization (RHC) in clinical practice. However, it is an invasive approach requiring accurate operation with potential risks, and not feasible to evaluate the prognosis of IPAH at multiple time points. 4D flow MRI is a powerful tool to assess hemodynamic parameters. In this study, we divided the IPAH patients into 2 groups according to the CO values and did data analysis individually. We aim to find the correlation of hemodynamic parameters measured by 4D flow MRI and RHC and to find the difference between the 2 groups.
Methods
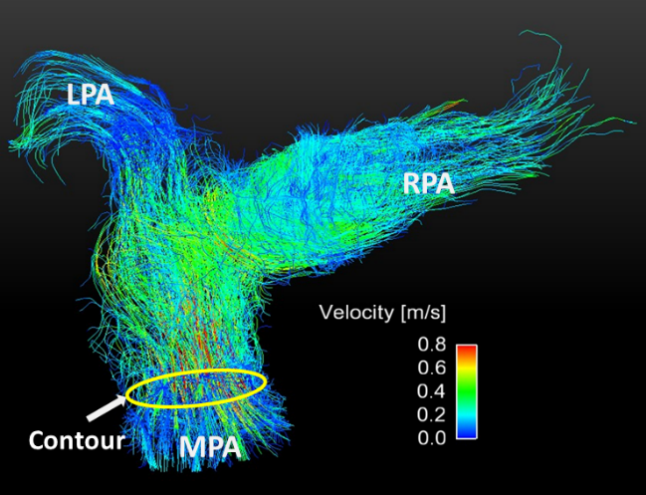
A total of 20 patients with IPAH (diagnosed with RHC) (11 patients with normal CO values (4-8L/min), 9 patients with abnormal CO values (<4L/min)) underwent 4D flow MRI. 4D flow MRI data were calculated and processed with GTFlow (Gyrotools, Zurich, Switzerland). Velocity and flow information can be extracted from 4D flow MRI data. The mean velocity (MV) (the mean blood velocity within a contour in the MPA in a cardiac cycle), the reflux ratio (RR) (the proportion of backflow in total flow within a contour in the MPA in a cardiac cycle) and CO were measured from the 4D flow MRI data. (Figure 1) Besides, mPAP, pulmonary vascular resistance (PVR) and CO were measured by RHC for the patients before the MRI scan. For both groups, we did Pearson correlation analysis between hemodynamic parameters calculated from 4D flow MRI and measured by RHC individually. Additionally, we did Pearson correlation analysis between the CO from 4D flow MRI and the CO from RHC for all the patients.Results
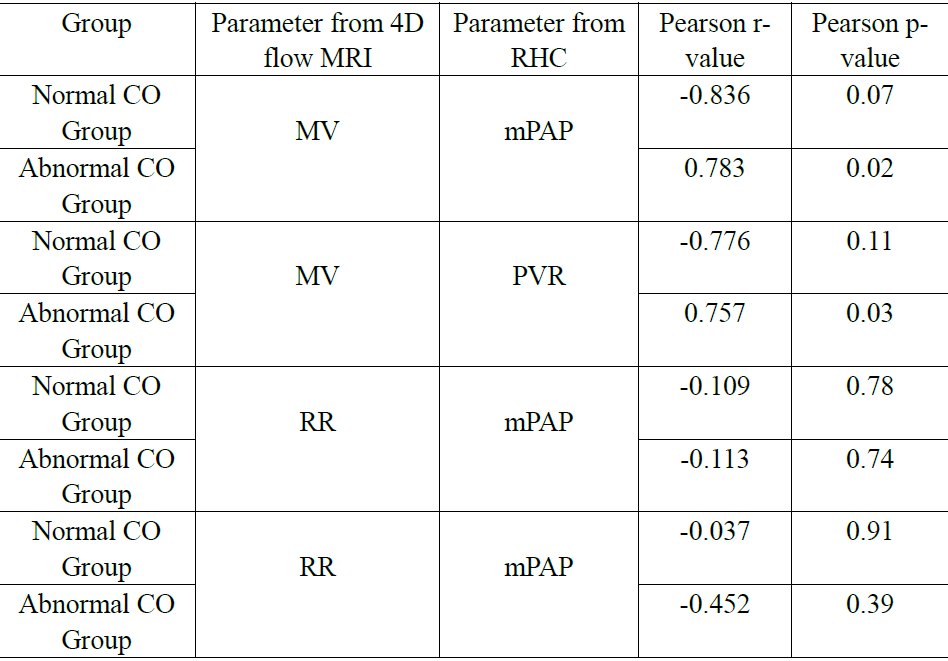
The results (Table 1) show that for the patients with RV function loss (CO<4L/min), MV is significantly positively correlated with mPAP and PVR, while for the patients with normal CO values, MV is not significantly correlated with mPAP and PVR. For both groups, RR values have no significant correlation with parameters from RHC.
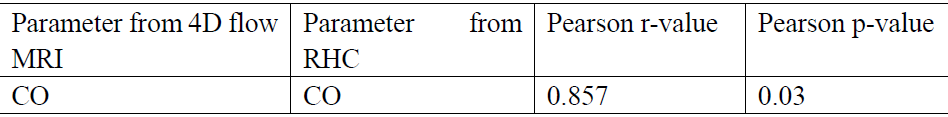
The result (Table 2) show that the CO from the 4D flow data has a significant positive correction with the CO from RHC.
Discussion
As the results show, for the patients with RV function loss (CO<4L/min), higher mPAP/PVR can result in higher MV. This could happen because of the exhaustion of the heart adaptation mechanisms. Meanwhile, for the patients with normal RV function, as the heart can adapt to the elevated mPAP/PVR, the MV can remain stable to a certain degree. Additionally, The CO derived from the 4D flow MRI data is reliable thus could be helpful to evaluate the RV function and the curative effect, according to the result.Conclusion
Our work indicates the difference of the flow pattern in MPA with the development of the disease, which may help to better understand the pathology and pathophysiology of IPAH. Moreover, 4D flow MRI is powerful to detect hemodynamics, which has the potential to assist in evaluating the state and the curative effect of IPAH.Acknowledgements
No acknowledgement found.References
1. Badesch, D. B., et al. Diagnosis and assessment of pulmonary arterial hypertension. Journal of the American College of Cardiology. 2009:S55-S66.
2. "What Is Pulmonary Hypertension? – NHLBI, NIH". NHLBI.
3. Freed B H, Collins J D, François C J, et al. MR and CT Imaging for the Evaluation of Pulmonary Hypertension[J]. Jacc Cardiovascular Imaging, 2016, 9(6):715-73
4. Voelkel NF, Quaife RA, Leinwand LA, Barst RJ, Mcgoon MD, Meldrum DR, et al. Right ventricular Function and Failure. Circulation. 2006; 114(17):1883-91
5. “Normal Hemodynamic Parameters and Laboratory Values”. Edwards Lifesciences LLC
6. Grignola JC. (2011). Hemodynamic assessment of pulmonary hypertension. World Journal of Cardiology, 3(1), 10-17.
7. Naeije R, Huez S. Right ventricular function in pulmonary hypertension: physiological concepts. Eur Heart J 2007; 9 Suppl:H5-H9
Figures