1989
Toward a new Aneurysm Classification Framework: Initial Report on Stationary Spatial Blood Flow Pattern in Small Intracranial Aneurysms based on Submillimetric 4D Flow MRA at 7Tesla1Center for Magnetic Resonance Research, University of Minnesota, Minneapolis, MN, United States, 2Department of Aerospace Engineering and Mechanics, University of Minnesota, Minneapolis, MN, United States, 3Department of Neurosurgery, University of Minnesota, Minneapolis, MN, United States, 4St. Anthony Falls Laboratory, University of Minnesota, Minneapolis, MN, United States, 5Department of Radiology, University of Minnesota, Minneapolis, MN, United States, 6Department of Neurology, University of Minnesota, Minneapolis, MN, United States
Synopsis
Asymptomatic sub 7mm intracranial aneurysms pose a difficult therapeutic challenge: left untreated these sub 7mm aneurysms may remain stable, but they also have the potential to grow in size or rupture causing a devastating subarachnoid hemorrhage (SAH). Pre-emptive treatment (surgical or endovascular) however carries non-negligible morbidity and mortality risks, which often are greater than the risk of rupture if left untreated. Here introduce the use of stationary flow patterns for a robust analysis of sub millimetric 4D Flow MRI .
Introduction
Despite multiple attempts to identify biomarkers, very little is known regarding the risk of spontaneous rupture/bleeding of small (<7mm) intracerebral aneurysm, leaving surgeons and neuroradio-interventionists facing difficult dilemma between a proactive therapeutic approach, exposing patients to the risks of surgical or endovascular treatment that may not be necessary, and a follow-up approach, exposing patients to the risks of life threatening spontaneous rupture/bleeding that may have been underestimated. Recently developed non-invasive 4D Flow MRA provides quantitative flow measures, giving hope that biomarkers may be identified to predict the risk of spontaneous rupture in small (<7mm) intracerebral aneurysms. Some challenges complicate this endeavour. Firstly high spatial resolution is necessary to sample flow profiles through small vessels. We demonstrated that 4DFlow at Ultra High Field (UHF), benefiting from SNR gains, provides conspicuity in aneurysms as small as 2-3 mm. Another not often discussed challenge is the difficulty to handle dynamic 4DFlow series: flow streamlines or wall shear stress are typically shown looping through a movie over ~ 12 to 20 cardiac cycle phases, often with noisier patterns in diastole. Here, building upon joined in-vivo and in-vitro studies, we introduce a new framework to analyze aneurysm 4D Flow data, summarised in ‘signature’ patterns, alleviating dynamic visioning and opening the door to new acquisition schemes.Principle
We showed in vitro that upscaled 3D printed replica of a real small intracranial aneurysms, fed with controlled pumps, can be imaged with 4DFlow MRA at higher resolution, accurately reproducing flow patterns measured in vivo at 7T. A critical finding is the apparent stationarity of relative spatial distribution of flow parameters through the cardiac cycle. Fig. 1 illustrate this observation with a 3X in-vitro replica of a 5mm aneurysm scanned at 7T in a 48 yo subject. It can be seen that when the velocity of each cardiac phase is normalized by its own bulk velocity at the inlet, the spatial distribution of velocity isocontours stay remarkably stable through the entire cardiac cycle. Such spatial stationarity means that all velocity data can be averaged after normalization through the entire cardiac cycle (~12 - 20 phases), carrying the potential for large gains in SNR.Methods
Acquisition
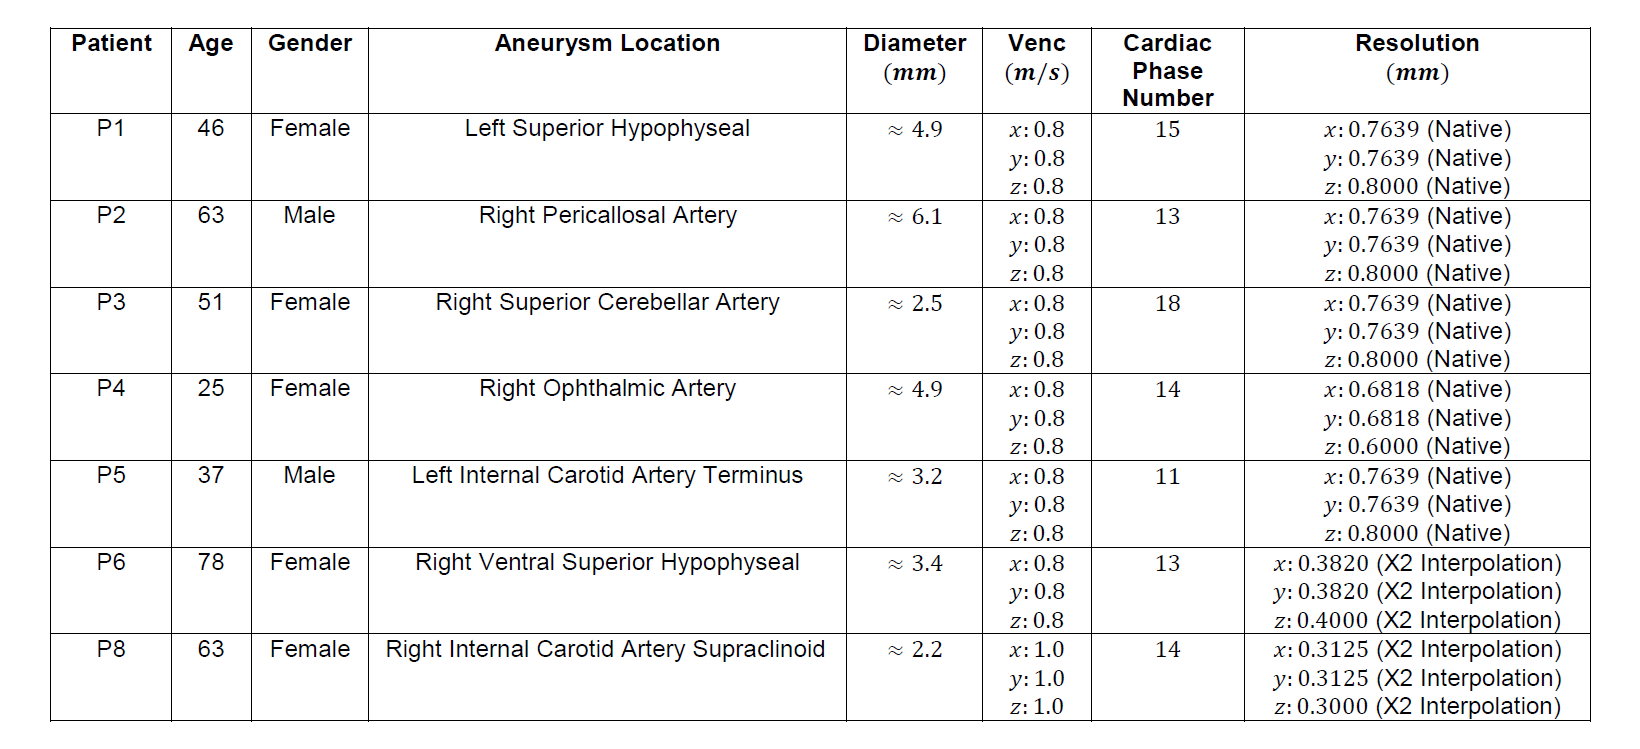
8 adult patients (Table 1) were scanned at 7T (Siemens, Erlangen, Germany) with a 32ch head coil. Three electrodes were attached to the chest for ECG triggering. Time of Flight (TOF) was obtained for lesion localization and vessel masking. A cardiac-gated, 4-points, 3-directional 4D Flow sequence was used to image 3D slab centered on the aneurysm (see parameters Table 1).
Analysis.
Magnitude and Phase DICOM images were transferred and pre-processed in MatlabTM (noise filtering, anti-aliasing, eddy current correction and velocity computation). Vascular masks were generated in MimicsTM and 3-maticTM, based on TOF or on PC-MRA. 3D streamlines were computed in TecplotTM. Wall shear stress (WSS) was computed in MatlabTM and visualized in TecplotTM.
Results
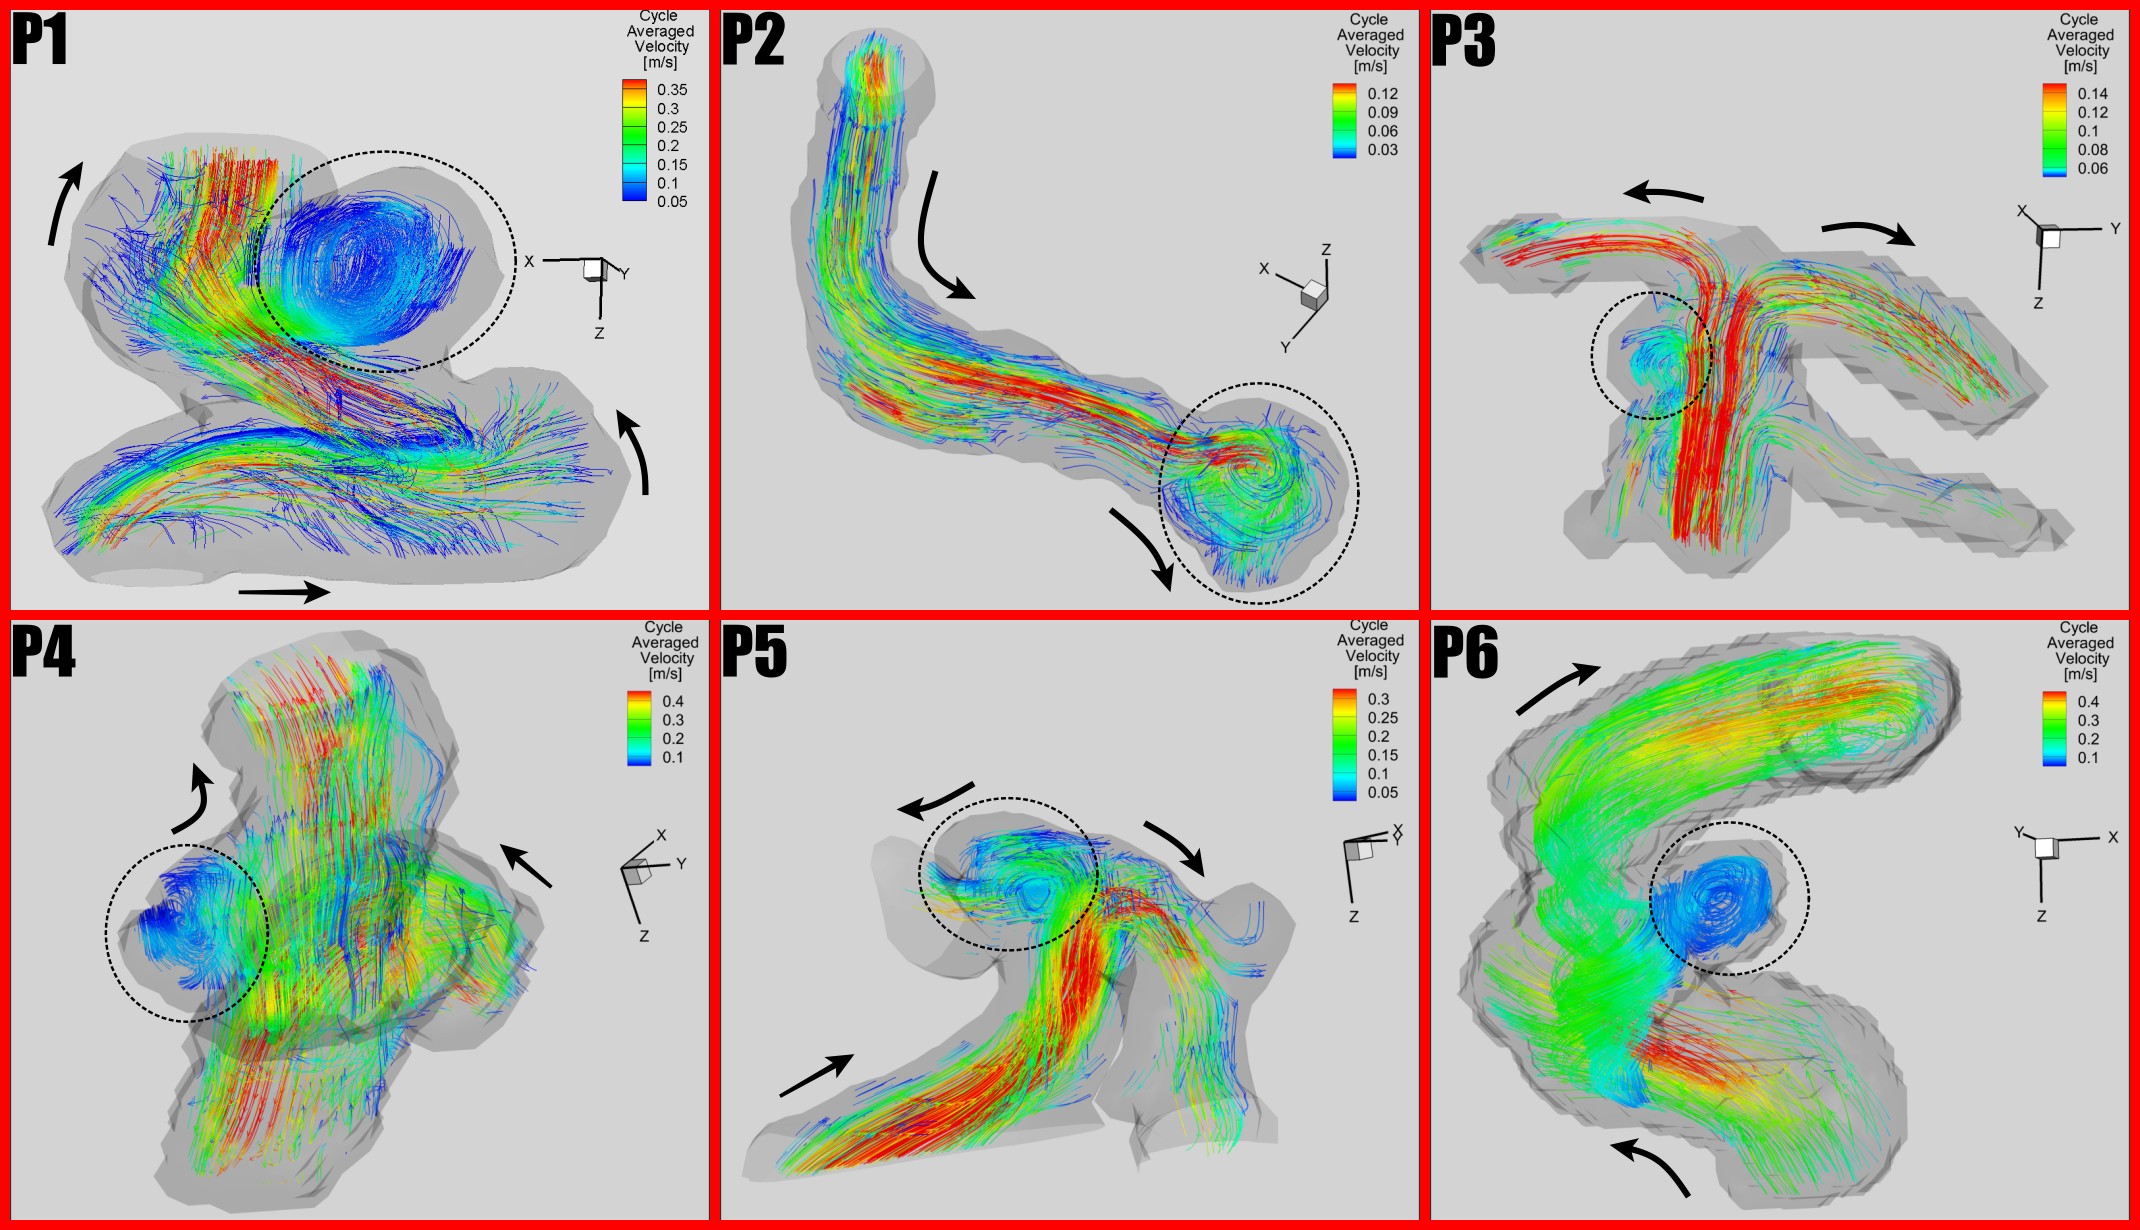
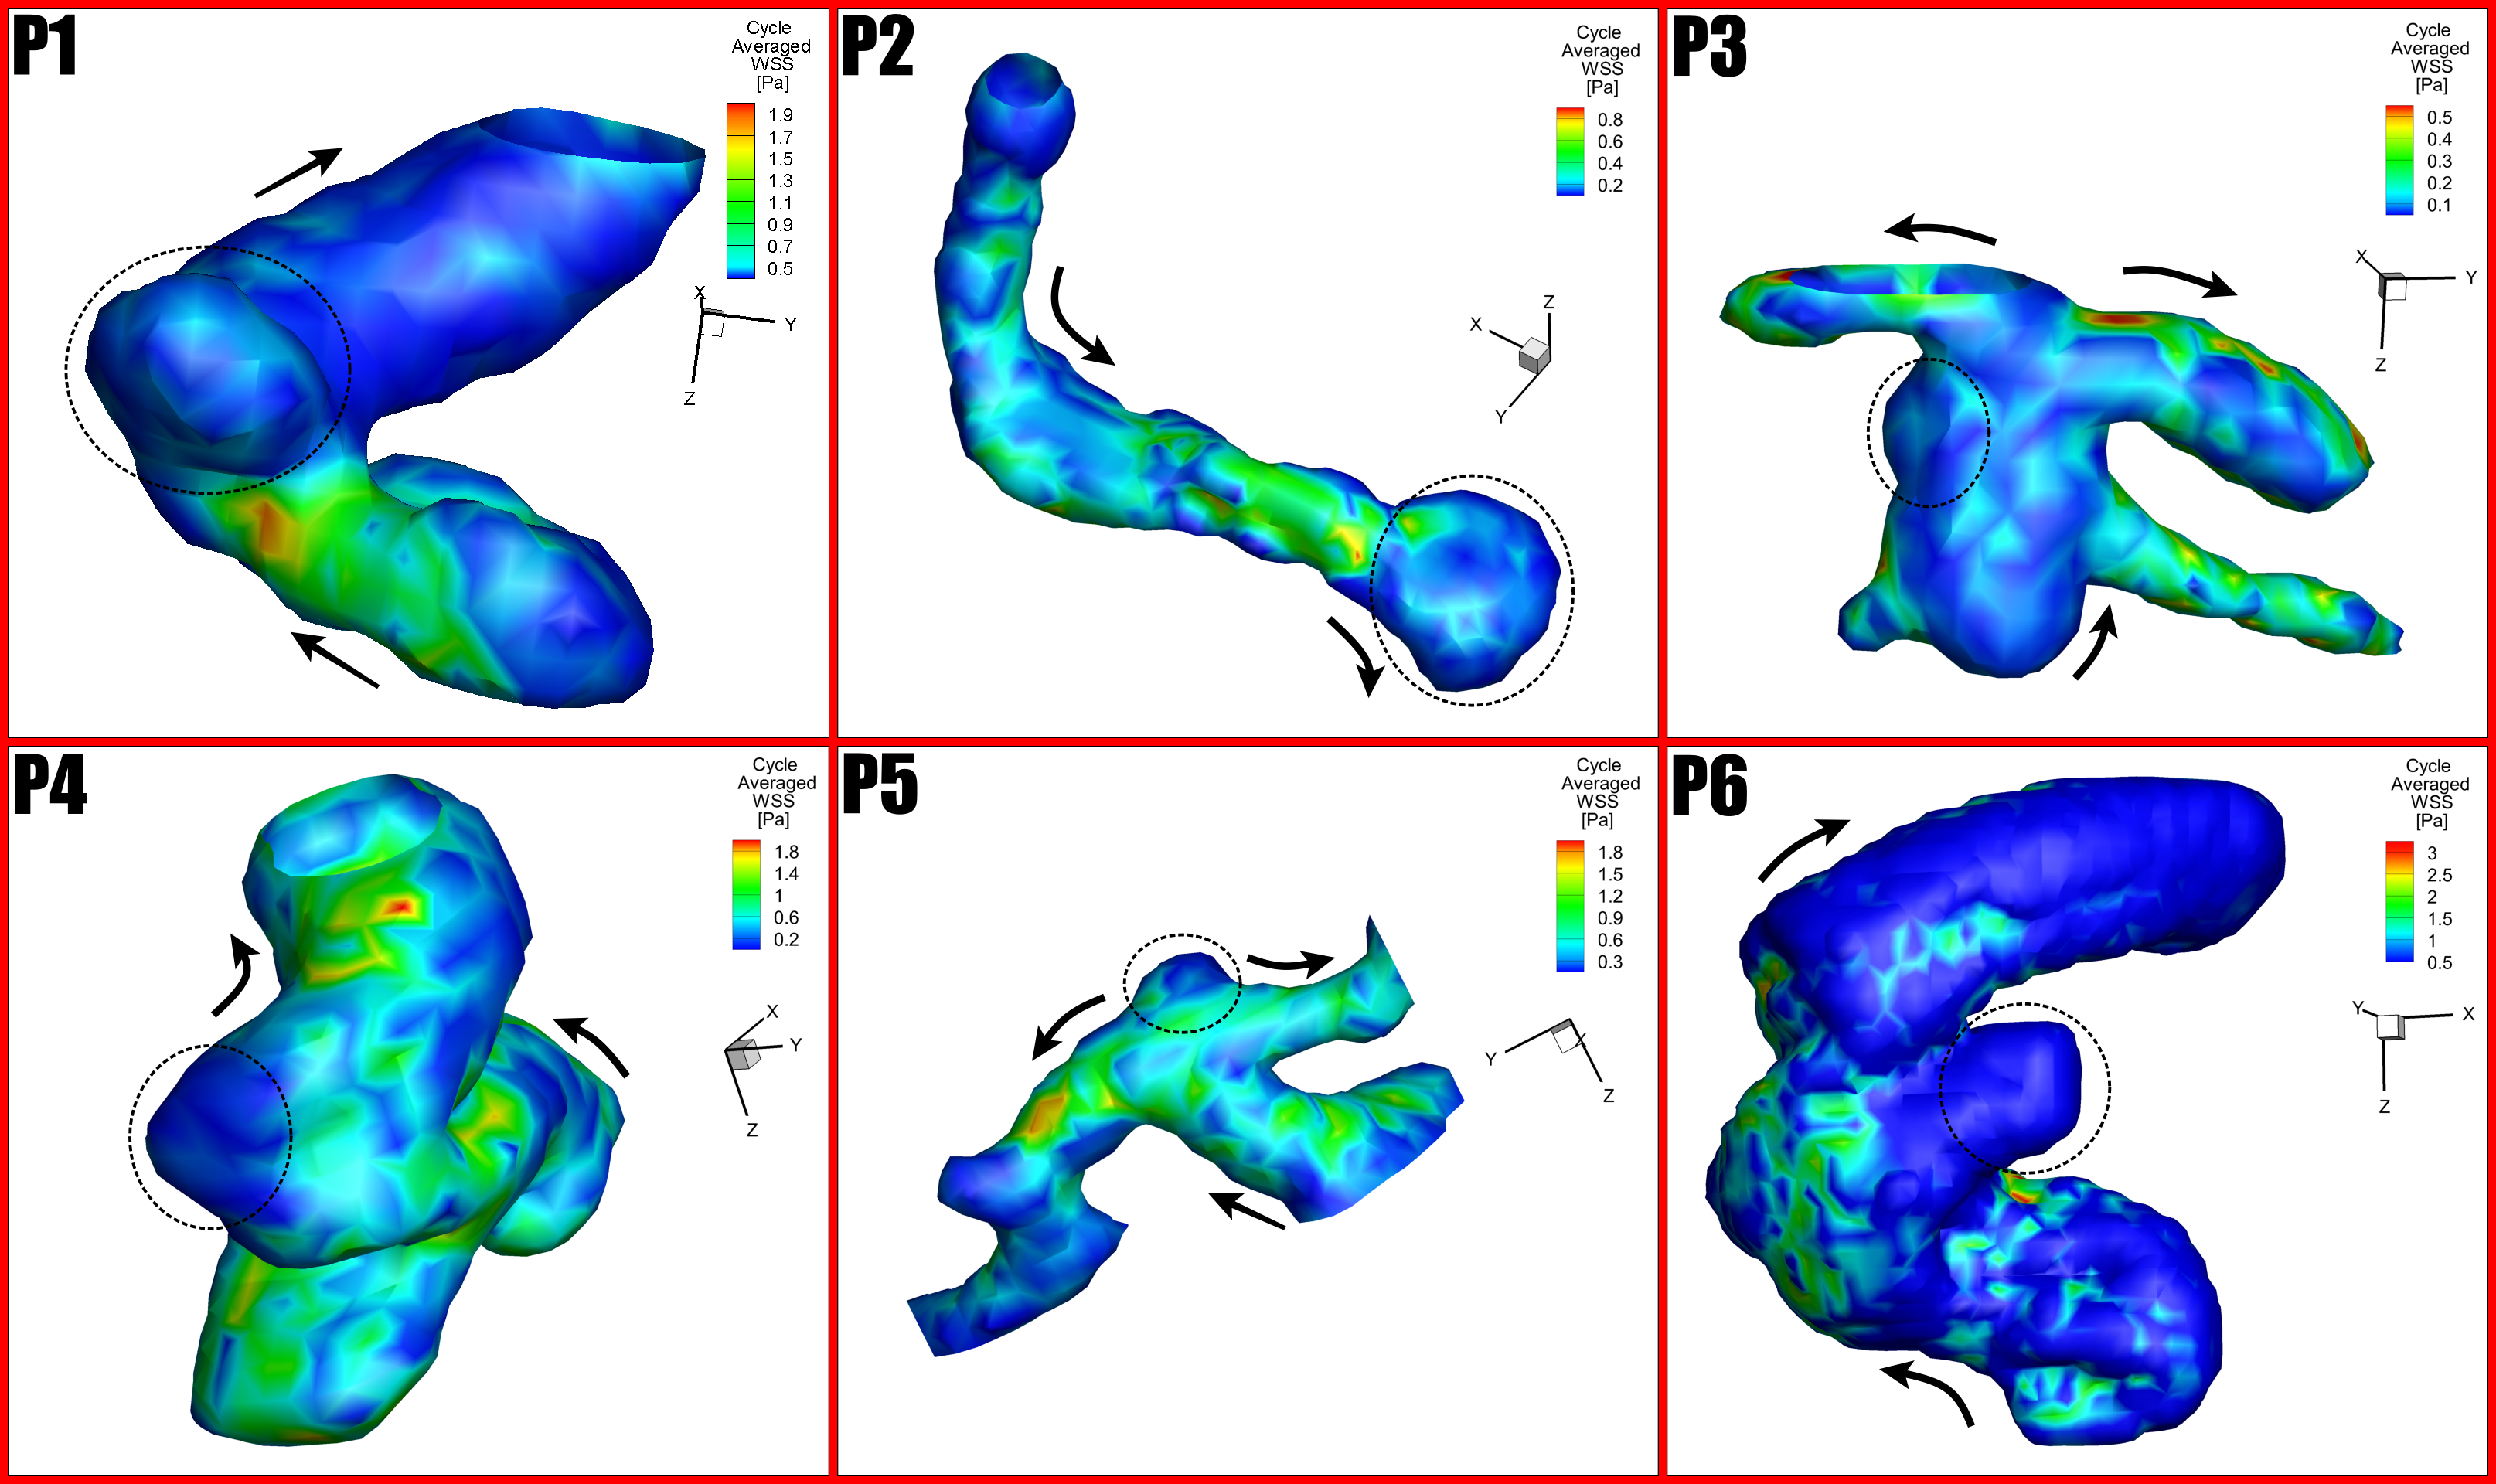
Out of 8 enrolled patients, one (P7, not in table) interrupted the study at mid-scan, the other scans were successful. A subset of these data (3 patients) was presented at ISMRM 2018. In all patients, vortex structure near/inside the aneurysm sac were readily identified in velocity streamlines plots derived from 4DFlow MRI. To assess potential spatial pattern stationarity, for each cardiac cycle velocity vectors were normalized by the corresponding average bulk velocity. As in vitro (not shown) the plots of normalized velocity distribution were remarkably stable through cardiac phases. In Fig. 2, the average of the normalized velocity patterns through all phases is shown for the smallest aneurysm ( 2.2mm), dynamically rescaled with the bulk average velocity of each phase, and compared with the original velocity spatial patterns. As can be seen these two patterns share high similarity through cardiac phases. In Fig. 4 and Fig. 5 are displayed for 6 subjects the averaged spatial pattern of velocity streamline and wall shear stress. In all subject, the averaged pattern was remarkably better defined than that of individual cardiac phases, especially during diastole and and inside the sac, where blood flow is slower in average. For wall shear stress, small areas of relatively high valuestress were often identified.Discussion/Conclusion
Our results suggest that a stationary spatial pattern can summarize blood velocity and wall shear stress measured in 4DFlow MRI. Obtained by averaging data normalized for each phase, these patterns appear to be much better defined and more regularly shaped and may provide a more robust basis for potential biomarker. Corresponding gains in SNR may help pushing spatial resolution or shortening acquisitions.Acknowledgements
Winston and Maxine Wallin Discovery Fund, P41 EB015894, P30 NS076408.
References
[1] B.V. Nahed, M.L. DiLuna, T. Morgan, E. Ocal, A.A. Hawkins, K. Ozduman, K.T. Kahle, A. Chamberlain, A.P. Amar, M. Gunel, Hypertension, age, and location predict rupture of small intracranial aneurysms. Neurosurgery 57.4 (2005): 676-683.
[2] C. Poelma, P. N. Watton and Y. Ventikos, Transitional flow in aneurysms and the computation of haemodynamic parameters, Journal of The Royal Society Interface 12.105 (2015): 20141394.
[3] M. Markl, A. Frydrychowicz, S. Kozerke, M. Hope, and O. Wieben, 4D flow MRI, Journal of Magnetic Resonance Imaging 36.5 (2012): 1015-1036.
[4 ] Amili, O., Schiavazzi, D., Moen, S., Jagadeesan, B., Van de Moortele, P. F. & Coletti, F. Hemodynamics in a giant intracranial aneurysm characterized by in vitro 4D flow MRI. (2018) PloS one 13, e0188323PMID: 29300738 PMCID: PMC5754057
[5]. Schnell S, Markl M, Entezari P, et al. k-t GRAPPA accelerated fourdimensional flow MRI in the aorta: effect on scan time, image quality, and quantification of flow and wall shear stress. Magn Reson Med 2014;72(2):522-33.
[6] PF Van de Moortele, M Toloui, O Amili, S Moen, S Schmitter, S Schenll, M Markl, K Ugurbil, F Coletti, B Jagadeesan. Sub-millimetric 4D Flow MR in small intracerebral aneurysms at 7 Tesla with experimental verification in up-scaled 3D printed replica. ISMRM annual meeting, 16-21 june, Paris
Figures