1988
Turbulent Kinetic energy assessment of HOCM by using Multi-VENC 4D Flow MRI1Radiology, Nippon Medical School, Tokyo, Japan, 2Cardiology, Nippon Medical School, Tokyo, Japan, 3Radiology, Nihon University, Tokyo, Japan, 4Philips Electronics Japan Ltd., Tokyo, Japan
Synopsis
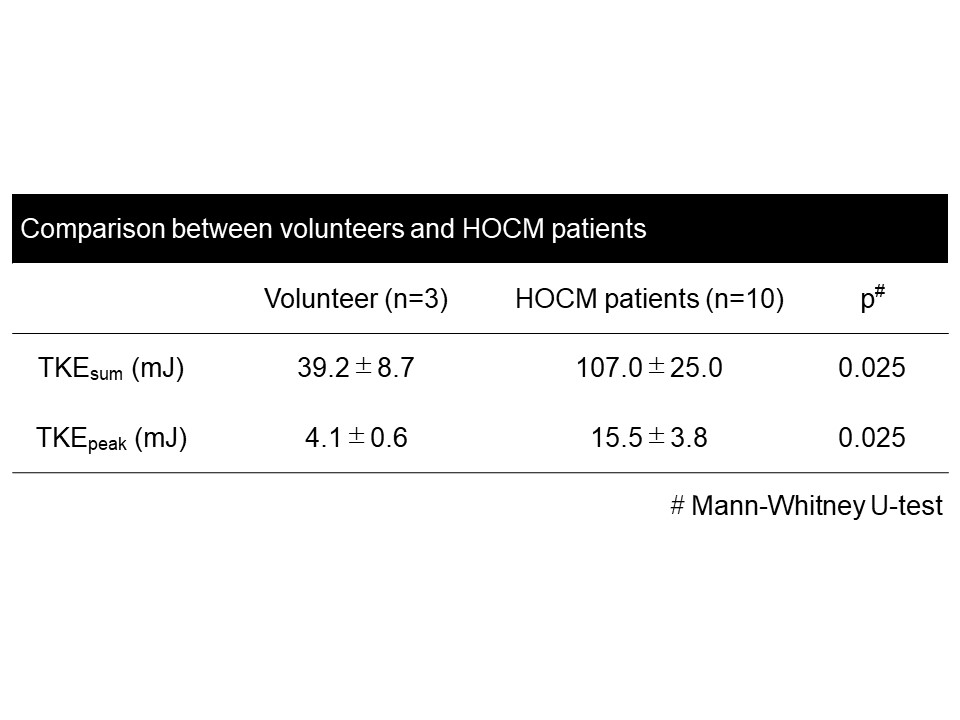
The purpose of this study was to clarify the relationship between TKE derived from 4D Flow MRI and LVOT gradient measured by US in the patients with HOCM. We recruited 3 volunteers, and 10 patients who were diagnosed as HOCM by cardiac ultrasound examination. The TKEsum and TKEpeak of HOCM group were higher than those of volunteers (107.0±25.0mJ vs. 39.2±8.7mJ, p=0.025; 15.5±3.8mJ vs. 4.1±0.6mJ, p=0.025). There was no significant correlation between each two TKE value and LOVT gradient (p=0.203, p=0.556, respectively). The TKE can clearly reveal the flow characteristics of HOCM and may provide different value form established US measurement.
Introduction
The obstruction of LV outflow tract (LVOT) is independently associated with the adverse outcome in patients with hypertrophic obstructive cardiomyopathy (HOCM) (1). The obstruction links to the increase of cardiac loading due to impairing the efficiency of cardiac output. To evaluate this impairment, the pressure gradient (PG) of LVOT is measured by Doppler ultrasound (US) in the clinical setting. However, this method doesn’t take post-stenotic recovery into account, which results in overestimation of disease severity. To overcome the drawback of US, time-resolved 3D phase-contrast (4D Flow) MRI has been tried for the assessment of pressure loss in HOCM patients (2). One previous study suggests that the viscous energy loss in LVOT may relate to disease severity. However, viscous energy loss is sensitive to pixel resolution (3-5). Thus, 4D Flow MRI (pixel ~ 2mm) inherently underestimate that value. Even worse, at the moderate to severe stenosis, viscous energy loss makes relatively smaller contribution to the total pressure loss than turbulent kinetic energy (TKE), the energy stored in turbulent flow (4). Based on the signal drop of magnitude images of 4D Flow MRI due to intra-voxel dephasing, TKE can be calculated through estimating intra-voxel velocity standard deviation (6). This value is not much sensitive to pixel resolution and feasible for 4D Flow MRI (e.g. if the pixel resolution was changed from 0.625 to 2.0mm, <15% error was observed (4)) Recently, Bayesian estimation combined with multi-VENC acquisition have been developed to improve its calculation (7). The purpose of this study was to clarify the relationship between TKE and LVOT gradient.Methods
Patients; We recruited 3 normal volunteers (31.7±3.7 years old, 2 males), and 10 patients (68.0±9.8 years old, 4 males) who were diagnosed as HOCM by cardiac ultrasound examination.
MR acquisition; We performed cardiac MRI including 4D Flow MRI using a 3.0-T MRI unit (Achieva; Philips Healthcare, Best, The Netherlands). The parameters of 4D Flow MRI and are as follows. TR/TE = 4.3/2.7, FA = 11 de grees, Resolution = 1.7*1.7*2.0 mm3; Triple VENC acquisition=50-150-450 cm/s; k-t PCA (acceleration factor, 5-7), cardiac phase 15-21, free breath acquisition; and acquisition time 8-15 min.). TKE was calculated from the magnitude images of multi-VENC data combined with Bayesian estimation by using offline reconstruction software (CRECON, Gyrotools, Zurich, Switzerland). It takes approximately 15 minutes (7).
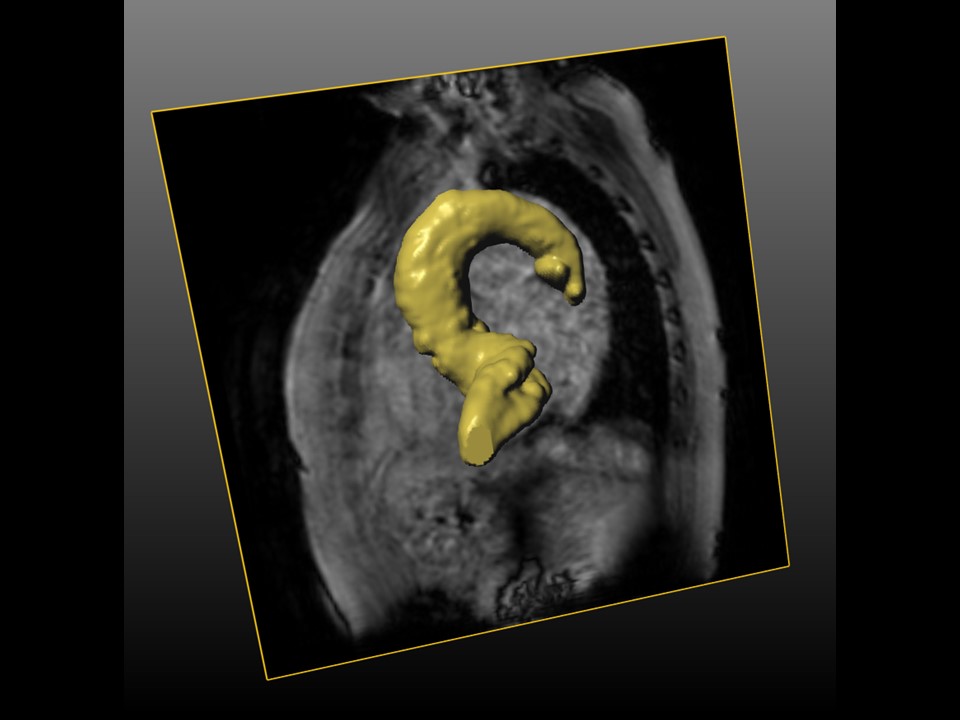
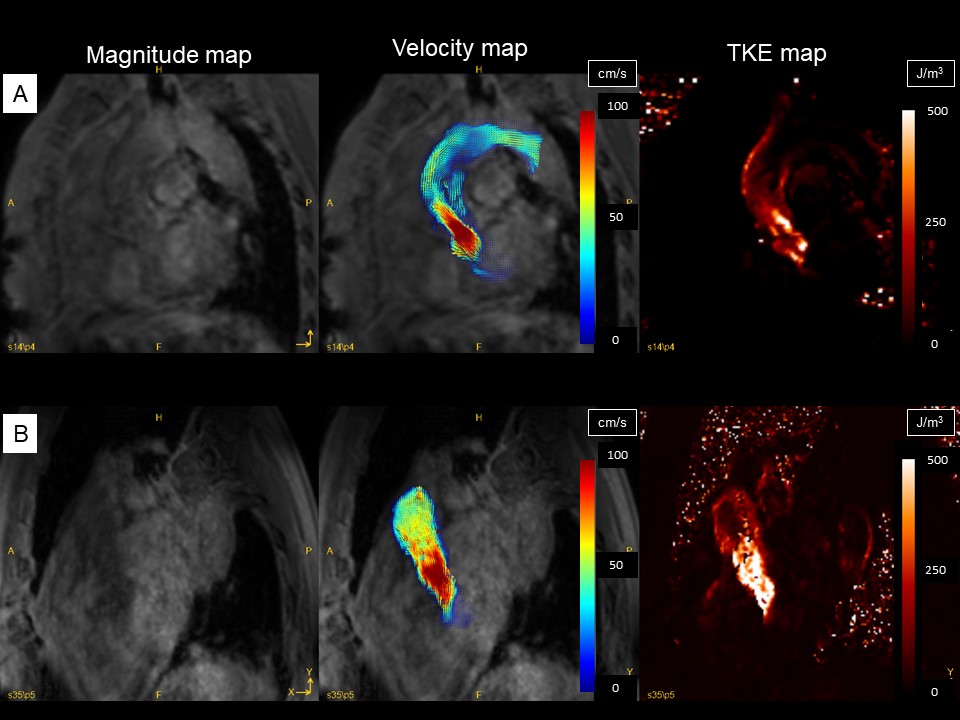
MR analysis; GT Flow (Gyrotools, Zurich, Switzerland) was used. The VOI from left ventricular to aortic arch was drawn semi-automatically based on phase contrast MRA imaging derived from 4D Flow MRI data (Fig. 1). We empirically chose this region because there was no significant TKE increase distal from aortic arch. TKEphase is calculated as the sum of entire VOI at each cardiac phase. TKEpeak was the highest TKEphase in the all cardiac phase. TKEsum was the sum of all TKEphase through the entire cardiac phase.
Statistics; To clarify the blood flow pattern in HOCM patients, each TKEpeak and TKEsum was compared between HOCM and volunteer by using Mann-Whitney U-test. To evaluate the correlation between PG and TKE, each TKEpeak and TKEsum was compared with PG by using Pearson’s test.
Results
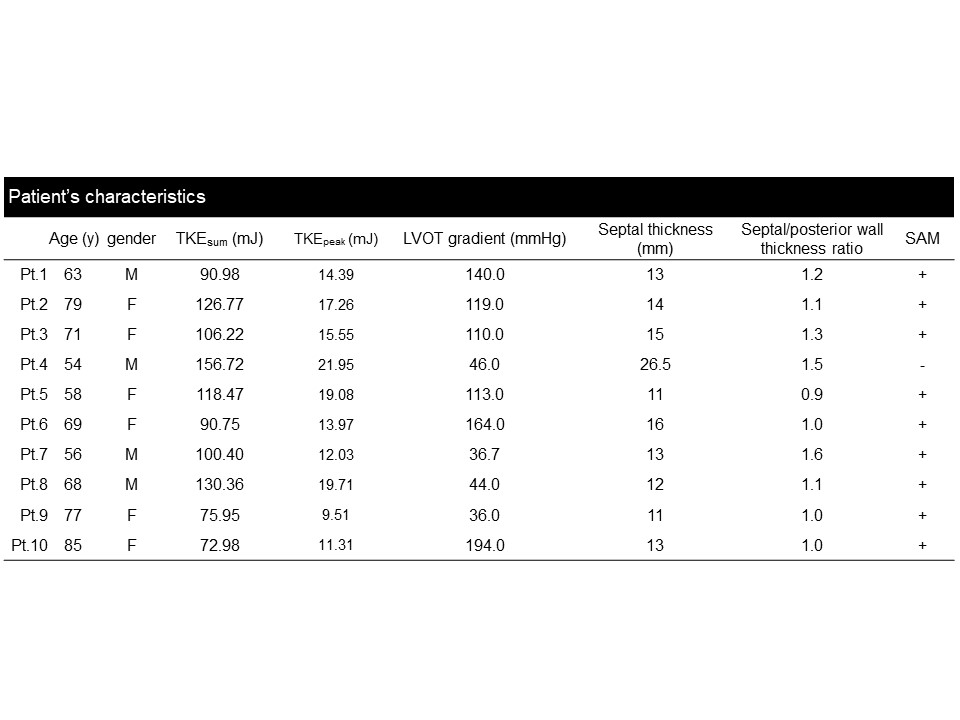
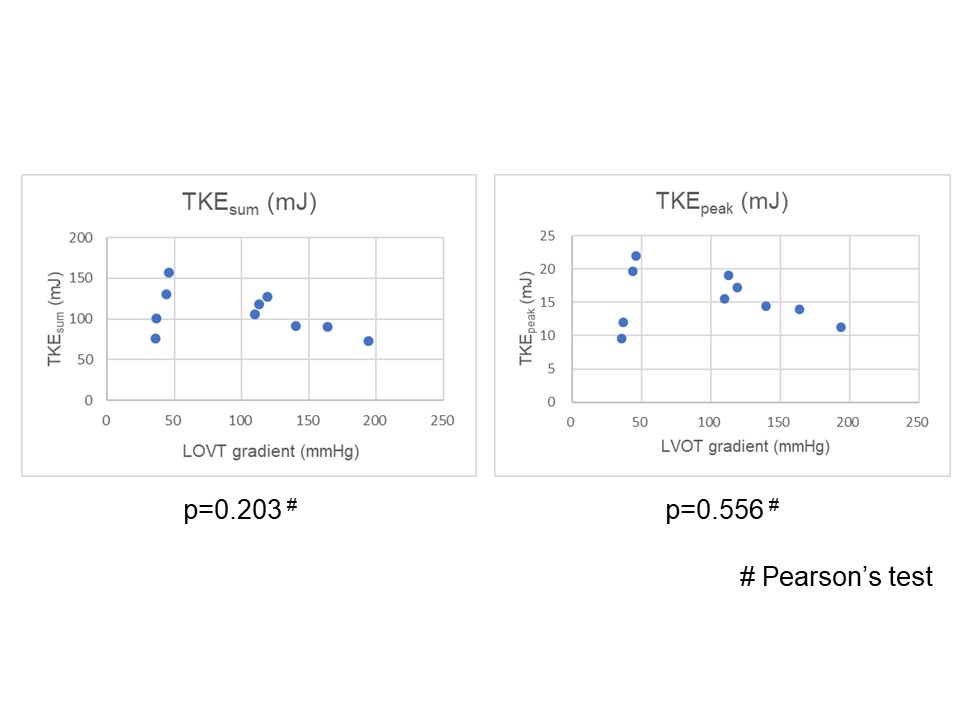
The patients’ characteristics were shown in Table 1. The TKEsum and TKEpeak of HOCM group were higher than those of volunteers (107.0±25.0mJ vs. 39.2±8.7mJ, p=0.025; 15.5±3.8mJ vs. 4.1±0.6mJ, p=0.025) (Table2). There was no significant difference between LOVT gradient and these TKE values (p=0.203, p=0.556, respectively) (Fig. 2).Discussion
The most interesting thing in this study is the poor correlation was observed between TKE and established pressure gradient measured by US. The pressure gradient measured by US has some assumption (single-point stenotic jet, no pressure recovery) which may not be correctly applied to the complicated morphology in HOCM. The previous study which evaluates the relationship between pressure gradient and TKE in the patients with aortic stenosis also showed that there is poor correlation among these two values (8). They revealed that the aortic and valvar morphology which was not taken into account by measured by US could affect TKE. In HOCM, such anatomical changes at left ventricular tract are more variable than aortic stenosis. One can assume that this variation can dominantly affect TKE than the velocity at the stenotic jet.Conclusion
The TKE is significantly higher in patients with HOCM than in normal volunteers. There is no correlation between TKE and pressure gradient. It indicates that pressure gradient measured by US may not estimate accurate pressure loss in HOCM.Acknowledgements
This work was supported by PMOD Technologies LLC and with Fujifilm corporation regarding 4D Flow MRI software development. And it was also supported by investigator initiated study grants from Hitachi Global Foundation, Fukuda Foundation for Medical Technology and Terumo foundation for life sciences and arts.References
1. Maron MS, Olivotto I, Betocchi S, et al. Effect of left ventricular outflow tract obstruction on clinical outcome in hypertrophic cardiomyopathy. N Engl J Med 2003;348:295-303.
2. van Ooij P, Allen BD, Contaldi C, et al. 4D flow MRI and T1 -Mapping: Assessment of altered cardiac hemodynamics and extracellular volume fraction in hypertrophic cardiomyopathy. J Magn Reson Imaging 2016;43:107-114.
3. Casas B, Lantz J, Dyverfeldt P, Ebbers T. 4D Flow MRI-based pressure loss estimation in stenotic flows: Evaluation using numerical simulations. Magn Reson Med 2016;75:1808-1821.
4. Binter C, Gulan U, Holzner M, Kozerke S. On the accuracy of viscous and turbulent loss quantification in stenotic aortic flow using phase-contrast MRI. Magn Reson Med 2016;76:191-196.
5. Ha H, Hwang D, Kim GB, et al. Estimation of turbulent kinetic energy using 4D phase-contrast MRI: Effect of scan parameters and target vessel size. Magn Reson Imaging 2016;34:715-723.
6. Dyverfeldt P, Sigfridsson A, Kvitting JP, Ebbers T. Quantification of intravoxel velocity standard deviation and turbulence intensity by generalizing phase-contrast MRI. Magn Reson Med 2006;56:850-858.
7. Knobloch V, Binter C, Gulan U, et al. Mapping mean and fluctuating velocities by Bayesian multipoint MR velocity encoding-validation against 3D particle tracking velocimetry. Magn Reson Med 2014;71:1405-1415.
8. Binter C, Gotschy A,
Sundermann SH, et al. Turbulent Kinetic Energy Assessed by Multipoint
4-Dimensional Flow Magnetic Resonance Imaging Provides Additional Information
Relative to Echocardiography for the Determination of Aortic Stenosis Severity.
Circ Cardiovasc Imaging 2017;10.
Figures