1984
Association Between Aortic Flow and Myocardial Motion Velocity in Patients with Marfan Syndrome1National Tsing Hua University, Hsinchu, Taiwan, 2Taipei Medical University Hospital, Taipei, Taiwan, 3National Taiwan University Hospital, Taipei, Taiwan
Synopsis
We aimed to explore the possible correlation between aortic flow and myocardial motion in Marfan syndrome (MFS) patients. MFS group presented lower mean velocity and higher retrograde flow in the ascending aorta (AAo). MFS group also exhibited lower basal systolic Vz and diastolic Vr, higher diastolic Vz, and prolonged diastolic TTPz. The mean velocity showed positive correlation with basal systolic Vz, diastolic Vz, and diastolic Vr. The retrograde flow was correlated with basal diastolic TTPz. In conclusion, the correlation between aortic flow and myocardial motion in MFS patients might provide helpful information in long-term surveillance in MFS patients.
Introduction
Marfan syndrome (MFS) is an autosomal-dominant disorder, caused by heterozygous mutations in the gene encoding fibrillin-1 (FBN1) 1. FBN1 is the major constituent of the myocardial extracellular microfibrils 2. The abnormal FBN1 can lead to disease progression and cardiac remodeling in animal MFS models 3,4. However, the regional myocardial motion, affected by abnormal FBN1, in MFS patients has not been discussed thoroughly. On the other hand, the defective aorta showed loss of smooth muscle cells and disordered adhesive proteins 5. Previous studies reported the altered wall shear stress (WSS) and helical flow in the aorta of MFS patients 6-8. The increased aortic stiffness could lead to left ventricle (LV) systolic dysfunction in MFS patients 9. The purpose of this study was to explore the possible correlation between aortic flow and myocardial motion velocity in MFS patients.Methods
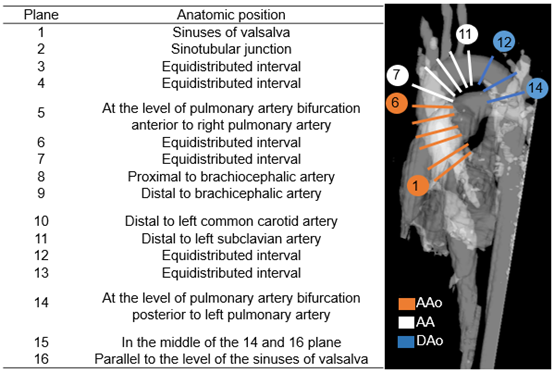
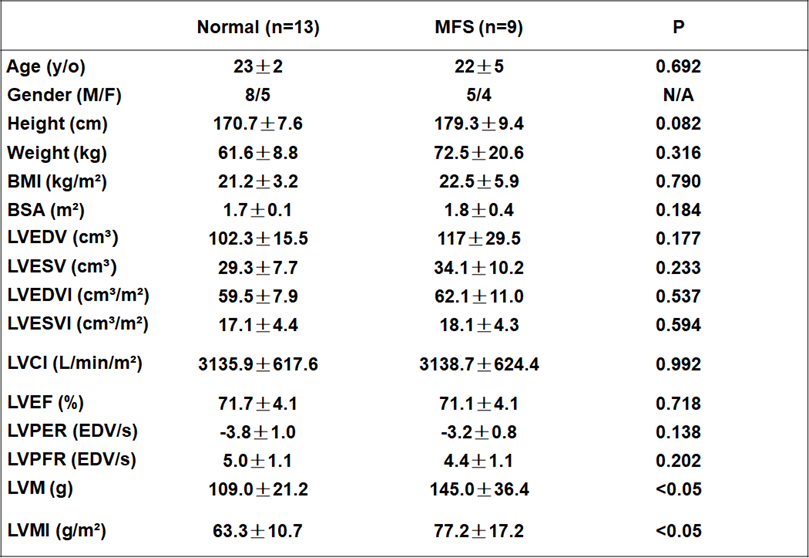
The study population included 13 normal controls (age=23±2 years; female/male=5/8) and 9 MFS patients (age=22±5 years; female/male=4/5). All images were acquired in a 3-Tesla MR scanner (Tim Trio, Siemens, Erlangen, Germany). The 4D flow was acquired with TR/TE=10/2.7 ms, flip angle=7˚, temporal resolution=40 ms, spatial resolution=(1.36-1.44)×(1.36-1.44)×3.5 mm3, and venc=1.5 m/s. Sixteen 2D planes along the aorta were manually determined for calculating flow velocity and retrograde flow (Figure 1). The tissue phase mapping (TPM) data was acquired in basal, mid, and apical slices with TR/TE=6.0/5.2 ms, flip angle=7˚, temporal resolution=24 ms, spatial resolution=1.17×1.17×6 mm3, and venc=0.15 and 0.25 m/s for in-plane and through-plane directions. The systolic and diastolic peak myocardial motion velocities in the radial (Vr) and longitudinal (Vz) directions and the corresponding time-to-peak (TTPr, TTPz) were quantified. The time frames were normalized to the end systolic time frame and denoted as %ES. Statistical analysis was performed by using two-tailed Student’s t-test. Pearson correlation was performed to evaluate the correlation between two indices. P<0.05 was considered statistically significant.Results
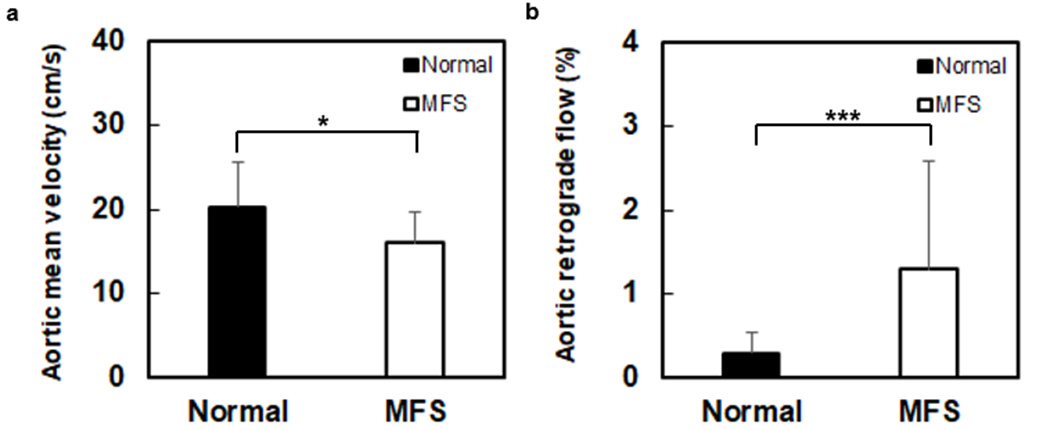
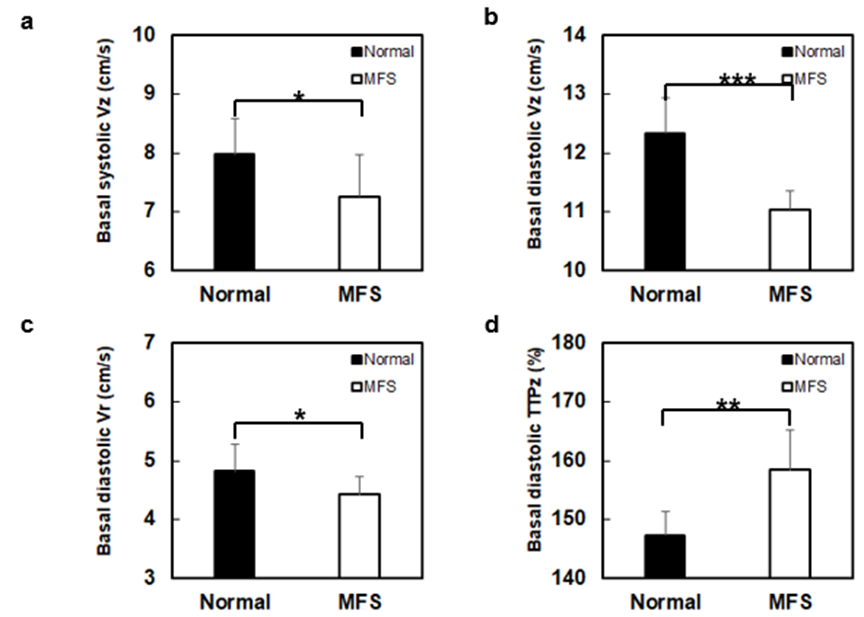
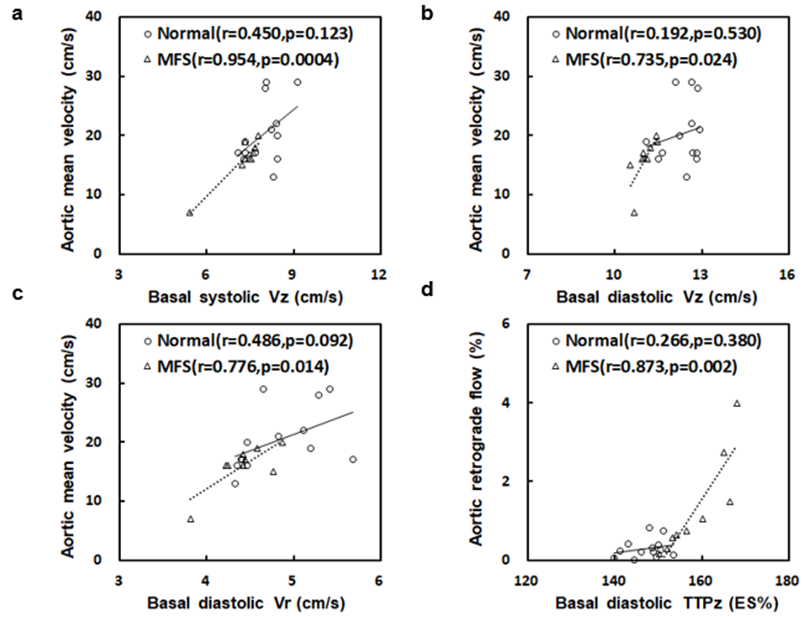
Table 1 illustrates that MFS group was with higher LV mass index than normal group (P<0.05). In Figure 2, compared to normal group, MFS group presented lower mean velocity (20.3±5.3 cm/s vs. 16.1±3.7 cm/s, P<0.05) and higher retrograde flow (0.30±0.24% vs. 1.30±1.28%, P<0.001) in the ascending aorta (AAo). MFS group also exhibited lower systolic Vz and diastolic Vr, higher diastolic Vz, and prolonged diastolic TTPz in base (all P<0.05) (Figure 3). In Figure 4, the mean velocity of AAo showed strong positive correlation with systolic Vz, diastolic Vz, and diastolic Vr (r=0.74~0.95) in base. The AAo retrograde flow was correlated with basal diastolic TTPz (r=0.87). There is no correlation between abovementioned indices in normal controls.Discussions and Conclusions
In this study, we evaluated the association between aortic flow and myocardial motion velocity in MFS patients. The MFS patients recruited in this study were with higher LVMI and preserved LVEDVI, indicating the thicker LV wall thickness which is a typical sign of LV hypertrophy. Patients with LV hypertrophy were reported to be associated with prolonged diastolic TTPz 10. MFS patients with thicker wall thickness might be a remodeling mechanism to overcome the increased afterload due to the aortic retrograde flow. The positive correlation between AAo retrograde flow and basal diastolic TTPz depicted the adverse effect of retrograde flow on myocardial motion in MFS patients.
Previous studies reported that patients with hypertension-induced LV hypertrophy can lead to decreased LV diastolic Vz and Vr 11 and increased LV afterload can lead to decreased aortic mean velocity 12. In this study, decreased diastolic Vz and aortic mean velocity in MFS group were observed and the association in-between was confirmed, describing that the increased afterload could affect both of myocardial function and aortic flow.
FBN1 fibers are largely oriented in the longitudinal direction of myocardium and in charge of transferring the contractile force of cardiomyocytes 13. FBN1 gene mutation in MFS can lead to altered mechanical properties of tissues and impaired hemodynamic load sensing 14-17; consequently, an overproduction of collagen results in myocardial fibrosis 18. The fibrotic myocardia might exert a compensatory mechanism to maintain the cardiac function and in the meantime, the preload and afterload could increase as well. The increased preload has impact on the myocardial motion, as shown in this study. On the other hand, the increased LV afterload can lead to decreased aortic mean velocity 12. Therefore, we observed increased diastolic Vz (preload) and decreased aortic velocity (afterload) and a positive correlation in-between.
In conclusion, we observed altered aortic flow and myocardial motion velocity in MFS patients. The relationship in-between might be helpful in long-term surveillance of cardiac function in MFS patients.
Acknowledgements
No acknowledgement found.References
1. Mizuguchi T, et al. Recent progress in genetics of Marfan syndrome and Marfan-associated disorders. J Hum Genet. 2007;52(1):1–12.
2. Canadas V, et al. Marfan syndrome. Part 1: pathophysiology and diagnosis. Nat Rev Cardiol. 2010;7(5):256-65.
3. Dietz HC, et al. Recent progress towards a molecular understanding of Marfan syndrome. Am J Med Genet C Semin Med Genet. 2005;139C(1):4-9
4. Hyun-Jin Tae, et al. Cardiac remodeling in the mouse model of Marfan syndrome develops into two distinctive phenotypes. Am J Physiol Heart Circ Physiol. 2016;310(2):H290–H299.
5. Dormand H, et al. Cardiovascular magnetic resonance in Marfan syndrome. J Cardiovasc Magn Reson. 2013;15:33
6. Geiger, et al. Aortic flow patterns in patients with Marfan syndrome assessed by flow-sensitive four-dimensional MRI. J Magn Reson Imaging. 2012;35(3):594-600.
7. Geiger, et al. Aortic wall shear stress in Marfan syndrome. Magn Reson Med. 2013;70(4):1137-44.
8. Wang HH, et al. Does altered aortic flow in marfan syndrome relate to aortic root dilatation? J Magn Reson Imaging. 2016;44(2):500-8.
9. Kiotsekoglou A, et al. Effect of aortic stiffness on left ventricular long-axis systolic function in adults with Marfan syndrome. Hellenic J Cardiol. 2010;51(6):501-11.
10. Jung B, et al. Detailed analysis of myocardial motion in volunteers and patients using high-temporal-resolution MR tissue phase mapping. J Magn Reson Imaging. 2006;24(5):1033-9.
11. Von Knobelsdorff-Brenkenhoff, et al. Myocardial dysfunction in patients with aortic stenosis and hypertensive heart disease assessed by MR tissue phase mapping. J. Magn. Reson. Imaging. 2016 ;44(1):168-77.
12. Harrison MR, et al. Effect of blood pressure and afterload on Doppler echocardiographic measurements of left ventricular systolic function in normal subjects. Am J Cardiol. 1989;64(14):905-8.
13. Bouzeghrane F, et al. Enhanced expression of fibrillin-1, a constituent of the myocardial extracellular matrix in fibrosis. Am J Physiol Heart Circ Physiol. 2005;289(3):H982-91.
14. Mariko B, et al. Microfibrils and fibrillin-1 induce integrin-mediated signaling, proliferation and migration in human endothelial cells. Am J Physiol Cell Physiol. 2010;299(5):C977-87.
15. Nataatmadja M, et al. Overexpression of transforming growth factor-beta is associated with increased hyaluronan content and impairment of repair in Marfan syndrome aortic aneurysm. Circulation. 2006;114(1 Suppl):I371-7.
16. Shores J, et al. Progression of aortic dilatation and the benefit of long-term beta-adrenergic blockade in Marfan syndrome. N Engl J Med. 1994;330(19):1335-41.
17. Wilson DG, et al. Endothelial function in Marfan syndrome: selective impairment of flow-mediated vasodilation. Circulation. 1999;99(7):909-15.
18. Lindsay ME, et al. Loss-of-function mutations in TGF-β2 cause a syndromic presentation of thoracic aortic aneurism. Nat Genet. 2012;44(8):922-7.
Figures