1982
Pulmonary Artery 3D Wall Shear Stress is Lower in Patients with WHO Group 2 Pulmonary HypertensionMichael Scott1, Daniel Z Gordon1, Mohammed Elbaz1, Vamsi Reddy1, Jeremy D Collins2, Benjamin Freed1, Sanjiv Shah1, Michael Cuttica1, Michael Markl1, and James C Carr1
1Northwestern University, Chicago, IL, United States, 2Mayo Clinic, Rochester, MN, United States
Synopsis
Patients with pulmonary hypertension (PHTN) are known to have altered pulmonary artery (PA) hemodynamics in addition to differing PA pressures measured using invasive right heart catherization. 4D flow MRI can provide information about PA hemodynamics, such as 3D wall shear stress that might be useful in diagnosis or grading of PHTN. Previous work on WSS used manually placed planes for evaluating regional WSS, we derive WSS metrics over the entire vessel. 3D WSS measurements in the PA were significantly different between a cohort of patients with WHO group 2 PHTN and healthy controls and were correlated with catheter-based pressure measurements.
Introduction
World Health Organization (WHO) group 2 pulmonary hypertension (PHTN) affects 3-4 million patients with left heart disease in the USA and worsens prognosis in these patients1,2. Diagnosis and monitoring rely on invasive right heart catheterization as a gold standard3, and a noninvasive method for identification and grading of PHTN would be desirable. Previous work has shown that PHTN is associated with changes in right heart and pulmonary hemodynamics4. 4D flow MRI (time-resolved 3D phase-contrast MRI with 3D velocity encoding) may noninvasively provide comprehensive information about pulmonary hemodynamics and may prove a useful alternative to catheter-derived pressure measurements. One 4D flow-derived metric that may correlate with clinical measurements as well as pathophysiology such as vascular remodeling is 3D wall shear stress (WSS). Previous work relied on manual plane placement and calculated the WSS over only a section of each pulmonary artery and showed that WSS correlated with invasive measurements and artery stiffness5-7. The goal of this study was to expand on previous work and assess 3D WSS over the entire main, right and left pulmonary arteries (MPA, RPA, LPA) and investigate its sensitivity to detect differences in patients with PH compared to controls. In addition, 3D WSS values were correlated with the clinical reference standard (pressure measurements obtained from invasive right heart catheterization) to assess the potential of 4D flow MRI to non-invasively identify patients with PH.Methods
In this prospective IRB approved and HIPAA compliant study, a cohort of 17 healthy control subjects (age 55±13, 7 female) and 16 patients (age 60±14, 9 female) with WHO Group 2 PHTN (mean PA pressure ≥25 mmHg and PCWP ≥15 mmHg) underwent whole heart 4D flow MRI. Subject characteristics are shown in Table 1. PHTN patients received right heart catheterization within 28 days of their research MRI. Free-breathing, prospectively ECG-gated 4D flow MRI was conducted on 1.5T Aera scanners (Siemens Medical Systems, Erlangen, Germany) using post-Gd administration (Gadavist) and with the following parameters: spatial resolution 2.3x2.3x2.9 mm3, temporal resolution 40 ms, velocity sensitivity (venc) 160 cm/s. Analysis was carried out in Matlab (MathWorks, Natick, MA). The workflow is shown in Figure 1: A) 4D flow MRI data was preprocessed to correct for eddy currents and aliasing, B) a 3D segmentation of the MPA, RPA, and LPA was generated (Materialize Mimics, Leuven, Belgium), C) 3D WSS was calculated using a previously described method8,9, and D) regional analysis was carried out. 3D WSS was calculated at peak systole, defined as the cardiac phase with the highest mean velocity. The maximum WSS is reported as the average of the top 2% WSS per region to reduce the influence of outliers.Results
As summarized in Table 1, control and patient cohorts were age and sex matched, though the patient cohort had a significantly higher heart rate. Table 2 shows the regional WSS measurements. Patients had significantly lower mean WSS in both RPA (0.52±0.13 vs. 0.42±0.14, p=0.05) and LPA (0.46±0.13 vs. 0.35±0.13, p=0.02), as shown in Figure 2, and the maximum 2% WSS was significantly lower in the LPA (0.75±0.20 vs. 0.60±0.22, p=0.05). Correlation coefficients (r) between WSS and pressure measurements are summarized in Table 3. There were significant relationships between elevated mean MPA WSS (r>0.52, p<0.04), maximum MPA WSS (r=0.64, p<0.01), and maximum RPA WSS (r>0.65, p<0.01) with increased right atrial (RA) pressures. In addition, mean RPA WSS was positively correlated with the RA v-wave pressure (r=0.5, p=0.05), and the maximum RPA WSS was positively correlated with the right ventricular diastolic pressure (r=0.5, p=0.05). Lastly, increased mean RPA WSS was correlated with higher cardiac output (r=0.54, p=0.03) determined using the thermodilution method.Discussion and Conclusion
Patients with WHO group 2 PHTN had lower mean WSS in RPA and LPA. This agrees with previous work investigating WSS at a single plane in patients with PHTN5-7, though the previous study focused on patients in WHO PHTN groups other than group 2. The MPA and RPA WSS in these PHTN patients also correlated significantly with RA pressures, suggesting that 3D WSS may be a useful marker for grading or identification of PHTN. When combined with other hemodynamic measures derived from 4D flow, WSS may contribute to a noninvasive method for monitoring patients with PHTN without exposure to ionizing radiation. Future research should expand the cohort and include patients with other types of PHTN and further investigate pulmonary artery WSS by resolving it into radial, circumferential, and longitudinal components, or by comparing to a cohort averaged atlas of healthy controls.Acknowledgements
Bayer AGReferences
- Kjaergaard J, Akkan D, Iversen KK, et al. Prognostic importance of pulmonary hypertension in patients with heart failure. The American journal of cardiology 2007;99(8):1146-1150.
- Damy T, Goode KM, Kallvikbacka-Bennett A, et al. Determinants and prognostic value of pulmonary arterial pressure in patients with chronic heart failure. Eur Heart J 2010;31(18):2280-2290.
- Freed BH, Collins JD, Francois CJ, et al. MR and CT Imaging for the Evaluation of Pulmonary Hypertension. JACC Cardiovasc Imaging 2016;9(6):715-732.
- Reiter G, Reiter U, Kovacs G, Olschewski H, Fuchsjager M. Blood flow vortices along the main pulmonary artery measured with MR imaging for diagnosis of pulmonary hypertension. Radiology 2015;275(1):71-79.
- Barker AJ, Roldan-Alzate A, Entezari P, et al. Four-dimensional flow assessment of pulmonary artery flow and wall shear stress in adult pulmonary arterial hypertension: results from two institutions. Magn Reson Med 2015;73(5):1904-1913.
- Schafer M, Kheyfets VO, Schroeder JD, et al. Main pulmonary arterial wall shear stress correlates with invasive hemodynamics and stiffness in pulmonary hypertension. Pulm Circ 2016;6(1):37-45.
- Schafer M, Ivy DD, Barker AJ, et al. Characterization of CMR-derived haemodynamic data in children with pulmonary arterial hypertension. Eur Heart J Cardiovasc Imaging 2017;18(4):424-431.
- Bieging ET, Frydrychowicz A, Wentland A, et al. In vivo three-dimensional MR wall shear stress estimation in ascending aortic dilatation. J Magn Reson Imaging 2011;33(3):589-597.
- Potters WV, van Ooij P, Marquering H, vanBavel E, Nederveen AJ. Volumetric arterial wall shear stress calculation based on cine phase contrast MRI. J Magn Reson Imaging 2015;41(2):505-516.
Figures
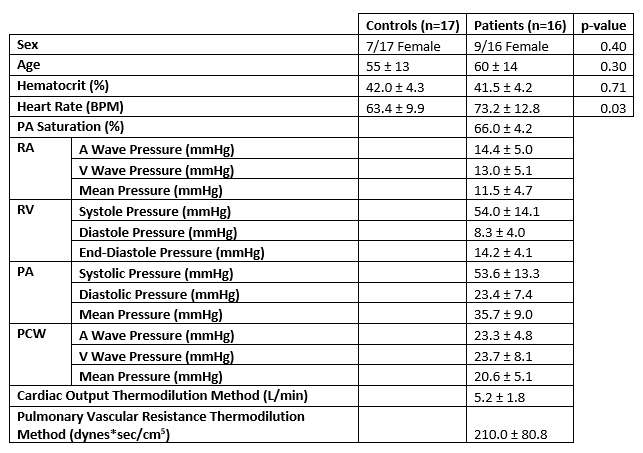
Table 1: Cohort demographics: characteristics of the 17
healthy controls and 16 patients with WHO Group 2 PHTN. Values are shown as
mean ±
standard deviation. Pressure measurements were obtained via invasive
right heart catheterization in patients only. P-values were calculated using an
unpaired t-test with equal variance, and p≤0.05 was considered
statistically significant.
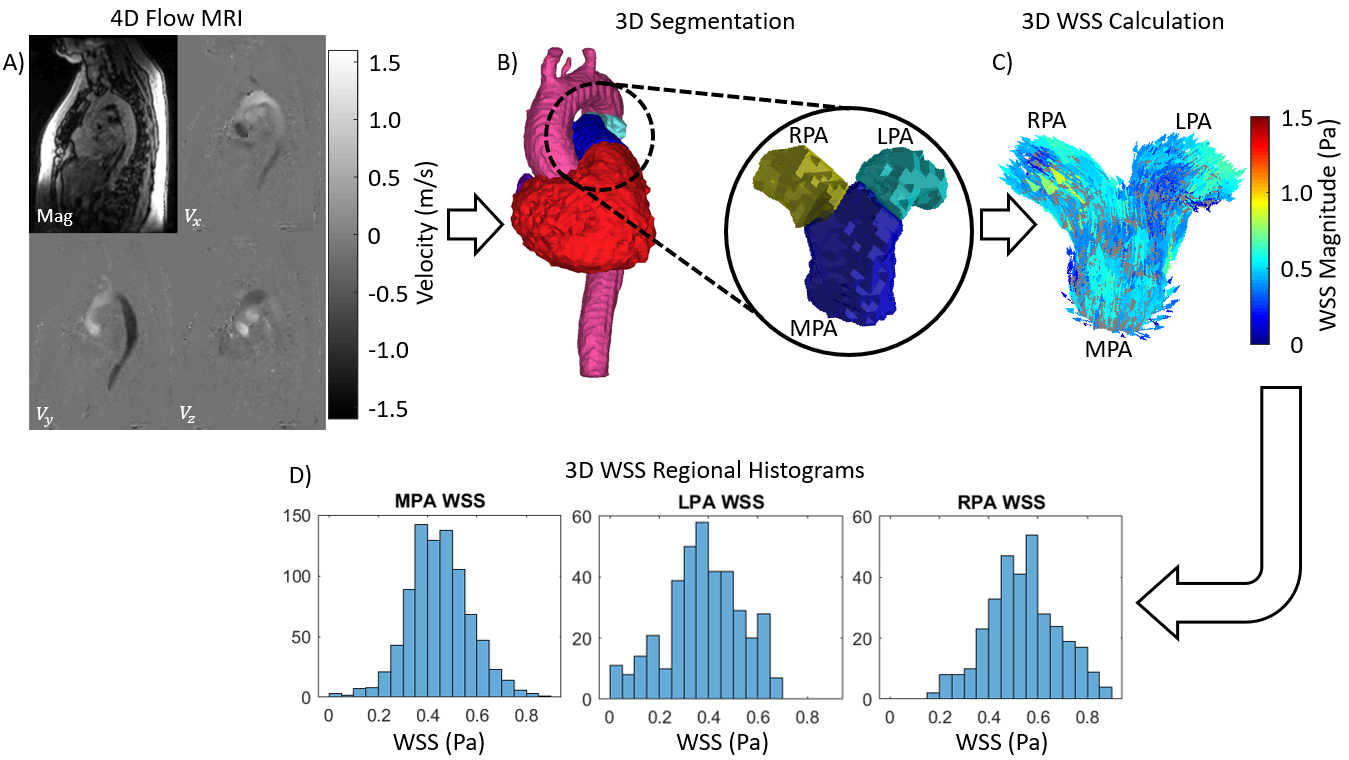
Figure 1: Analysis Workflow: A) 4D flow data is preprocessed
to remove eddy currents and correct for aliasing. Mag denotes the averaged
magnitude image, whereas Vx, Vy, and Vz are the velocity images along each coordinate
axis. B) A 3D segmentation is generated from the 4D flow MRI, with separate
masks for the MPA, LPA, and RPA. C) The 3D WSS is calculated over the surface
of the pulmonary artery, and D) WSS is divided into MPA, RPA, and LPA for
regional WSS analysis and derivation of hemodynamic parameters.
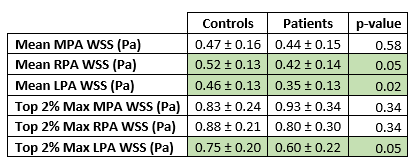
Table 2: Regional WSS quantification: mean and maximum WSS
in the MPA, RPA, and LPA. The data is reported as mean ± standard deviation, where the
mean shown in the table was calculated from the mean WSS in each region for
each subject. The top 2% maximum was calculated by taking the mean of the
highest 2% of WSS values in each region at peak systole. Green entries
represent comparisons where controls and patients differ significantly (p≤0.05
by an unpaired t-test assuming equal variance).
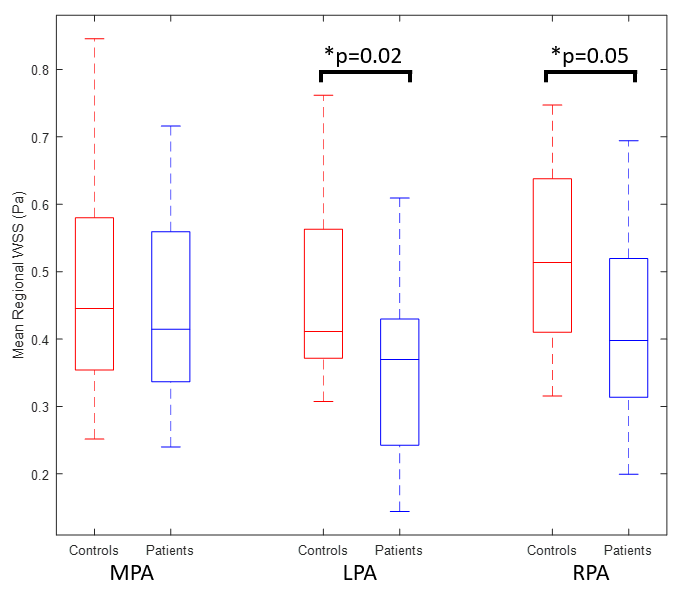
Figure 2: Mean regional WSS comparison between healthy
volunteers and patients with WHO group 2 PHTN. Patients have significantly
lower mean WSS in both the LPA and RPA (p≤0.05 by an unpaired t-test
assuming equal variance), but the mean WSS in the MPA is not significantly
different. Boxplots show the median and quartiles, with the whiskers showing
the most extreme data points.
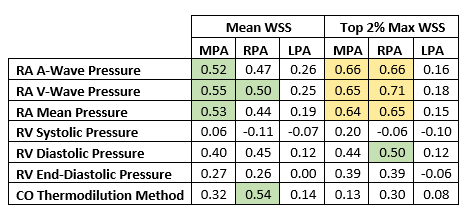
Table 3: Correlations between mean and maximum 2% regional
WSS and right ventricular pressure measurements obtained using invasive right
heart catheterization. Table entries show r, the Pearson correlation
coefficient. Cells marked in green show significant correlations with p<0.05
(|r|>0.49), while yellow cells show correlations with p<0.01
(|r|>0.61). Top 2% maximum WSS is calculated by averaging the highest 2% of
WSS values per region for each subject.