1980
Comparing Regional Left Ventricular Flow and Myocardial Strain after Myocardial Infarction1Medical Physics, University of Wisconsin-Madison, Madison, WI, United States, 2Medicine, University of Wisconsin-Madison, Madison, WI, United States, 3Medicine, Weill Cornell Medical College, New York, NY, United States, 4Radiology, Weill Cornell Medical College, New York, NY, United States, 5Radiology, University of Wisconsin-Madison, Madison, WI, United States
Synopsis
This work employed time-resolved (4D) flow cardiac MRI and feature-tracking myocardial strain to characterize the relationship between left ventricular (LV) strain and kinetic energy after myocardial infarction. Kinetic energy indexed to end diastolic volume in the LV apex varied directly with peak radial strain in the LV apex, and with global LV ejection fraction. This method of regional analysis may be of clinical use in characterizing LV contractile and hemodynamic function in the post MI population.
Introduction
Myocardial infarction (MI) leads to decreases in myocardial strain localized to the infarcted region1, as well as complex changes in left ventricular (LV) hemodynamics, including decreased global LV systolic and diastolic kinetic energy2 and through-plane velocity3. However, the precise mechanisms relating altered myocardial strain to altered intra-ventricular flow are not fully understood. This worked aims to investigate the relationship between regional myocardial strain and regional intra-ventricular flow alterations in the post-MI LV.Methods
MRI: Fourteen subjects with MI underwent cardiac MRI, including cine bSSFP, late gadolinium enhancement, and 4D flow imaging (mean interval from MI to imaging: 3.7 days, range=1-13 days). Flow data was acquired with a 3D radially undersampled trajectory (PC VIPR4) with the following scan parameters: field strength = 1.5-3T, TR/TE = 5.8-8.4/2.0-2.5ms, FOV = 32x32x20cm3, acquired spatial resolution = 1.25mm isotropic, 20 cardiac frames with retrospective cardiac and respiratory gating, scan time = 10-14min, VENC = 100-150cm/s. Short-axis bSSFP images with whole heart coverage had an in-plane resolution of 1.25x1.25mm2 and a slice thickness of 8mm.
Analysis: Infarct size was scored segment-by-segment by two experienced radiologists in consensus. Time-resolved LV segmentations were produced from semi-automatically contouring short axis bSSFP images using Segment (http://segment.heiberg.se, v2.0 R5399)5 and registered to 4D flow volumes with a rigid registration using ANTs6,7. LV ejection fraction (LVEF) was computed from these LV segmentations by dividing the difference between the end diastolic volume (EDV) and end systolic volume by the EDV. LV volumes were then subdivided into equal-length basal, mid-ventricular, and apical regions along the LV long axis. Through-plane flow was computed as average flow through all short-axis slices in each region. Kinetic energy indexed to end diastolic volume (KEiEDV) was computed in each region by summing kinetic energy contributions of all voxels in the region, and then dividing by the EDV to control for kinetic energy differences due to variations in EDV. Radial and circumferential strain were computed in the base, mid-ventricle, and apex regions of the LV from short-axis bSSFP images in Segment using a feature-tracking algorithm8. Univariate linear regression was used to determine the relationship between flow metrics (peak systolic through-plane flow, peak systolic KEiEDV), peak strain (radial and circumferential), LVEF, and infarct size on a region-by-region basis.
Results
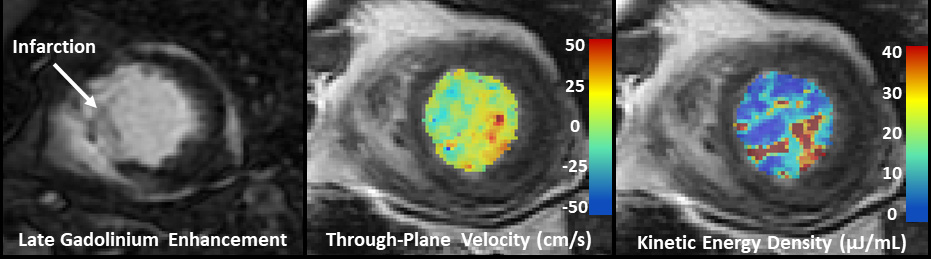
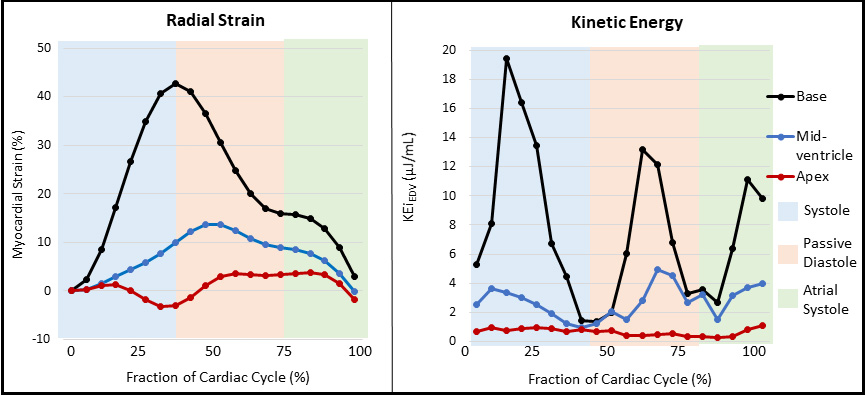
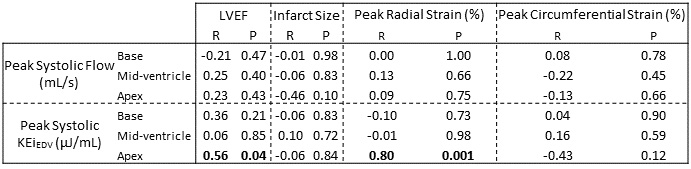
The mean infarct size was 24% ± 14% of myocardium. Mean LVEF was 50% ± 18%. Mean peak strains in the base, mid-ventricle, and apex, respectively, were 34%, 29%, and 19% (radial), and -12%, -11%, and -8% (circumferential). Figure 1 demonstrates velocity and kinetic energy mapping in a characteristic MI subject, with 4D flow data overlaid on a registered short-axis slice. Mean peak systolic through-plane flow was 4.6, 3.6, and 1.1 L/min in the base, mid-ventricle, and apex, respectively. Mean peak systolic KEiEDV was 20.3, 9.1, and 3.6 µJ/mL in the base, mid-ventricle, and apex, respectively. Figure 2 demonstrates impaired radial strain and kinetic energy in the apical region of a characteristic subject with an apical infarction. Figure 3 summarizes the correlation of regional flow metrics with global LVEF, regional infarct size, and regional strain.Discussion
Decreased peak systolic KEiEDV in the apex was associated with lower global LVEF and lower peak radial strain in the apex. This suggests that diminished radial strain, resulting from apical infarctions, contributed to blood stasis in the LV apex. There was no correlation between strain and KEiEDV in the LV base or mid-ventricle, perhaps because neighboring regions of myocardium were able to compensate for localized contractile dysfunction. Regional through-plane flow was not associated with regional strain. The lack of significant correlation between regional through-plane flow and regional strain may reflect the ability of the heart to compensate for deficiencies in order to preserve cardiac output or may just be the result of a relatively small sample size.Conclusion
A regional approach was presented to compare local myocardial strain with local intraventricular flow in the post-MI LV. Radial strain impairments were associated with co-localized decreases in KEiEDV in the apex, but not with through-plane flow. This method may be of clinical use in characterizing LV contractile and hemodynamic function in the post MI population.Acknowledgements
The authors gratefully acknowledge Donald G. Benson for assisting CJF with scoring LGE images for infarct size. PC is supported by National Institute of Health (NIH) grant number TL1TR002375. The content is solely the responsibility of the authors and does not necessarily represent the official views of the NIH.References
1. Neizel M, Lossnitzer D, Korosoglou G, et al. Strain-encoded MRI for evaluation of left ventricular function and transmurality in acute myocardial infarction. Circ Cardiovasc Imaging. 2009;2(2):116-122.
2. Garg P, Crandon S, Swoboda PP, et al. Left ventricular
blood flow kinetic energy after myocardial infarction - insights from 4D flow
cardiovascular magnetic resonance. J Cardiovasc Magn Reson 2018 201.
2018;20(1):61.
3. Corrado PA, Agarwal NR, Macdonald JA, Weinsaft JW, François CJ, Wieben O. Hemodynamic Assessment of the Post-Myocardial Infarction Left Ventricle with 4D Flow MRI. In: Proceedings of the International Society of Magnetic Resonance in Medicine. ; 2018.
4. Gu T, Korosec FR, Block WF, et al. PC VIPR: A high-speed 3D phase-contrast method for flow quantification and high-resolution angiography. Am J Neuroradiol. 2005;26(4):743-749.
5. Heiberg E, Sjögren J, Ugander M, Carlsson M, Engblom H, Arheden H. Design and validation of Segment - freely available software for cardiovascular image analysis. BMC Med Imaging. 2010;10:1-13.
6. Avants BB, Tustison NJ, Stauffer M, Song G, Wu B, Gee JC. The Insight ToolKit image registration framework. Front Neuroinform. 2014;8(April):1-13.
7. Gupta V, Bustamante M, Fredriksson A, Carlh??ll CJ, Ebbers T. Improving left ventricular segmentation in four-dimensional flow MRI using intramodality image registration for cardiac blood flow analysis. Magn Reson Med. 2017;00(February):0-6.
8. Heyde B, Member S, Jasaityte R, et al. Elastic Image Registration Versus Speckle Tracking for 2-D Myocardial Motion Estimation: A Direct Comparison In Vivo. IEEE Trans image Process. 2013;32(2):449-459.
Figures