1979
Blood Flow Alterations in Repaired Tetralogy of Fallot Adult Patients: Preserved blood flow distribution and altered flow biomarkers.Daniel Yakimenka1, Ahmed Abdelhaleem1, Alireza Sojoudi2, An Le2, David Patton1, James White1, and Julio Garcia 1
1University of Calgary, Calgary, AB, Canada, 2Circle Cardiovascular Imaging Inc., Calgary, AB, Canada
Synopsis
Tetralogy of Fallot (TOF) is a common congenital disorder which is treated by surgical repair. This study aimed to investigate alterations in blood flow in adults with repaired TOF. We hypothesized that abnormal remodeling of the right heart and the PA following surgical repair leads to impaired blood flow distribution, increased wall shear stress (WSS), greater energy loss (EL) and greater pressure drop (PD) in rTOF adults. This study contributes towards the understanding of blood flow hemodynamics after surgical repair.
Background
Tetralogy of Fallot (TOF) is a common congenital disorder contributing to 9-14% of all congenital heart disease.1 TOF is treated by surgical repair of the pulmonary infundibulum, a procedure known to alter hemodynamic properties of blood flow in the right heart and pulmonary artery (PA). This study aimed to investigate alterations in blood flow in adults with repaired TOF (rTOF) in comparison to healthy volunteers using 4D flow MRI. We hypothesized that abnormal remodeling of the right heart and the PA following surgical repair leads to impaired blood flow distribution, increased wall shear stress (WSS), greater energy loss (EL) and greater pressure drop (PD) in rTOF adults.Methods
A total of 26 subjects were retrospectively studied: 11 with rTOF (43% female, 35.8 ± 14.4) and 15 healthy controls (44% female, 32.6 ±12.6). All subjects underwent a standard cardiac MRI inclusive of 4D flow on a 3T scanner (Prisma, Siemens, Erlangen, Germany) using a standardized protocol inclusive of ECG-gated 4D flow with adaptive navigator respiratory gating with whole heart coverage.2 4D flow imaging parameters were: Venc= 1.5-2.0 m/s, TE= 2.61-3.14 ms, TR= 4.9-5.9 ms, FOV= 200-420 mm x 248-368 mm, spatial resolution = 1.9-3.5x2.0-3.2x1.8-3.5 mm3, temporal resolution = 39-47 ms, and FA = 15°. Image processing was done exclusively using cvi42 (Circle Cardiovascular, Calgary, Version 5.9.0). Each 4D volume was pre-processed for offset correction, eddy-currents and Maxwell terms (Fig.1A). The PA, left ventricle (LV), and right ventricle (RV) were individually segmented (Fig.1B). For RV and LV assessments, 2 cross sections were placed at tricuspid and pulmonary valve, and mitral and aortic valve planes, respectively. Flow component analysis (direct flow, delayed ejection, retained inflow, and residual volume), net flow, peak velocity, and regurgitant fraction measurements were performed. For PA assessments, 5 cross-sections were placed in pre-defined anatomic landmarks (Fig.1C). Longitudinal WSS, radial WSS, WSS magnitude was measured at each cross section. PD was measured in 4 cross sections relative to the pulmonary valve plane (Fig.1C). For EL measurements, a centerline was traced from pulmonary valve to the left and right PA branches. All PA measurements were taken at peak systole.Results
All subjects were successfully processed, segmented and analyzed. Functional blood flow component analysis in the LV and RV didn't identify differences between rTOF patients and controls. LV direct flow was diminished by mitral regurgitation fraction (r=-0.49, p=0.011). RV direct flow (r=-0.62, p=0.001) and retained inflow (r=-0.44, p=0.033) were diminished by pulmonary valve regurgitation fraction. Residual volume increased with pulmonary valve regurgitation severity (r=0.55, p=0.005). Peak velocity and radial WSS at the PAV, as well as EL in both the RPA and LPA showed significant differences versus controls (p ≤ 0.001) (Table 1). Overall subjects, peak velocity and radial WSS both correlated (r>0.5, p ≤ 0.01) with EL in the RPA and LPA (Table 2).Conclusion
Functional blood flow component analysis was not able to detect differences between rTOF patients and controls. Whereas wall shear stress, energy loss and pressure drop identified abnormal hemodynamics in the pulmonary artery. This pilot study contributes for better understanding of flow biomarkers in patients with rTOF.Acknowledgements
Mitac IT07679 and IT07680.References
1. Valbuena-Lopez et al. Curr Cardiovasc Imaging Reports 2018; 11:9.
2. Markl et al. JMRI 2007;25:824-831.
Figures
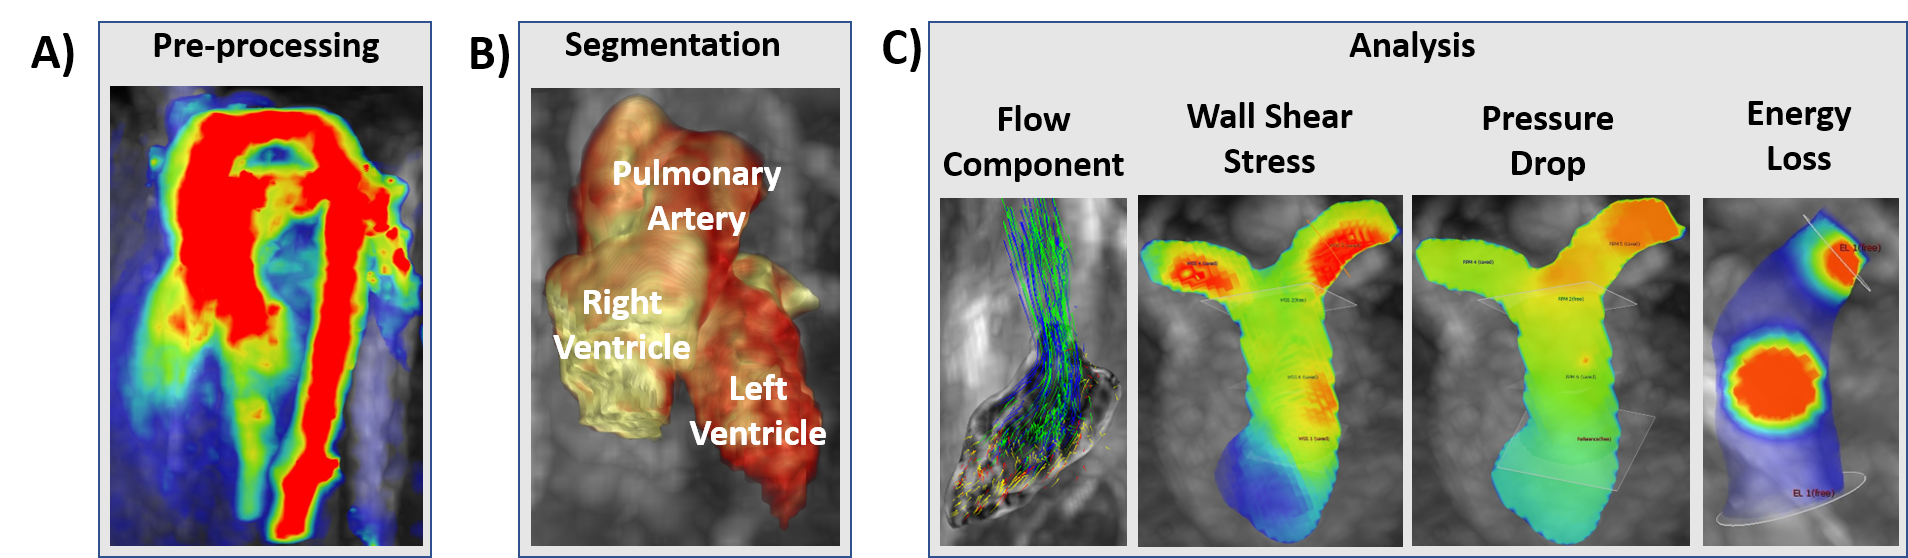
Figure 1. Workflow.
4D flow data were pre-processed and used to generate a phase-contrast angiogram. The latter was used to segment the left / right ventricles, and the pulmonary artery. Blood flow component analysis was calculated in the right and left ventricle, wall shear stress, pressure drop and energy loss were calculated in the pulmonary artery.
4D flow data were pre-processed and used to generate a phase-contrast angiogram. The latter was used to segment the left / right ventricles, and the pulmonary artery. Blood flow component analysis was calculated in the right and left ventricle, wall shear stress, pressure drop and energy loss were calculated in the pulmonary artery.
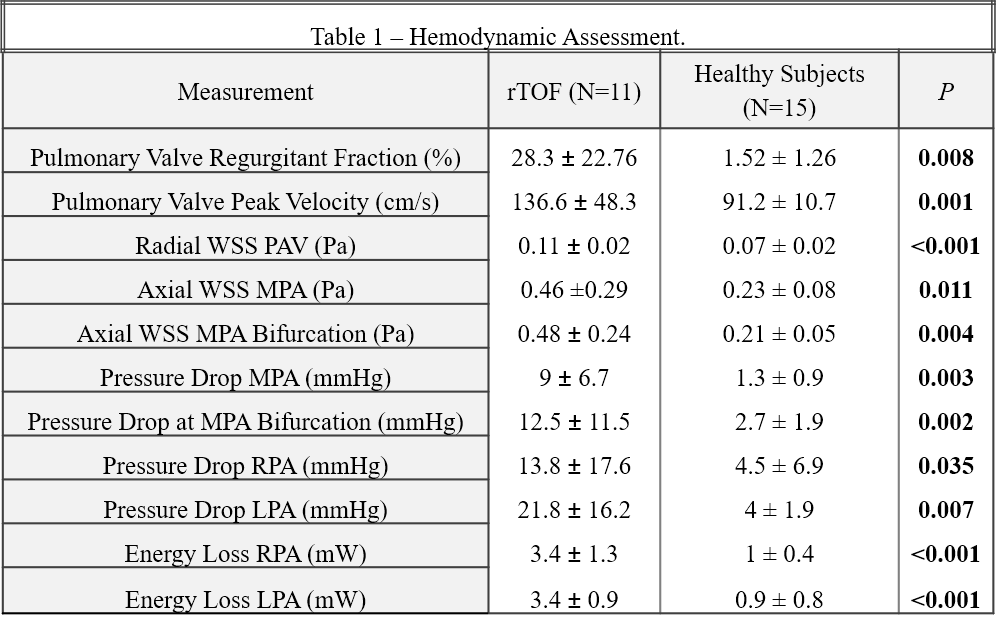
Table 1. Hemodynamic Assessment.
WSS: Wall Shear Stress; MPA: Main Pulmonary Artery; RPA: Right Pulmonary Artery; LPA: Left Pulmonary Artery.
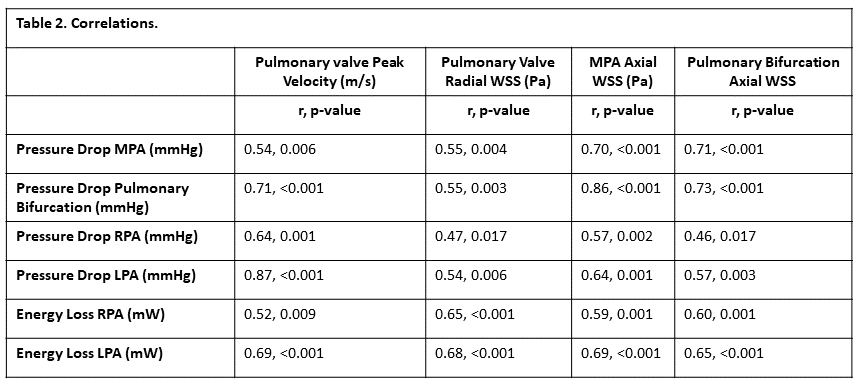
Table 2. Correlations.
WSS: Wall Shear Stress; MPA: Main Pulmonary Artery; RPA: Right Pulmonary Artery; LPA: Left Pulmonary Artery.