1973
Influence of respiration-induced B0 variations in real-time phase contrast MRI of the cerebrospinal fluid1Department of Radiology, University Hospital of Cologne, Cologne, Germany, 2Philips Healthcare Deutschland, Hamburg, Germany
Synopsis
The error induced by susceptibility changes due to respiration in the measurement of CSF flow was investigated. Real-time dynamic B0 measurements and PCMRI images of 10 healthy subjects were acquired. A good agreement was found between both acquisitions. B0 amplitudes and temporal shifts with respect to respiration signals showed dependencies on echo times, temporal distances between phase contrast images and subjects. Resulting errors between 0.4 and 41 % in PCMRI images were shown in simulations. In conclusion, the present work demonstrates that B0 variations during respiration may have a confounding effect when estimating respiration dependent flow in CSF.
Introduction
Main magnetic field B0 inhomogeneities due to susceptibility variations are a well-known cause of diverse artefacts in MRI. Chest motion and local variations in the concentration of paramagnetic oxygen in the lungs induce dynamic B0 variations during respiration, which can reach 70 Hz difference between inspiration and expiration along the human spine at 3T (1-6).
In phase contrast MRI (PCMRI) dynamic B0 inhomogeneities are typically not accounted for. The current work investigates the effect of dynamic B0 changes due to respiration on PCMRI velocity quantification of CSF flow using measurements and simulations.
Methods
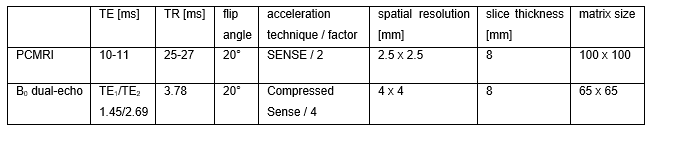
10 healthy subjects were examined on a 3T system (Ingenia, Philips Medical Systems, Best, The Netherlands) at three different transversal slices (levels: C2/C3, C6/C7 and T3/T4) during normal and deep breathing, respectivly. Respiration was recorded using an air-cushion belt. Single-shot EPI PCMRI and real-time flow compensated dual-echo gradient echo images (real-time B0 measurements) were acquired (Table 1).
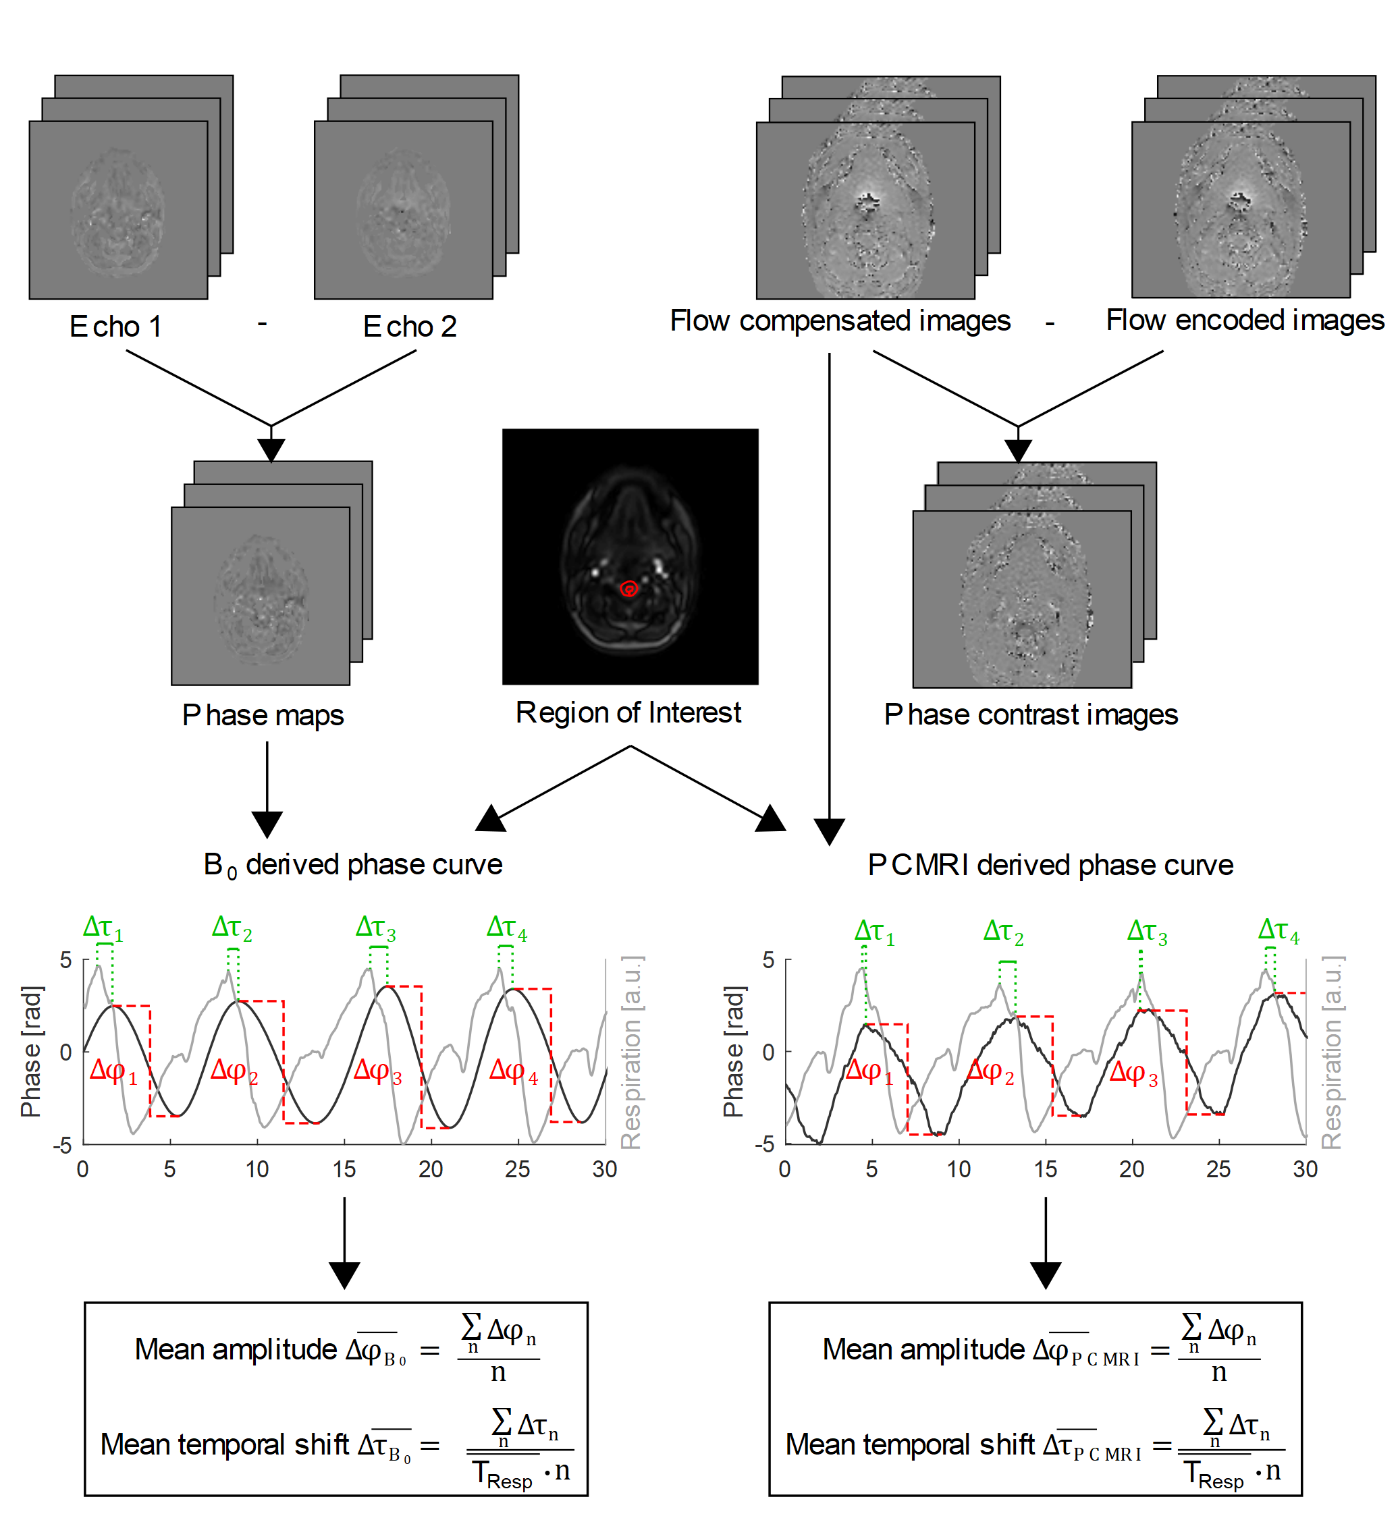
Processing steps to estimate the mean phase amplitude $$$\overline{\Delta φ}$$$ and the mean temporal shift with respect to respiration $$$\overline{\Delta τ}$$$ are shown in Figure 1.
The mean amplitudes of the real-time B0 phase curves were used to simulate sinusoidal breathing curves. From these breathing-induced B0 phase curves, PCMRI phase curves were calculated for different echo times (TEmin = 1 ms to TEmax = 15 ms) as well as different temporal distances Δt between flow encoded and flow compensated acquisitions (Δtmin = 20 ms to Δtmax = 6 s).
Results
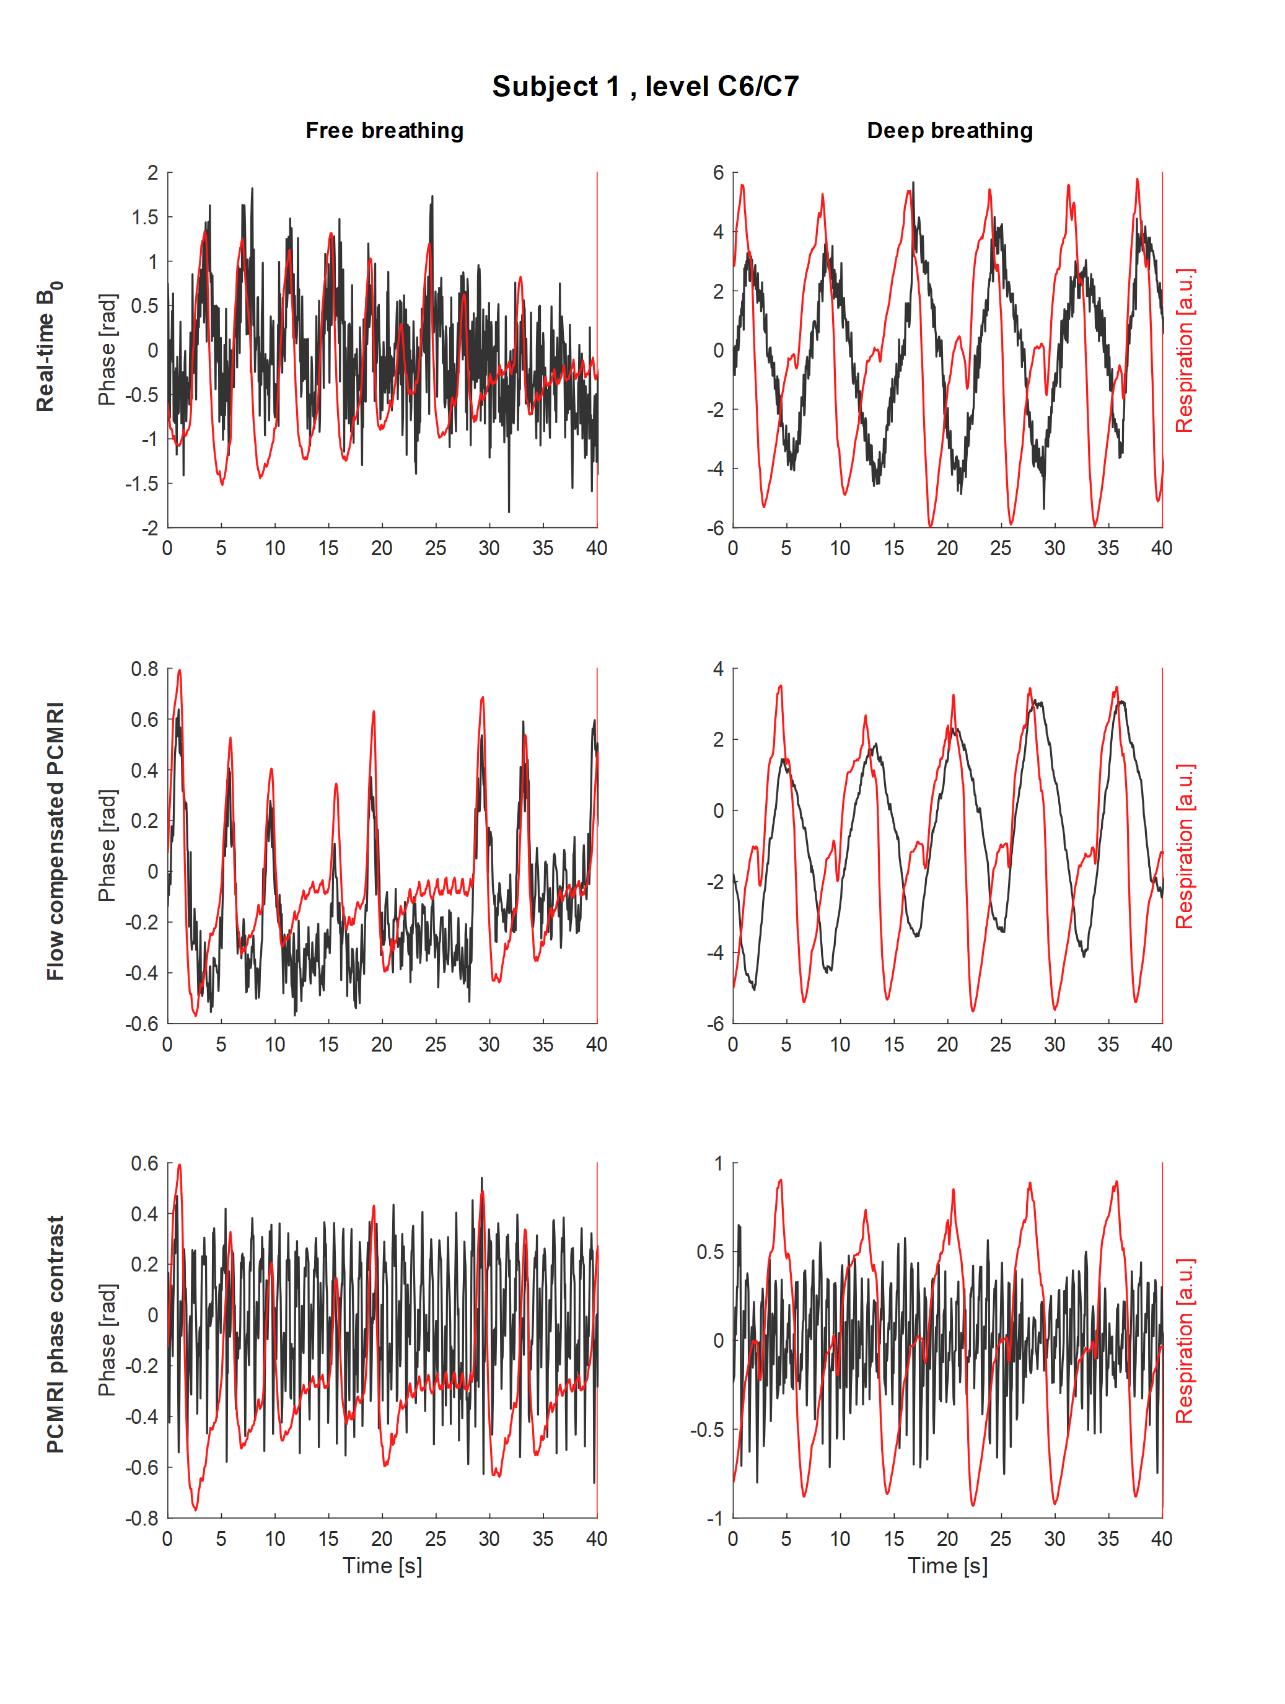
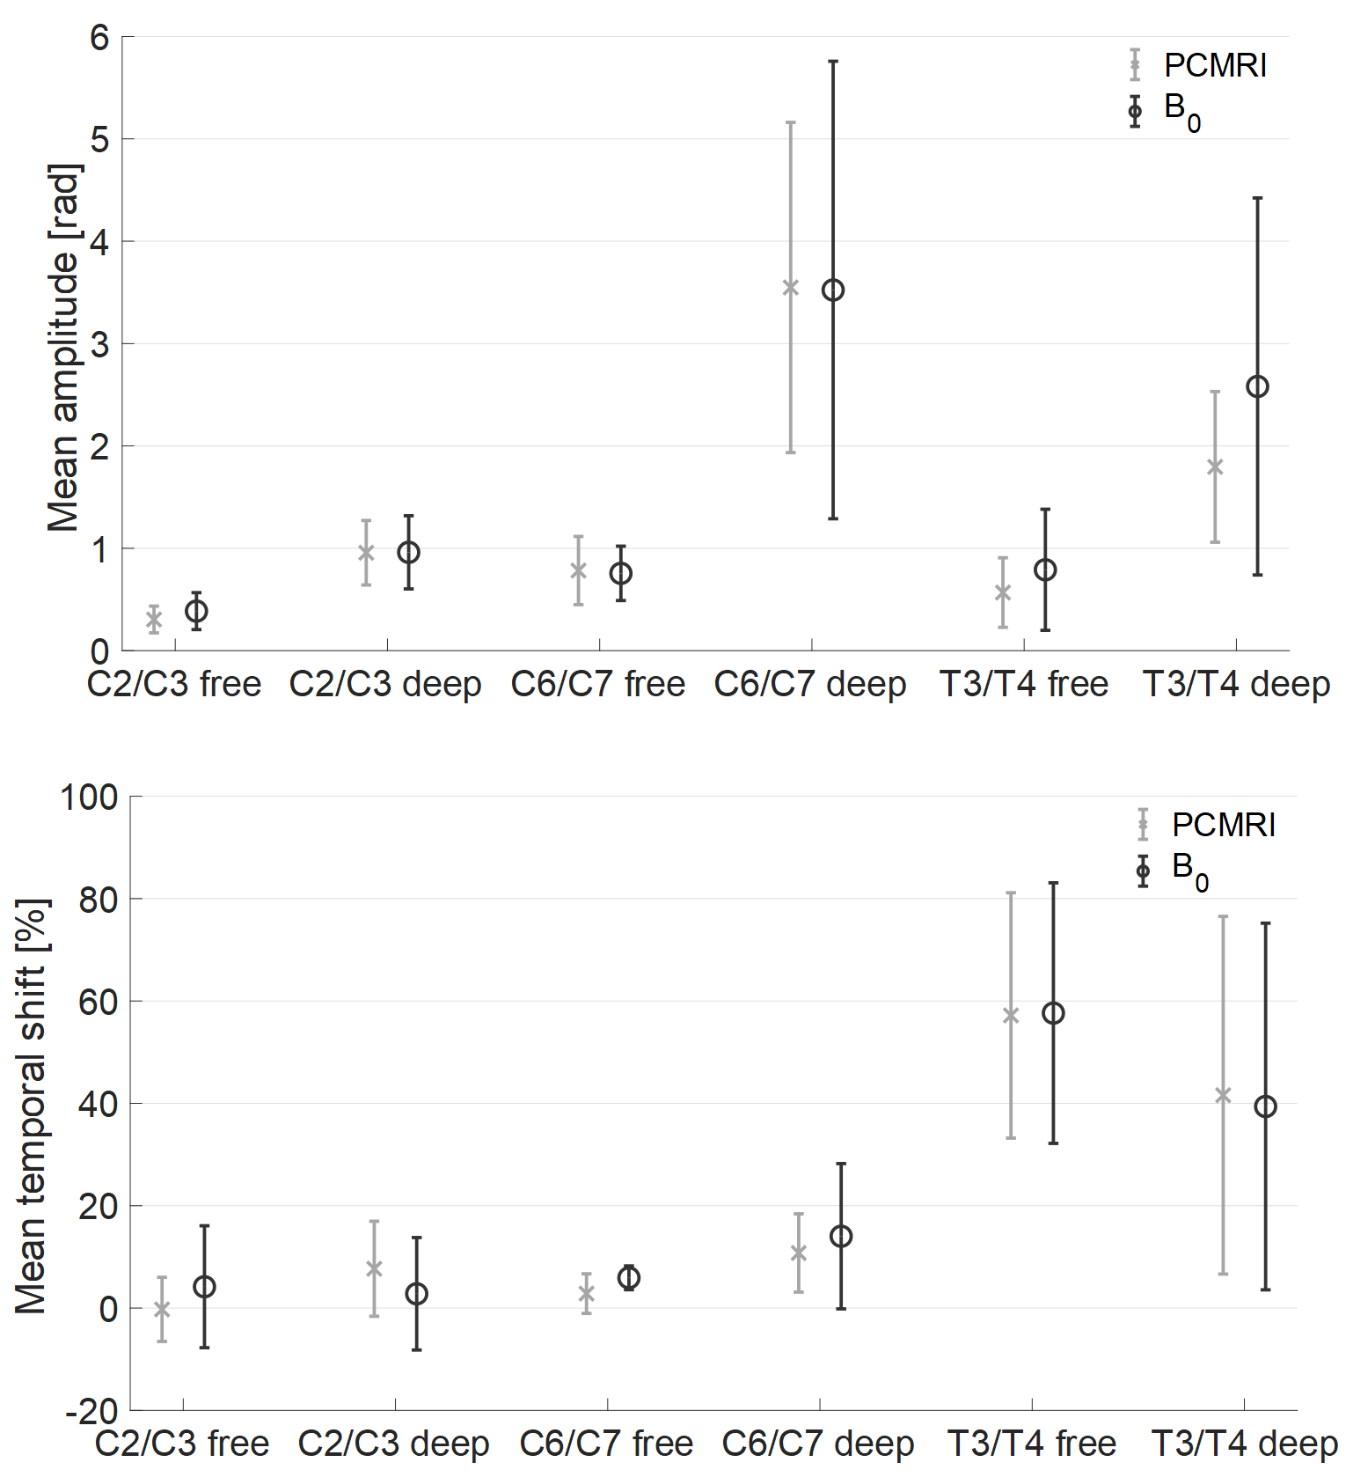
Phase curves of all measurements are exemplary shown for one subject and level in Figure 2. Mean amplitudes of B0 and flow compensated PCMRI derived phase curves range from 0.12 to 8.02 rad (Figure 3, top) and show good agreement. Except for one subject at level T3/T4, all measurements show larger amplitudes during deep breathing than normal breathing.
Mean temporal shifts over all subjects between phase and respiration curves range from 0.3 % to 57.7 % (Figure 3, bottom) and are larger at level T3/T4 than C2/3 and C6/7. Due to periodicity, temporal shifts between 80 % and 100 % of the respiration period length were defined as temporal shifts between -20 % and 0 %.
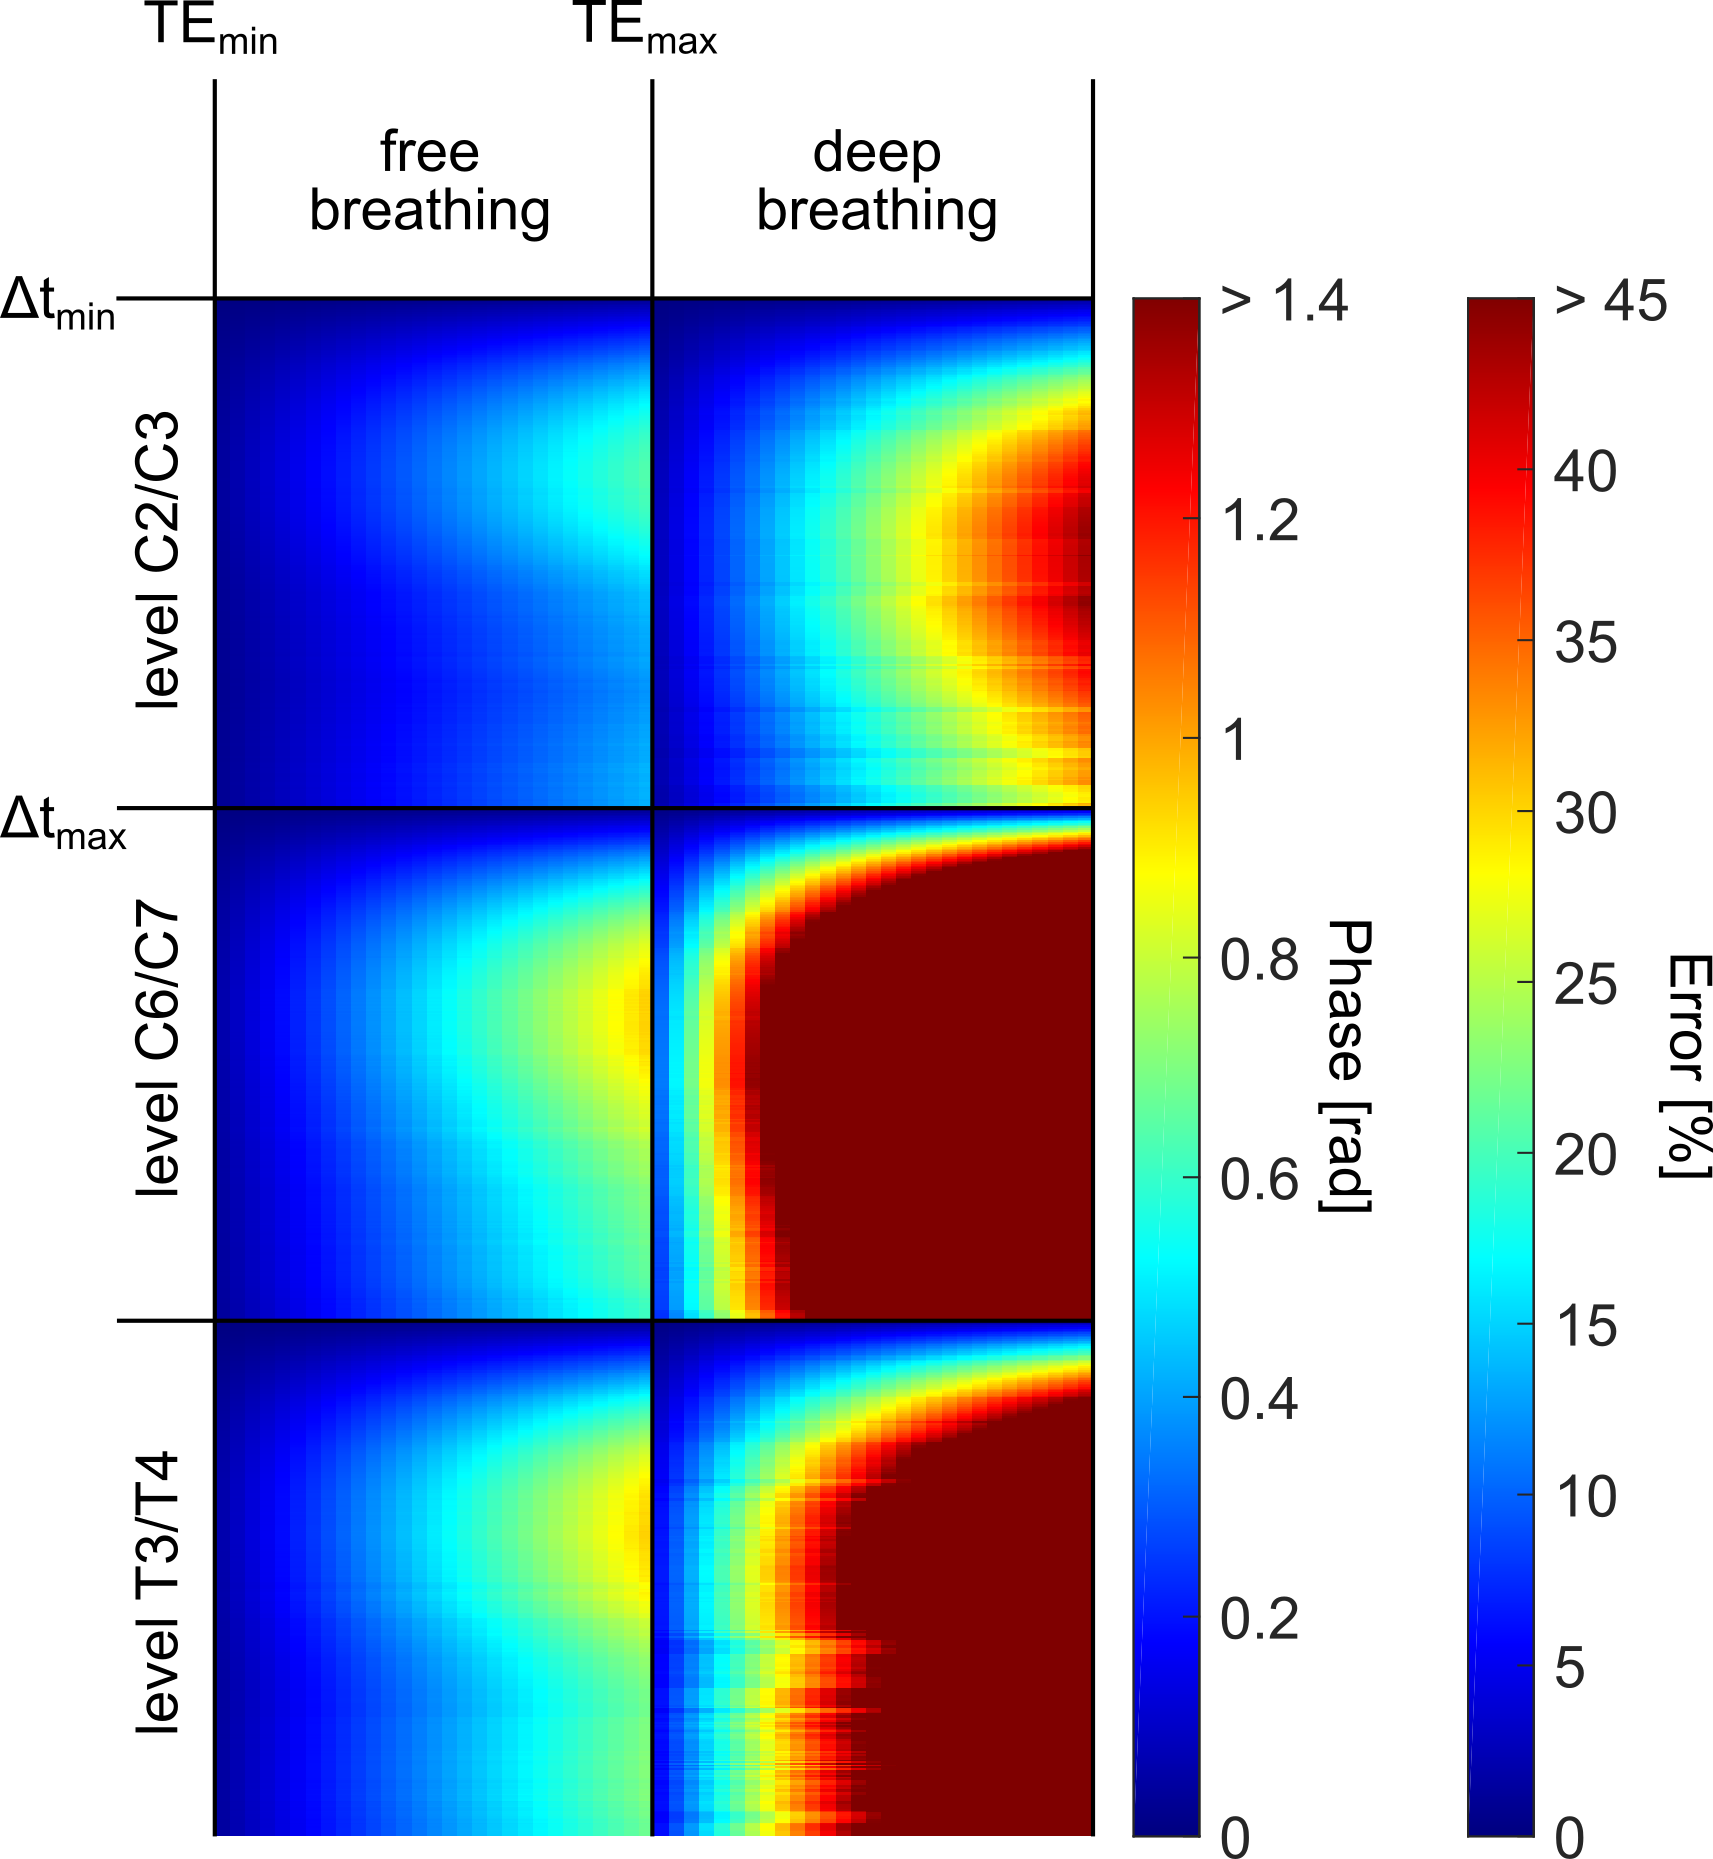
The results of the simulated phase offset amplitudes due to respiration-induced B0 variations in PCMRI phase contrast images for different echo times TE and temporal segment distance Δt are shown in Figure 4. Large variations are seen between levels, TE and Δt. This results in mean errors of 0.4 % in PCMRI velocity quantification during free breathing and 1.1 % during deep breathing for TE and Δt used in the measurements in this work. For the same TE but Δt = 1 s, simulations show mean errors of 13.2 % during normal and 41.0 % during deep breathing.
Discussion
The absolute difference of the B0 induced phase between inspiration and expiration shows an increase from level C2/C3 to C6/C7 followed by a decrease to slice T3/T4 for most subjects and larger effects during deep breathing. Temporal shift measurements between respiration and phase curves showed good agreement between the B0 and flow compensated PCMRI images. Most subjects showed a conversion of the respiration correlation of B0 as a temporal shift of about 50% at level T3/T4, in-line with previous B0 measurements during breath-holds (4).
Simulations show an inter-subject dependency and an error increase with increasing TE. An increase followed by a decrease in background phase with Δt is observed with a periodicity of the respiratory cycle.
In typical PCMRI measurements of the CSF, the herewith described effect of B0 variations due to breathing is not eliminated by the subtraction of one flow compensated and flow encoded acquisition. Hence, the dynamic background phase can be misinterpreted as velocity and flow changes due to respiration.
As compared to eddy-current related phase offsets, correctable to under 0.6 % of the VENC (7), the simulations show that errors with a similar order of magnitude are observed during normal respiration (0.4% over all subjects). However, the mean error is increased during deep respiration with 1.1 % reaching 3.7 % at specific locations in individual subjects.
Conclusion
In this work, the influence of respiration induced B0 variations on CSF velocity quantifications using PCMRI was investigated. B0 variations at three different levels along the spinal cord showed a dependency on spatial distribution, respiration depth, TE and temporal distance between phase contrast images. In conclusion, residual background phases due to respiration in real-time PCMRI of the CSF can be a confounding effect of respiration-induced flow changes and therefore cannot be ignored.Acknowledgements
This project was supported by Deutsche Forschungsgemeinschaft (DFG - project number 317275652).References
1. Raj D, Paley DP, W. Anderson A, Kennan RP, Gore JC. A model for susceptibility artefacts from respiration in functional echo-planar magnetic resonance imaging. Physics in Medicine & Biology 2000;45(12):3809.
2. Raj D, Anderson AW, Gore JC. Respiratory effects in human functional magnetic resonance imaging due to bulk susceptibility changes. Phys Med Biol 2001;46(12):3331-3340.
3. Van de Moortele PF, Pfeuffer J, Glover GH, Ugurbil K, Hu X. Respiration-induced B0 fluctuations and their spatial distribution in the human brain at 7 Tesla. Magn Reson Med 2002;47(5):888-895.
4. Verma T, Cohen-Adad J. Effect of respiration on the B0 field in the human spinal cord at 3T. Magn Reson Med 2014;72(6):1629-1636.
5. Vannesjo SJ, Miller KL, Clare S, Tracey I. Spatiotemporal characterization of breathing-induced B0 field fluctuations in the cervical spinal cord at 7T. Neuroimage 2017;167:191-202.
6. Peters K, Bastkowski R, Weiss K, Maintz D, Giese D. Influence of respiration-induced B0 variations in CSF flow quantification. In Proceedings of the Joint Annual Meeting ISMRM-ESMRMB 2018, Paris, France 2018;4896.
7. Giese D, Haeberlin M, Barmet C, Pruessmann KP, Schaeffter T, Kozerke S. Analysis and correction of background velocity offsets in phase-contrast flow measurements using magnetic field monitoring. Magn Reson Med 2012;67(5):1294-1302.
Figures