1970
Objective extraction of the temporal evolution of the mitral valve vortex ring from 4D flow MRI1Department of Radiology, Medical University of Graz, Graz, Austria, 2Institute of Medical Engineering, Graz University of Technology, Graz, Austria, 3Department of Internal Medicine, Medical University of Graz, Graz, Austria, 4Siemens Healthcare GmbH, Erlangen, Germany, 5Computer Vision Center, Universitat Autònoma de Barcelona, Barcelona, Spain, 6Research and Development, Siemens Healthcare Diagnostics GmbH, Graz, Austria
Synopsis
The mitral valve vortex ring is a promising flow structure for analysis of diastolic function, however, methods for objective extraction of its formation to dissolution are lacking. We present a novel algorithm for objective extraction of the temporal evolution of the mitral valve vortex ring from magnetic resonance 4D flow data and validated the method against visual analysis. The algorithm successfully extracted mitral valve vortex rings during both early- and late-diastolic filling and agreed substantially with visual assessment. Early-diastolic mitral valve vortex ring properties differed between healthy subjects and patients with ischemic heart disease.
Introduction
Blood flow into the left ventricle (LV) is accompanied by formation of a three-dimensional vortex ring at the mitral valve (MV) leaflets, which is considered to support ventricular filling and diastolic function.1 Time-resolved three-directional cardiovascular magnetic resonance phase-contrast imaging (4D flow) is a promising approach to study the MV vortex ring.2,3 However, methods for objective extraction of the vortex ring from its formation to dissolution are lacking. We propose an algorithm for objective extraction of the temporal evolution of the MV vortex ring from 4D flow data and aimed to validate it against visual analysis and compare vortex ring properties of healthy controls and patients with chronic ischemic heart disease (IHD).Methods
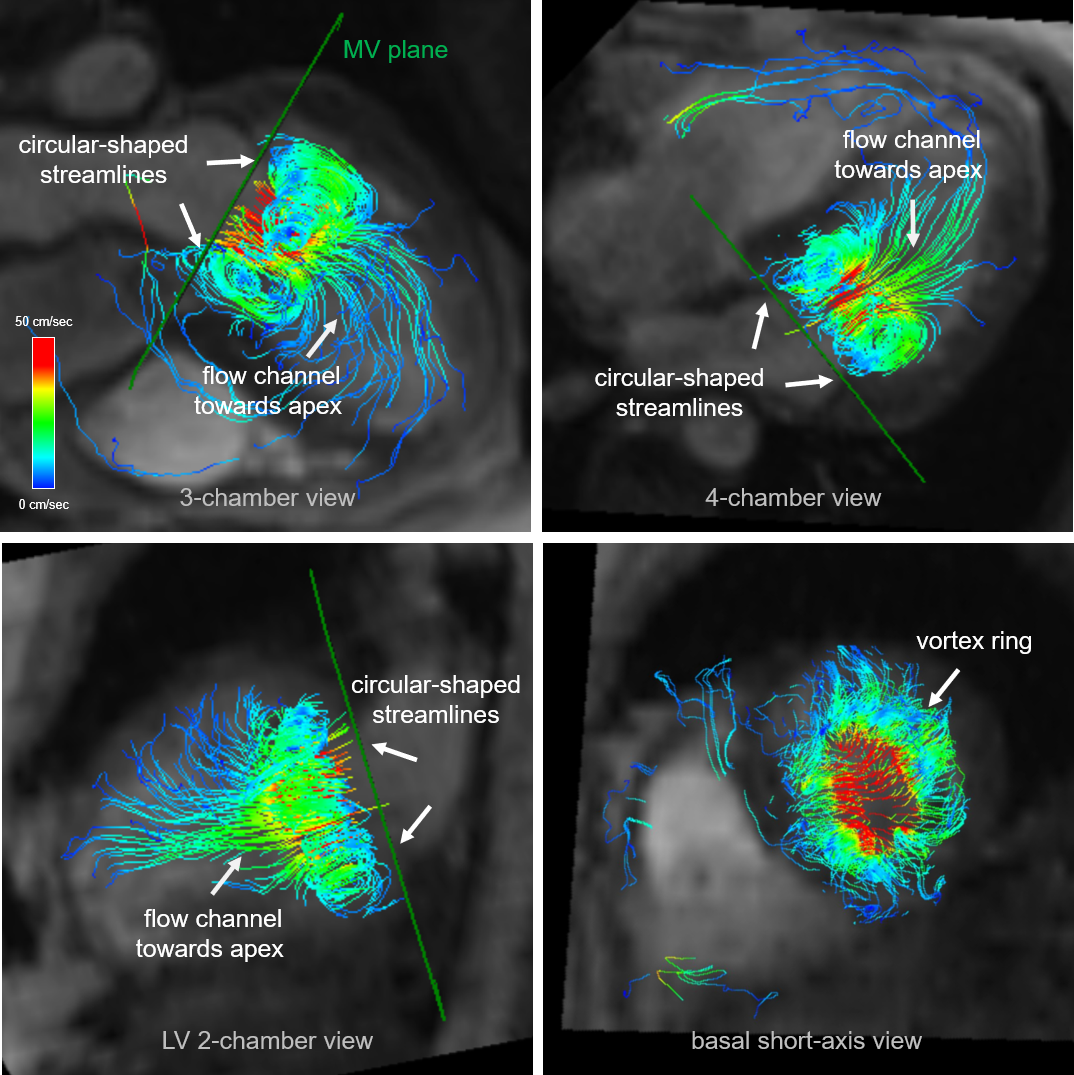
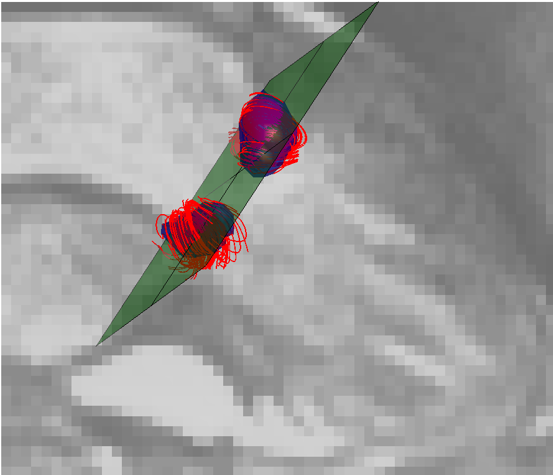
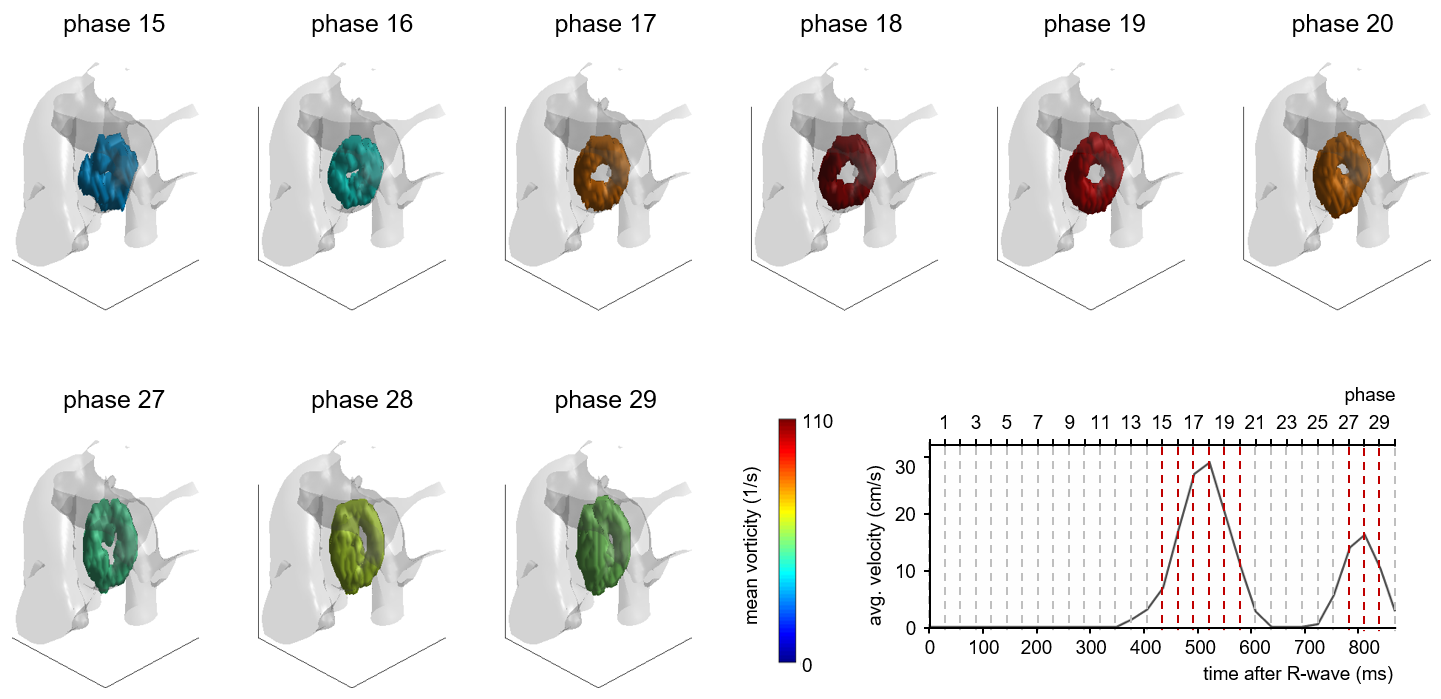
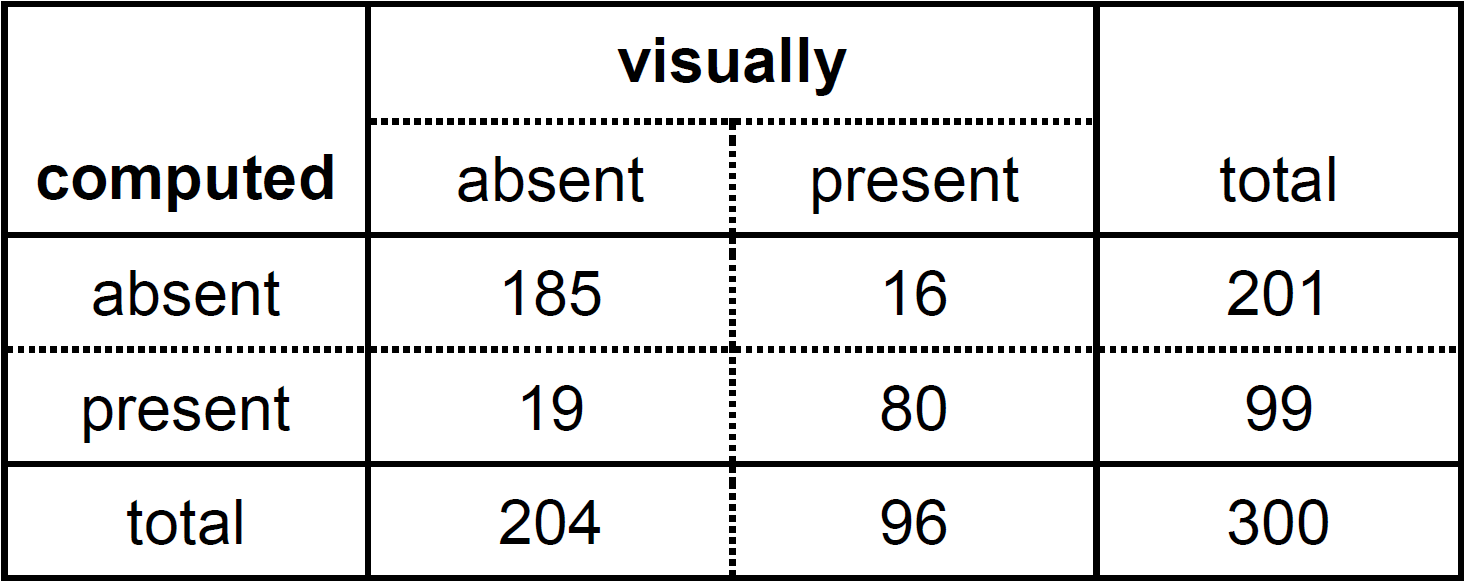
10 subjects (3 IHD patients, 7 age-matched healthy controls) underwent 4D flow imaging of the LV at 3T (Magnetom Skyra, Siemens Healthcare, Erlangen, Germany). Imaging parameters of the two-dimensional retrospectively-ECG-gated phase-contrast sequence were velocity encoding 100 cm/s in all directions, measured temporal resolution 41 ms interpolated to 30 cardiac phases, echo time 3.1 ms, flip angle 12-20°, voxel size 1.8x2.5x4 mm3, and two-fold averaging. Prototype software (4DFlow, Siemens Healthcare, Erlangen, Germany) was employed for pre-processing of LV velocity fields (phase offset error correction, LV segmentation), determination of onset, peak and end of early-diastolic (E-wave) and late-diastolic (A-wave) inflow as well as streamline visualization of LV blood flow. The latter was analyzed qualitatively in each phase for the presence of an MV vortex ring (Figure 1). MV vortex ring extraction from LV velocity fields was performed using in-house software implemented in Matlab (MathWorks Inc., Natick, MA) in 6 steps. 1) After vector field decomposition,4 voxel-wise Q-values5 were calculated from the velocity gradient tensor using the divergence-free part of the LV velocity field. 2) Q-fields were spatially and temporally filtered to remove noise and vortex structures with very short life time. 3) For each phase, the regions of strongest vortical flow (Q-seeds) were calculated based on the locations of maximal Q throughout the cardiac cycle. 4) Principal component analysis was employed to facilitate determination of target Q-seeds for each phase, which were used as starting structures for a region growing algorithm. 5) Region growing counted voxels as part of an MV vortex structure if Q>0, according to the Q-criterion,5 and if distance constraints to the principal plane of the target Q-seeds were fulfilled (Figure 2). 6) MV vortex structures with a toroid-like or U-shape were classified as MV vortex ring (Figure 3). Existence and duration of computed and visually detected MV vortex rings were compared by kappa statistics and paired t-test, respectively. For each phase, mean vorticity was calculated inside the MV vortex structure using the undecomposed velocity field; characteristics of mean vorticity’s time course in patients and healthy controls were compared using unpaired t-test. p<0.05 was considered as significant.Results
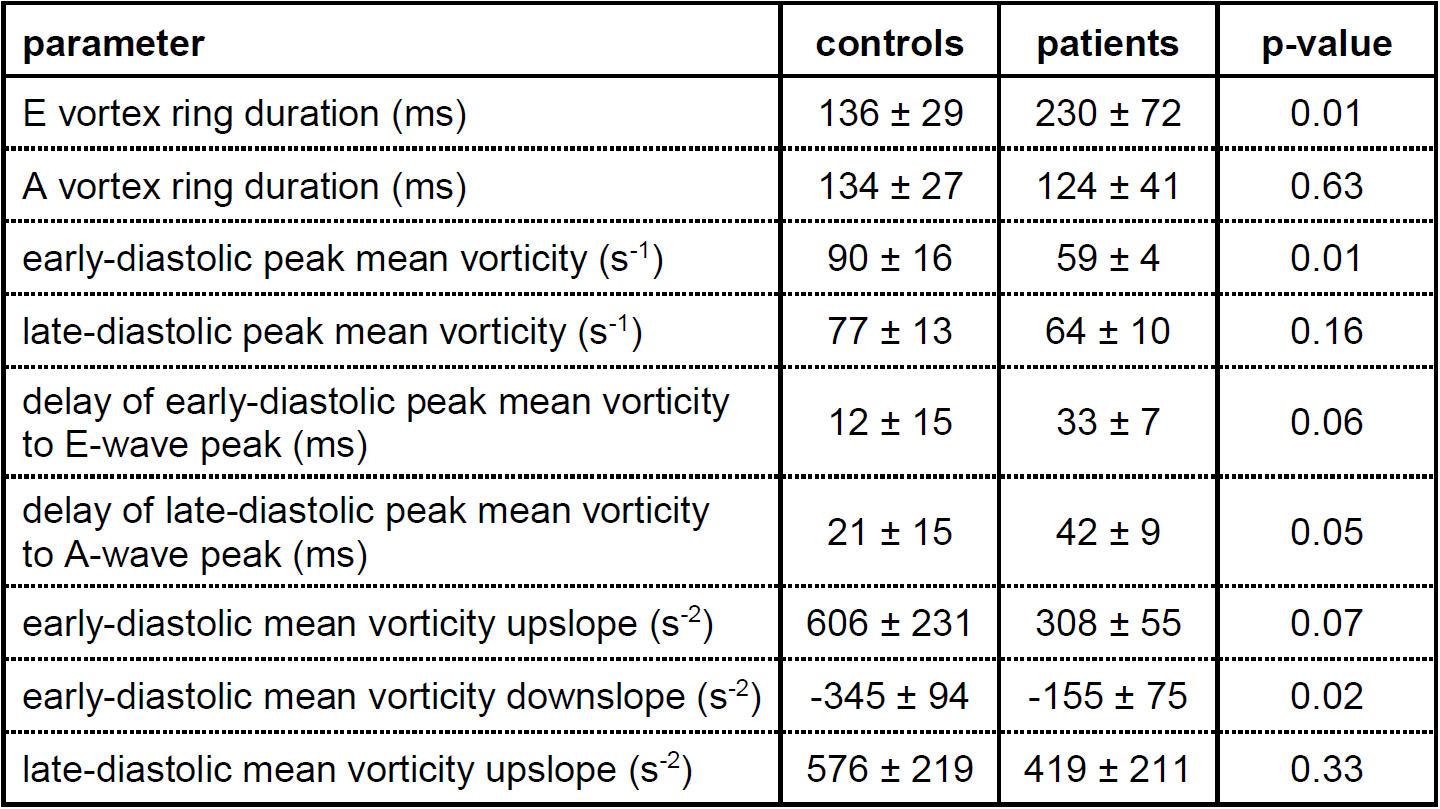
Two periods of MV vortex ring existence, the first starting during E-wave (E vortex ring), the second starting during A-wave (A vortex ring), were found for all subjects by both computational and visual detection. Moreover, both methods found MV vortex rings at E- and A-wave peak for all subjects. Agreement of MV vortex ring existence in individual cardiac phases between the two methods was substantial (kappa = 0.73, Table 1). While MV vortex ring durations as well as ends of MV vortex ring existence did not differ between methods, onsets of MV vortex ring formation were earlier for computed vortex rings (bias E vortex ring = 28 ms, p<0.01; bias A vortex ring = 24 ms, p<0.01). In all subjects, mean vorticity of MV vortex structure demonstrated a bi-phasic time course with maxima (delay to E-wave peak = 19±16 ms; delay to A-wave peak = 27±16 ms) associated with MV vortex rings. Whereas A vortex ring characteristics were not different between healthy controls and patients, E vortex rings differed in several parameters (Table 2).Discussion and conclusion
The proposed method successfully extracted the temporal evolution of the MV vortex ring during both early- and late-diastolic filling. Differences between computed and visually detected vortex ring onset times can be explained by the difficulty to identify subtle vortical structures visually. As vortex rings were detected in healthy as well as heavily diseased subjects, the proposed algorithm can be considered a robust method for objective MV vortex ring extraction. Differences between early-diastolic MV vortex ring properties in healthy controls and IHD patients confirmed the assumption that MV vortex ring alterations are associated with LV diastolic dysfunction, which, however, needs to be evaluated in larger cohort studies.Acknowledgements
We thankfully acknowledge the support of the OeNB Anniversary Fund (Grant No. 17934 and 15702).References
1. Charonko J J, Kumar R, Stewart K, et al. Vortices formed on the mitral valve tips aid normal left ventricular filling. Ann Biomed Eng. 2013;41(5):1049-1061.
2. Elbaz M S, Calkoen E E, Westenberg J J, et al. Vortex flow during early and late left ventricular filling in normal subjects: quantitative characterization using retrospectively-gated 4D flow cardiovascular magnetic resonance and three-dimensional vortex core analysis. J Cardiovasc Magn Reson. 2014;16(1):78.
3. Töger J, Kanski M, Carlsson M, et al. Vortex ring formation in the left ventricle of the heart: analysis by 4D flow MRI and Lagrangian coherent structures. Ann Biomed Eng. 2012;40(12):2652-2662.
4. Bhatia H, Norgard G, Pascucci V, et al. The Helmholtz-Hodge decomposition - a survey. IEEE Transactions on Visualization and Computer Graphics. 2013;19(8):1386-1404.
5. Hunt J C R. Vorticity and vortex dynamics in complex turbulent flows. Transactions of the Canadian Society for Mechanical Engineering. 1987;11(1):21-35.
Figures