1969
How gating affects 2D phase contrast flow in the ascending aorta at 7.0T MRI1Comprehensive Heart Failure Center, University Hospital Wuerzburg, Wuerzburg, Germany, 2Department of Radiology, University Hospital Wuerzburg, Wuerzburg, Germany
Synopsis
2D phase contrast MRI offers a fast method for blood flow evaluation in the ascending aorta which can be used for estimation of left ventricular function. With proper ECG or acoustic triggering, forward flow in the aortic root (FFAo) should resemble left ventricular stroke volume (LVSV) in absence of valve disease. However, for ultra-high field strengths (≥7.0T) flow parameters in the ascending aorta derived from phase contrast have not yet been validated. Our results suggest that accurate gating reduces cardiac motion artifacts for 7.0T to an extent where LVSV can be estimated reliably based on FFAo in phase contrast sequences.
Introduction
Cardiovascular magnetic resonance imaging (CMR) is established as a non-invasive method for quantifying ventricular function and flow measurement in the aortic root at clinical field strenghts.1,2,3 In order to provide optimal image quality and reduce motion artifacts, data acquisition has to be synchronized with the beat of heart using a gating method.4 Due to its potential of increased signal-to-noise ratio (SNR), which facilitates higher resolution and acquisition speed as well as possibly new diagnostic information, there is growing demand for the application of ultra-high field scanners in CMR. Technical challenges increase with the magnetic field strength though.5 We report results of 2D phase contrast flow measurement in the ascending aorta by quantifying the influence of using ECG and acoustic (AC) gating, left ventricular stroke volume (LVSV) and left ventricular ejection fraction (LVEF) with a 7T Siemens Magnetom™ Terra whole-body MRI system. The purpose of this work was to compare the impact of proper ECG and external acoustic triggering on flow parameters in the aortic root of healthy subjects derived from 2D phase contrast imaging at 7.0T CMR.Methods
We examined N = 30 healthy volunteers with local ethic committee approval using a 1TX/16RX thorax coil (MRI.Tools, Berlin, Germany). 28 subjects (14 male, 14 female) were included into analysis after two subjects (1 male, 1 female) had to be excluded due to strong artifacts. Phase contrast sequences with ECG and acoustic triggering (MRI.Tools, Berlin, Germany) were acquired (TE = 98.9 ms, TR = 3.2 ms, voxel size 1.5 x 1.5 x 6.0 mm, segments 7 – 9, phases 20 – 25, VENC = 150 m/s). We used ECG and acoustic gating in 25 and 19 participants, respectively. Both gating methods were applied in 16 participants. Additionally, we performed short-axis GRE CINE imaging (TE = 3.57 ms, TR = 30.6 – 88.3 ms, voxel size 0.6 x 0.6 x 6.0 mm, segments 6 – 11, phases 20 – 35, slices 14 – 17) for all subjects during multiple breath-holds to reduce respiratory motion artifacts. Volumetric and flow parameters were analyzed using integrated software Argus Syngo MR (Siemens Medical Systems, Germany) scanner-side.Results
Mean forward flow in the aortic root (FFAo) based on phase contrast sequences was 82.1 ml (SD 19.3 ml) for ECG and 79.9 ml (SD 23.3 ml) for external gating. For LVSV based on GRE CINE imaging results showed a mean of 81.3 ml (SD 17.4 ml) and for LVEF of 62.6 % (SD 5.6 %). FFAo with ECG and acoustic triggering correlated with r = 0.88 (p < 0.01). The mean difference in Bland-Altman analysis was 6.7 ml with a standard error of estimation (SEE) of 12.2 ml. LVSV and FFAo (ECG) correlated with r = 0.93 (p < 0.01) and a mean difference of 0.1 ml (SEE 7.2 ml). The correlation between LVSV and FFAo (AC) was slightly weaker with r = 0.88 (p < 0.01) and a mean difference of 4.7 (SEE 14.3).Conclusion
2D phase contrast flow measurement in the ascending aorta allows for accurate and robust quantification of left ventricular stroke volume and showed potential for assessment of valve disease and heart failure in 7.0T CMR. Both ECG and acoustic gating proved to be reliable methods for reducing the effect of cardiac motion on PC imaging; however, using ECG triggering for synchronization provides a slightly more exact estimation of LVSV than acoustic gating. Synchronization of image acquisition and the cardiac cycle was more reliable using the ECG signal despite magnetohydrodynamic effects.Acknowledgements
German Ministry of Education and Research (BMBF) grants: 01EO1004, 01EO1504.References
- Gatehouse PD, Keegan J, Crowe LA et al. Applications of phase-contrast flow and velocity imaging in cardiovascular MRI. Eur Radiol. 2005;15:2172-84.
- Firmin DN, Nayler GL, Klipstein RH et al. In vivo validation of MR velocity imaging. J comput Assist Tomogr. 1987;11(5):751-6.
- Nayak KS, Nielsen JF, Bernstein MA, et al. Cardiovascular magnetic resonance phase contrast imaging. J Cardiovasc Magn Reson. 2015;17(1):71.
- Jeltsch M, Ranft S, Klass O et al. Evaluation of Accordance of Magnetic Resonance Volumetric and Flow Measurements in Determining Ventricular Stroke Volume in Cardiac Patients, Acta Radiol. 2008;49(5):530-9.
- Karamat MI, Darvish-Molla S, Santos-Diaz A. Opportunities and Challenges of 7 Tesla Magnetic Resonance Imaging: A Review. Crit Rev Biomed Eng. 2016;44(1-2):73-89.
Figures
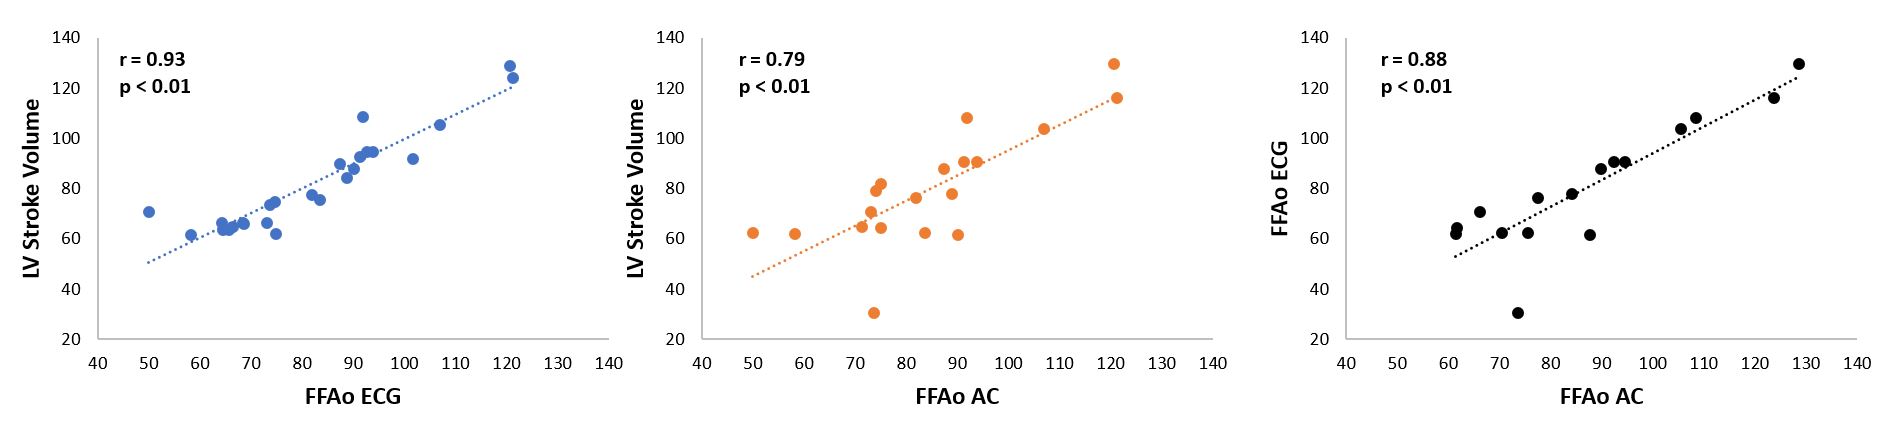
Figure 1 – Correlation of left ventricular function and flow parameters in the ascending aorta
FFAo ECG = aortic forward flow using ECG gating, FFAo AC = aortic forward flow using acoustic gating, r = Pearson correlation coefficient.
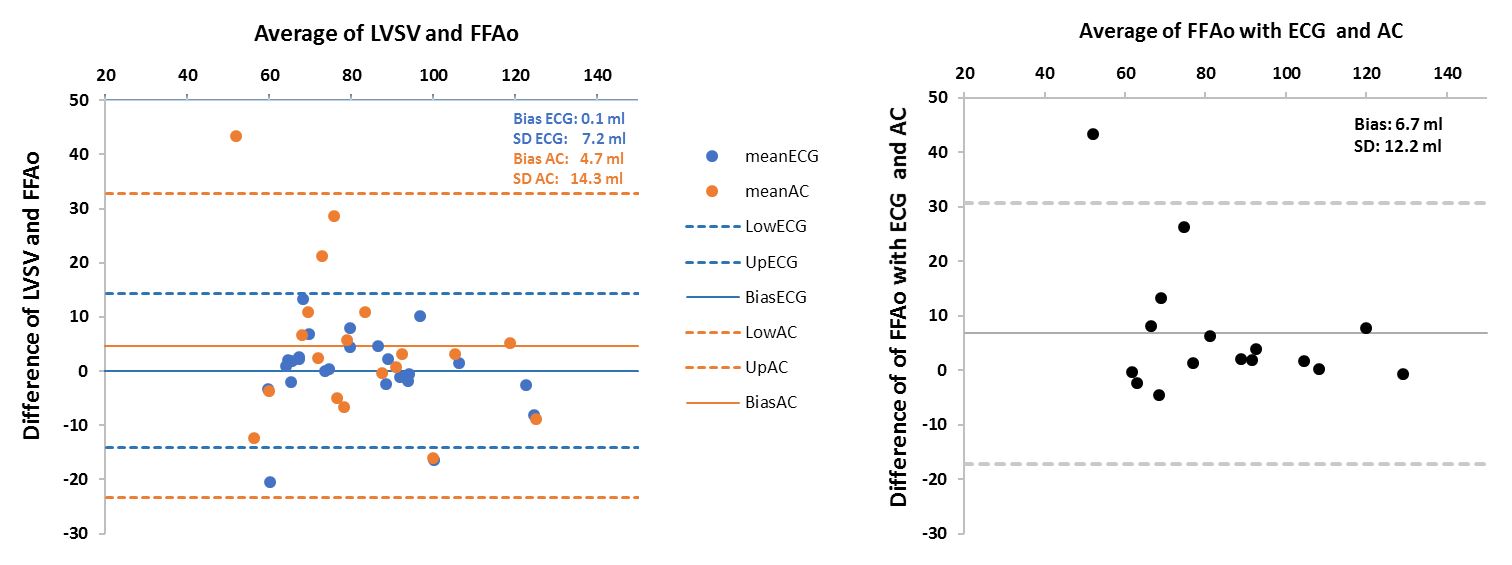
Figure 2 – Bland-Altman plots show the difference between LVSV and FFAo versus the mean of LVSV and FFAo for ECG and acoustic gating
LVSV = left ventricular stroke volume, FFAo = forward flow in ascending aorta, bias = mean difference, SD = standard deviation, Low = minimum value, up = maximum value, ECG = ECG gating, AC = acoustic gating.
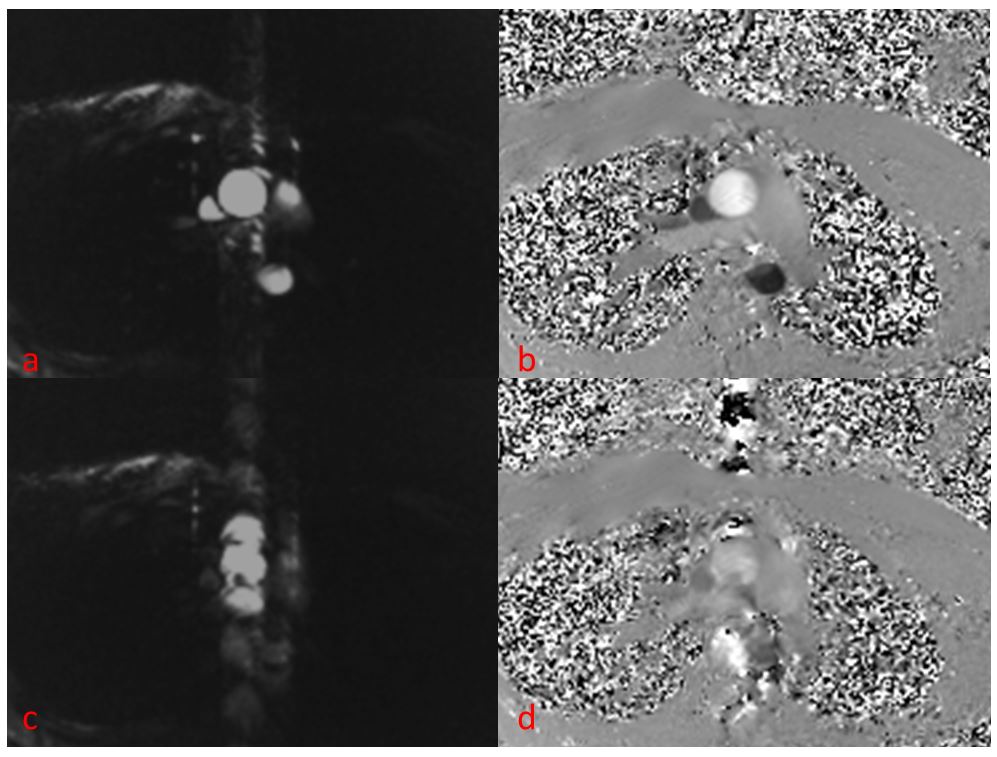
Figure 3 – Impact of ECG gating on phase contrast image quality
left side: magnitude images (a = proper ECG gating, c = poor ECQ gating) right side: blood flow velocity (b = proper ECG gating, d = poor ECG gating)