1967
Computational metrics for quantitative characterization of vortical flow patterns based on 3D PC-MRI data.1Technical University of Munich, Munich, Germany, 2Institute for Imaging Science and Computational Modeling in Cardiovascular Medicine, Charité Universitätsmedizin, Berlin, Germany, 3Fraunhofer Institute for Medical Image Computing, Bremen, Germany, 4German Heart Center, Berlin, Germany
Synopsis
Vortices and helices are crucial features of hemodynamic flow. Such structures may define new clinically relevant biomarkers when assessing cardiovascular pathologies mediated by abnormal flow patterns (e.g. aneurysm formation). Thus, retrieving such structures in time-resolved and velocity-encoded 3D PC-MRI image data is of tremendous interest. However, prior studies only focused on a voxel-wise identification, and are lacking meaningful quantitative metrics which characterize the full vortical flow pattern. The objective of this work is to propose metrics for fully automated detection and quantitative characterization of vortical flow patterns in the aorta.
INTRODUCTION
Vortices and helices are crucial features of hemodynamic flow.1–3 Such structures may define new clinically relevant biomarkers when assessing cardiovascular pathologies mediated by abnormal flow patterns (e.g. aneurysm formation). Thus, retrieving such structures in time-resolved and velocity-encoded 3D PC-MRI image data is of tremendous interest. However, prior studies only focused on a voxel-wise identification, and are lacking meaningful quantitative metrics which characterize the full vortical flow pattern.4–6 The objective of this work is to propose metrics for fully automated detection and quantitative characterization of vortical flow patterns in the aorta.METHODS
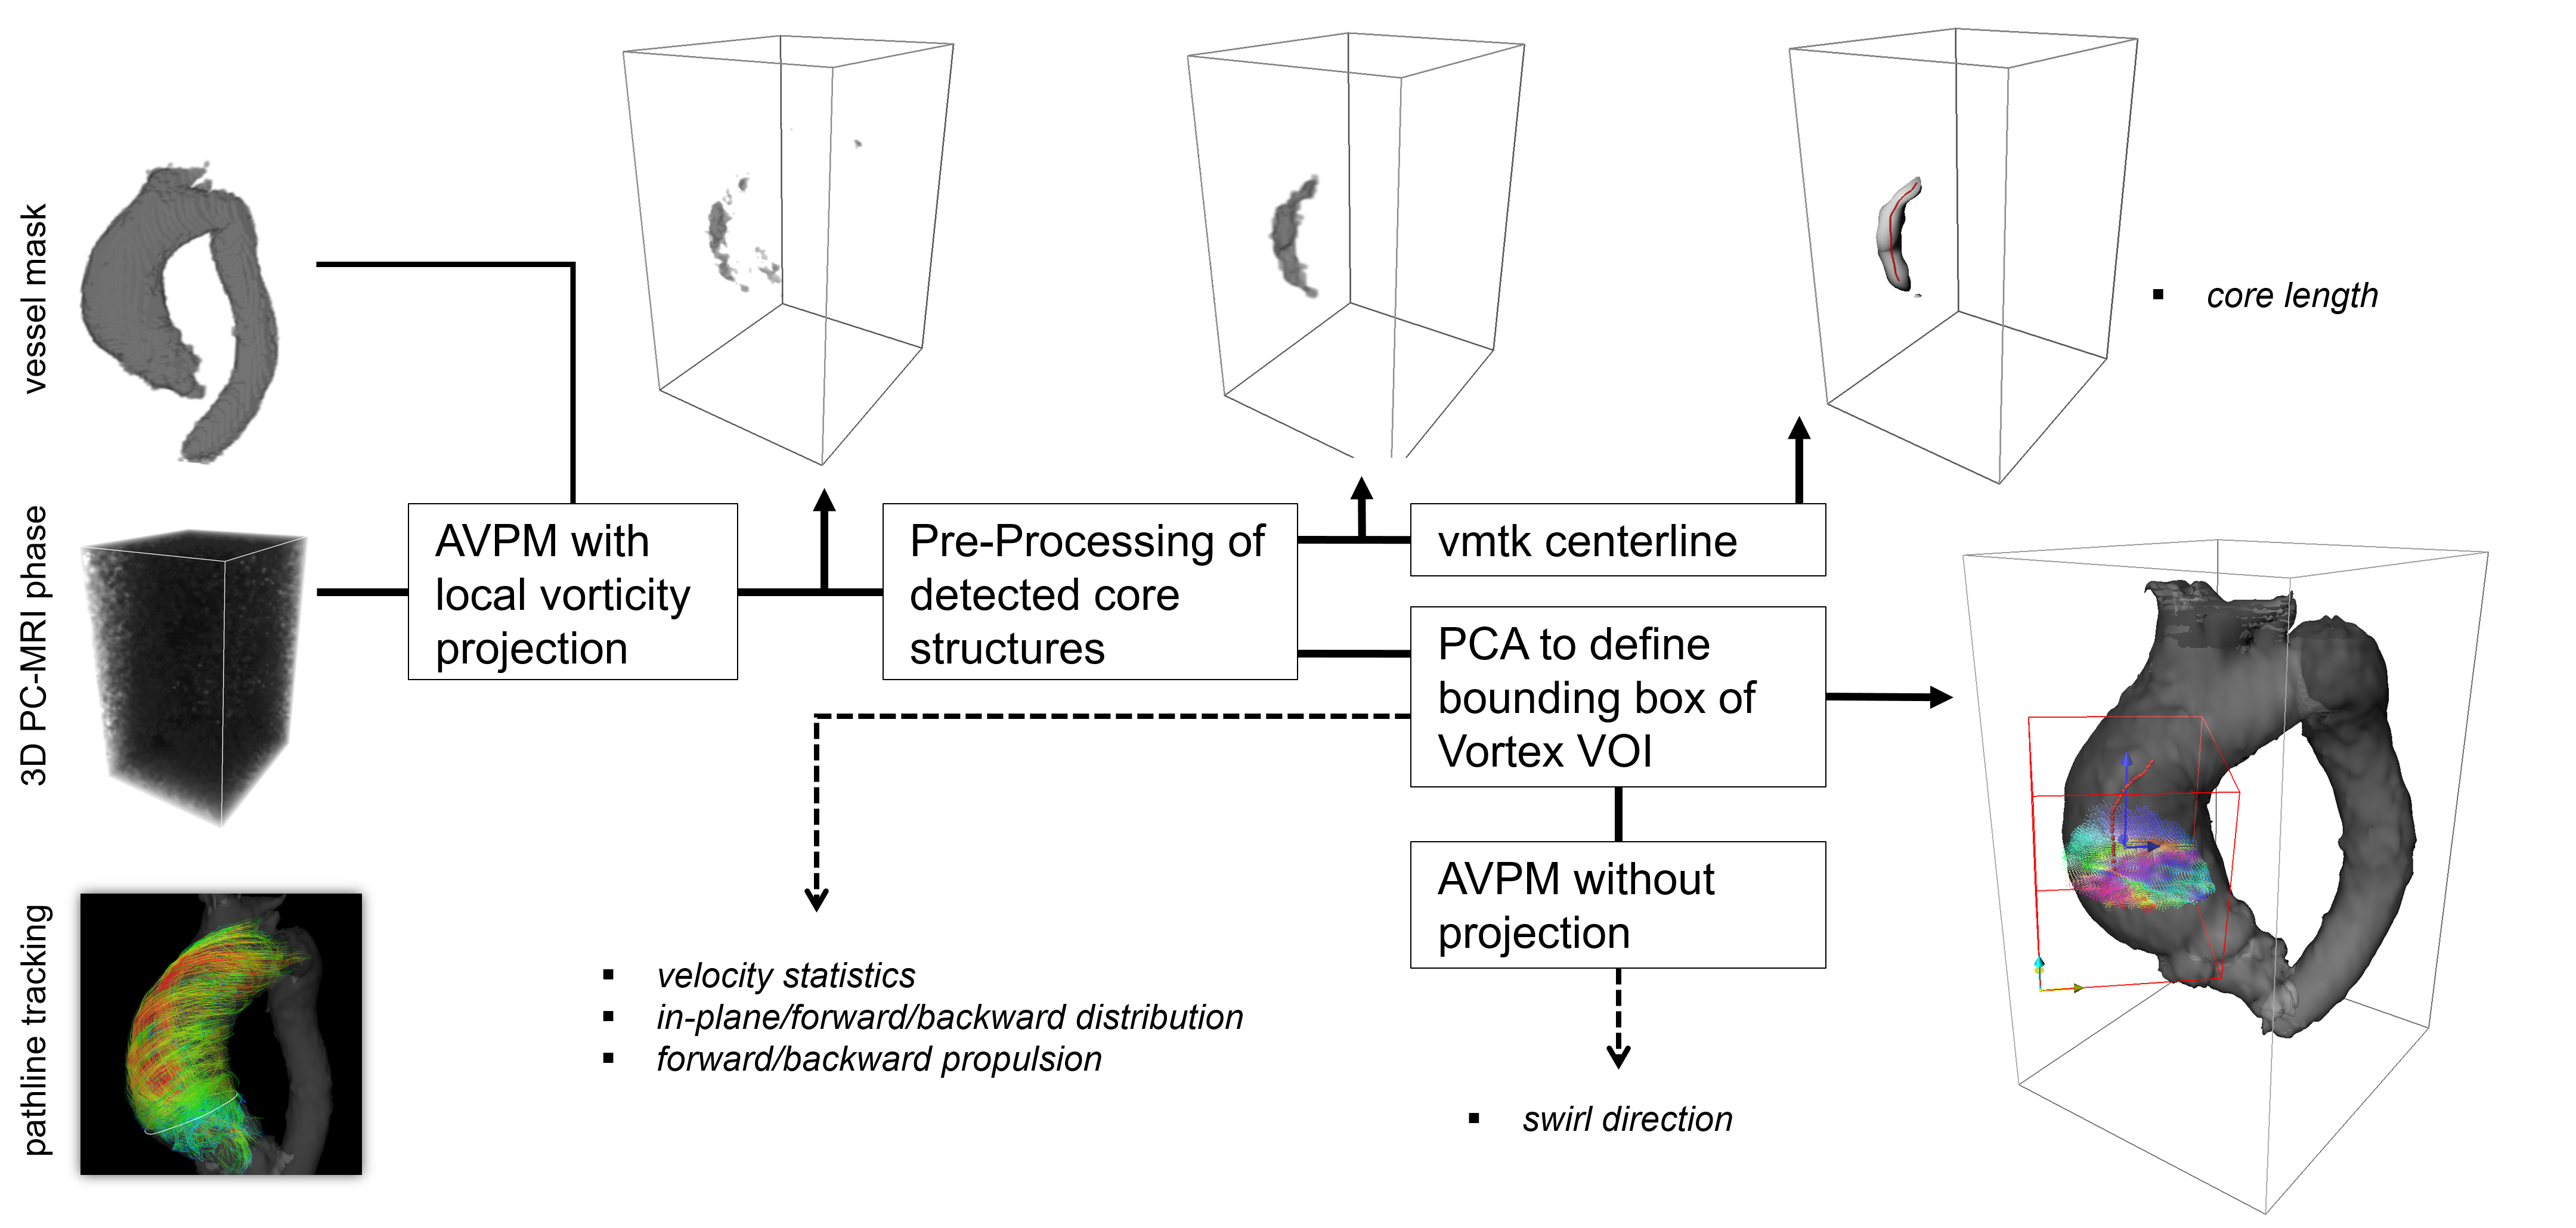
VORTEX VOI (= volume of interest) EXPLORATION: The proposed pipeline builds upon the adaptive vector pattern matching (AVPM) algorithm proposed by Drexl et al.7 AVPM combines template vector pattern matching, initially proposed by Heiberg et al.8, with robust orientation estimation by projecting the local velocity field $$$\vec{v}$$$ onto the local vortical structure orientation \vec{n}, estimated by the integral curl of $$$\vec{v}$$$. We run AVPM on each time frame t of the 3D PC-MRI phase data to generate T [0, T-1] binary 3D vortex core masks. Each 3D vortex core mask is then processed using morphological operations (to retrieve a well-defined core), connected-component-analysis (to distinguish between multiple cores per volume), thresholding (to filter out small cores with number of voxels in core < M, M = 20). Subsequently, each detected core is used to define a Vortex VOI bounding box via principle component analysis (PCA), and to compute the core length via the VMTK centerline algorithm. We further propose quantitative metrics to characterize the flow pattern within each Vortex VOI (figure 1): (1) mean±SD velocity [m/s] over all voxels within bounding box; (2) in-plane/forward/backward flow distribution [% of voxels with respect to all voxels]. Forward is defined as the primary flow direction in the vessel; (3) mean±SD forward/backward propulsion index p [0,1]. For each voxel labeled forward (backward), we compute $$$p=\frac{|v_{tp}|}{|v_{tp}|+|v_{ip}|}$$$ with $$$|v_{tp}|$$$ = forward (backward)-component, and $$$|v_{ip}|$$$ = in-plane-component; (4) swirl direction (left/right) with respect to the primary flow direction.
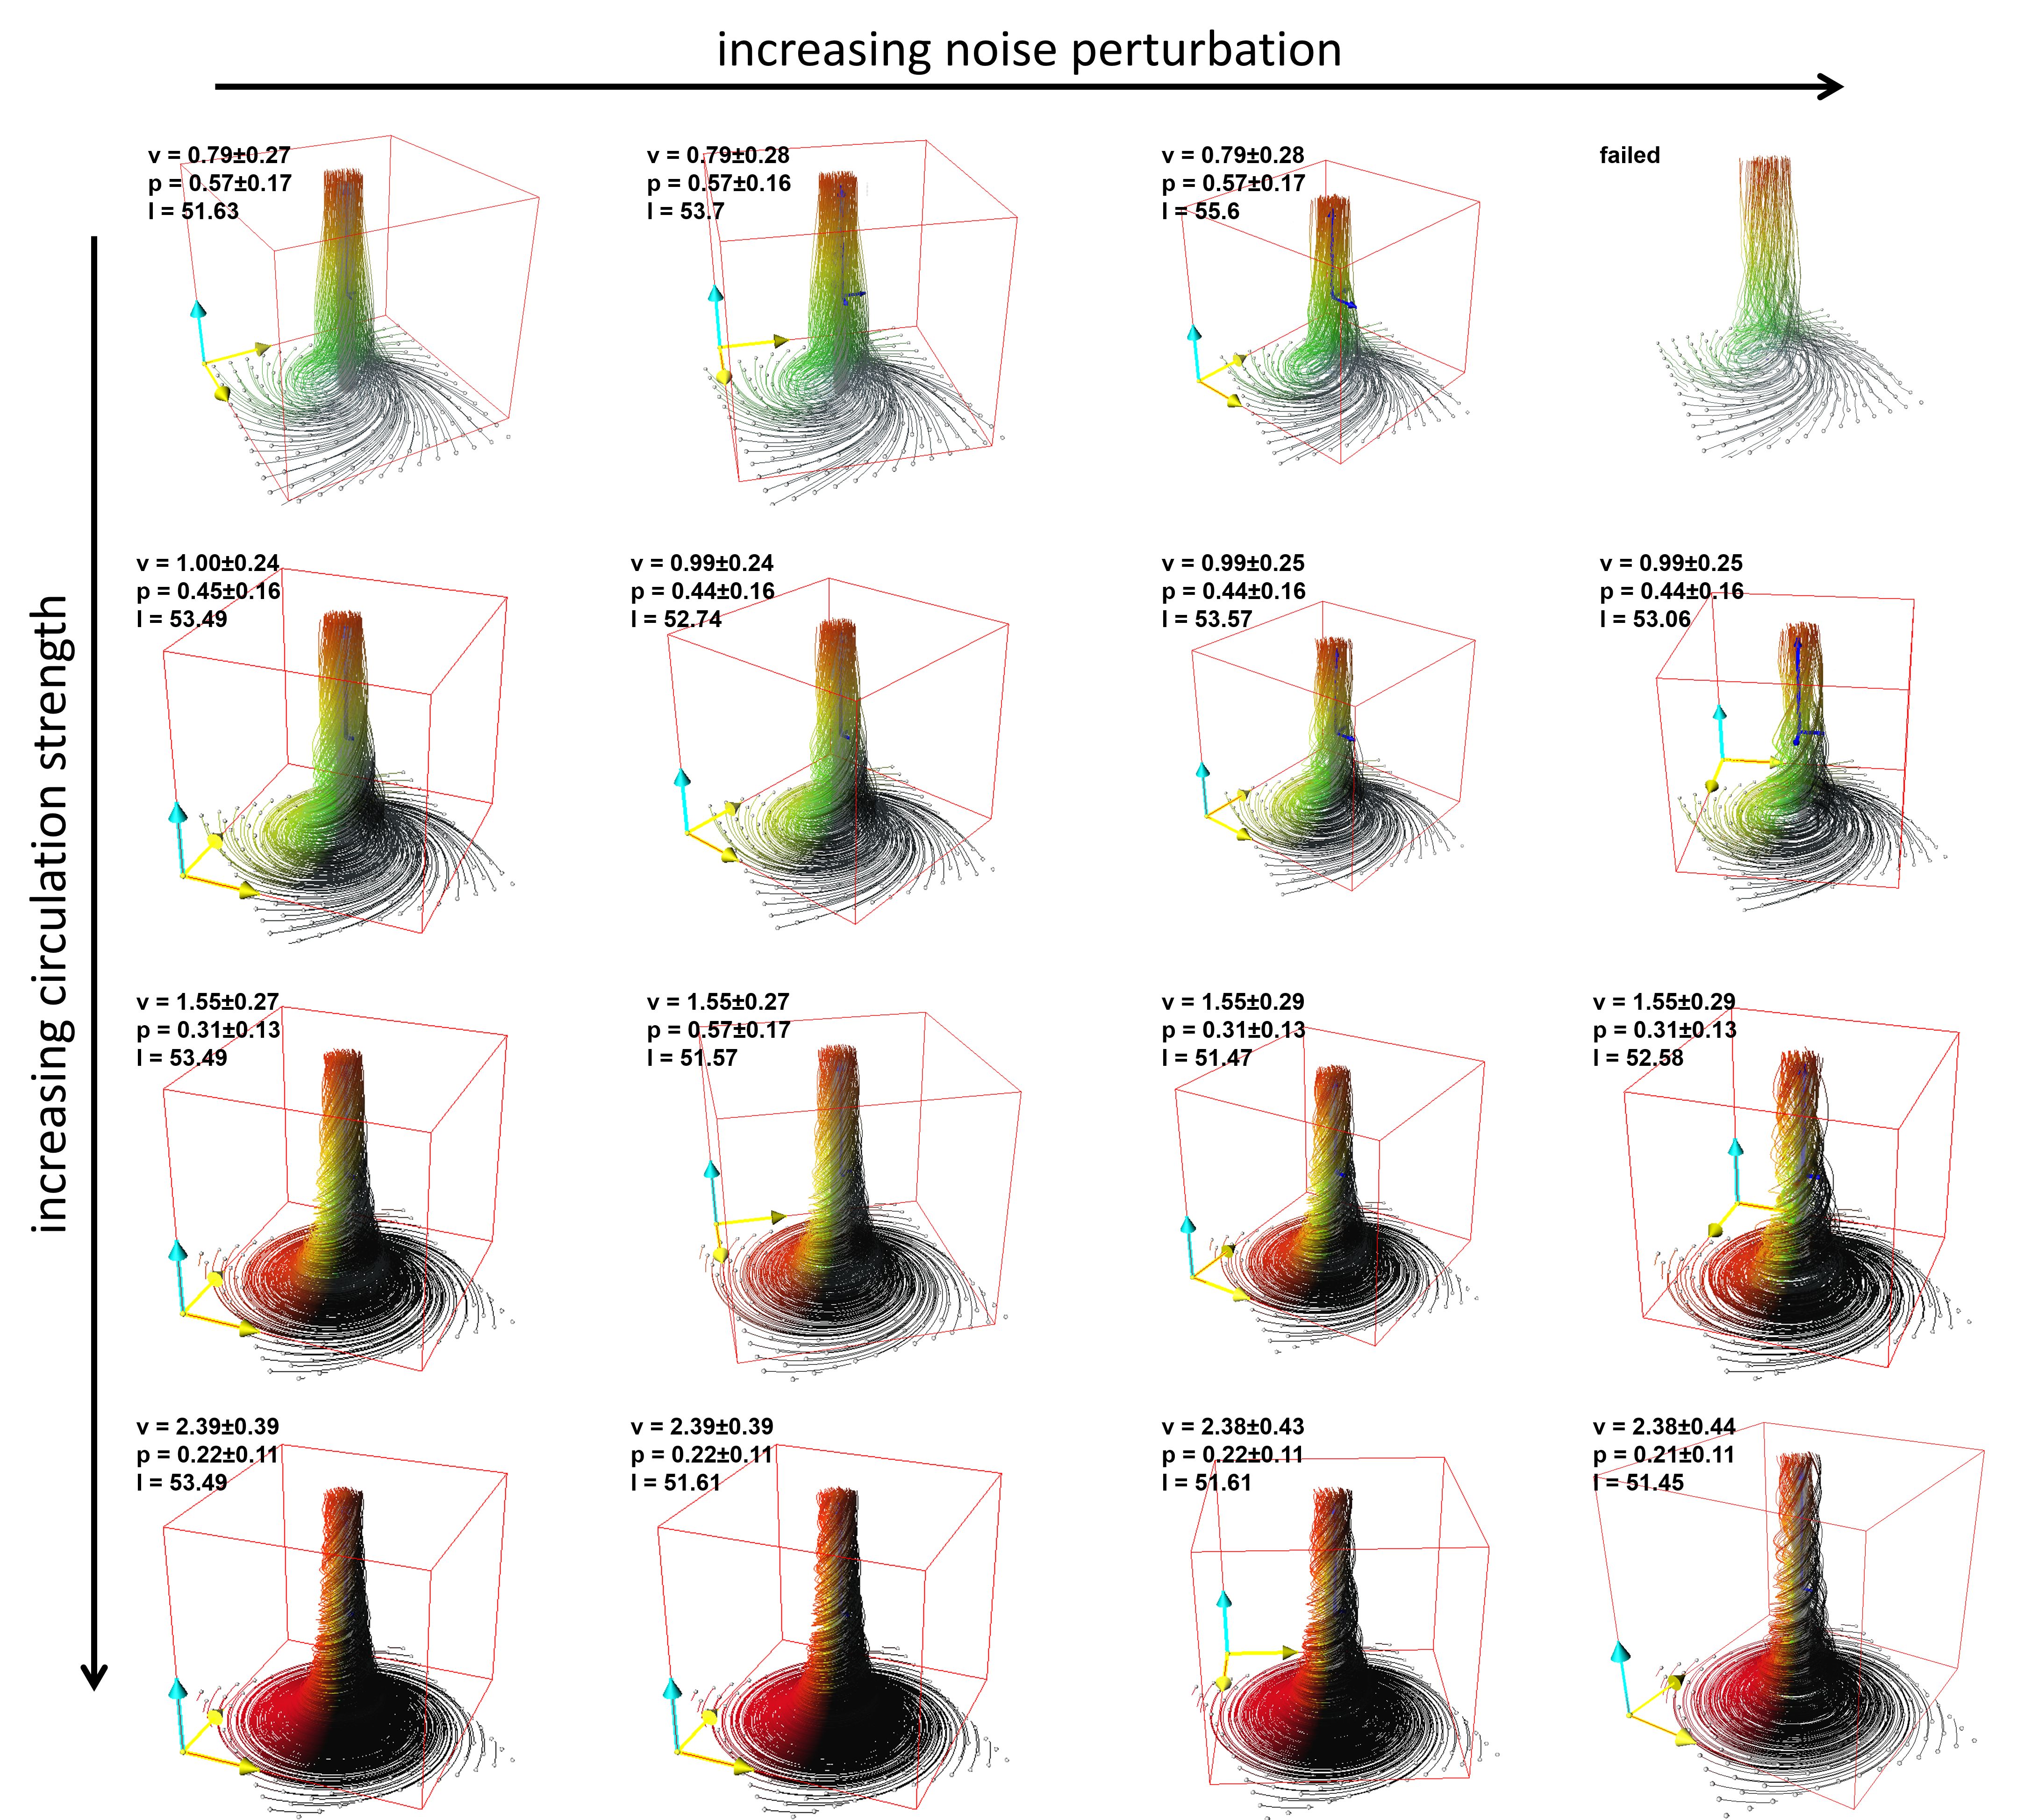
SYNTHETIC DATA: We generated a synthetic velocity vector field on a 64x64x64 image grid using the Burgers-Rott vortex model with varying Gaussian noise ($$$\sigma$$$ = [0, 0.01, 0.05, 0.1]) and circulation strength ($$$\Gamma$$$ = [75, 150, 300, 500]).
IN VIVO PATIENT DATA: To show feasibility on clinical datasets, we analyzed six 3D PC-MRI aorta datasets of patients with aortic valve stenosis, scanned on a 1.5 Tesla MRI machine (Philips Achieva) before (N=3) and after (N=3) valve replacement. Acquisition parameters were: TE/TR [ms] = 2.1/3.34; flip angle = 5; slices = 38; spatial resolution [mm3] = 2.0x2.0x2.8; temporal resolution [ms] = 40; VENC = 300-600 cm/s; PAT = SENSE (factor = 2); prospective ECG triggering; respiratory navigator gating. Aortic segmentation was performed on 3D whole heart dataset that was acquired in the same session.
RESULTS
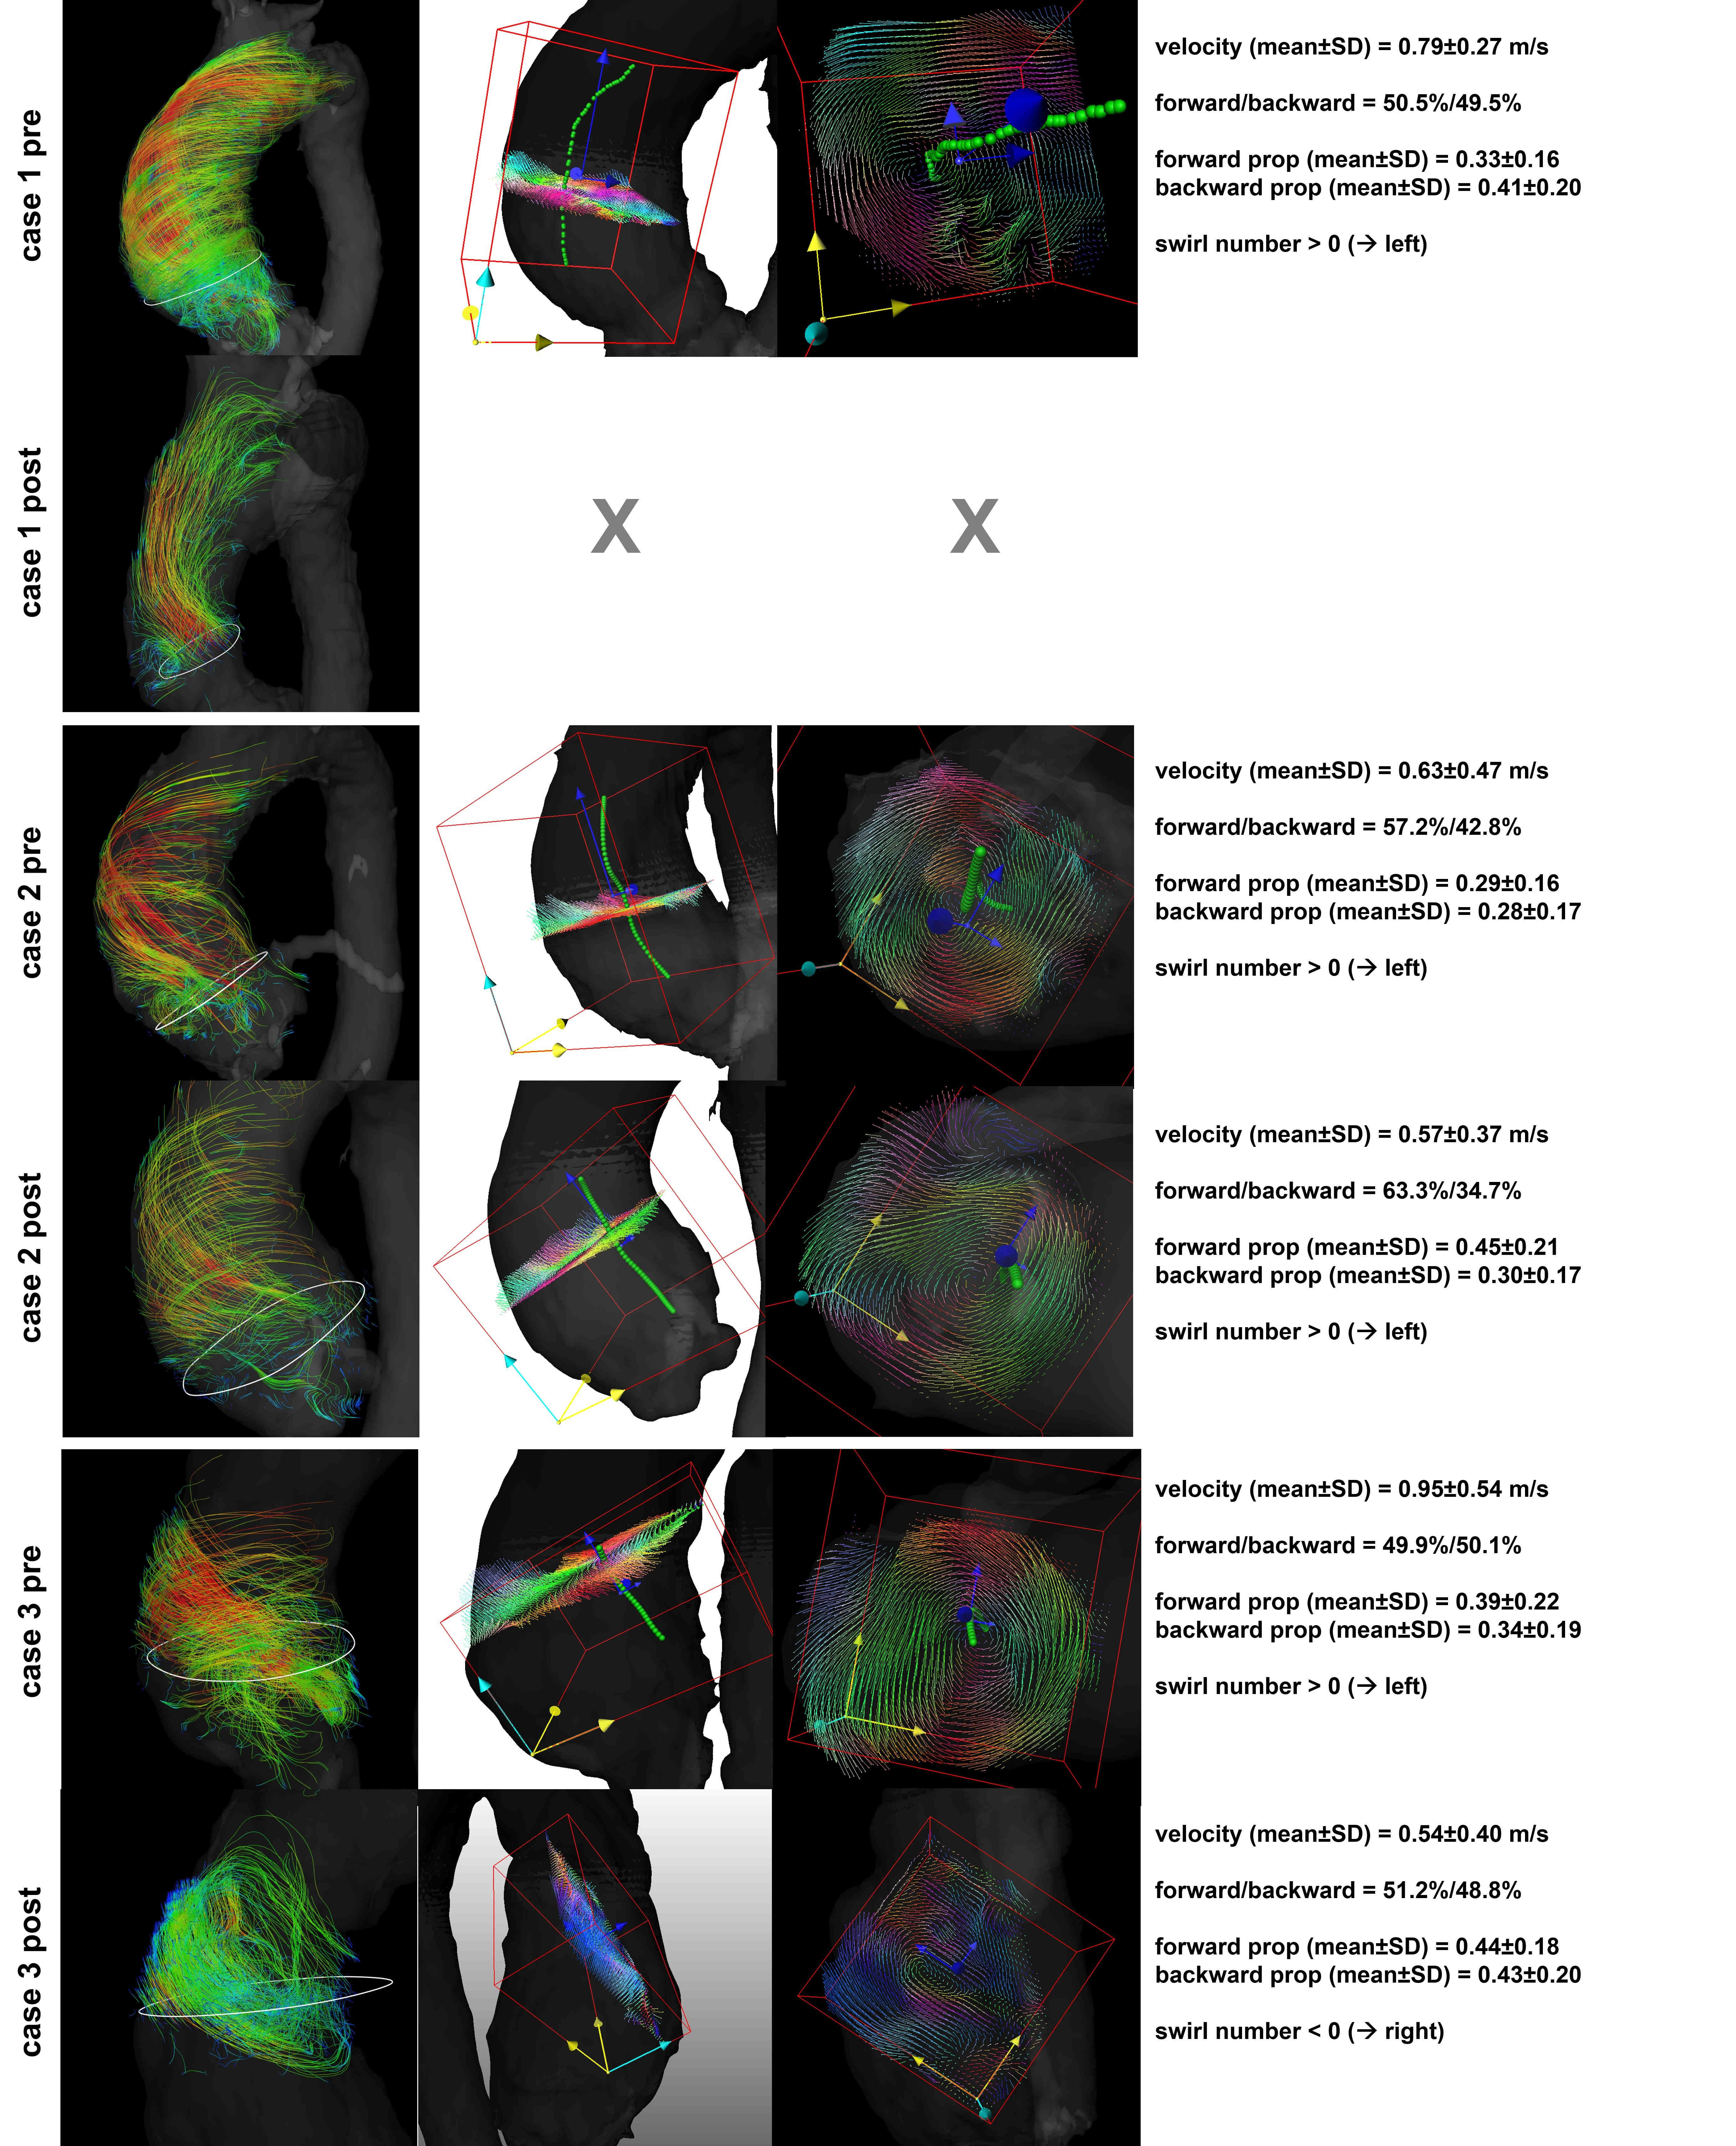
Evaluation of synthetic data shows acceptable detection and quantification of the vortical structure in 15 out of 16 tested models. All computed metrics are consistent through different levels of noise with neglectable differences (figure 2). The algorithm fails for the lowest circulation strength ($$$\Gamma$$$ = 75) with highest noise perturbation ($$$\sigma$$$ = 0.1). In-vivo data results show that core detection is positive in five out of six datasets and is in line with qualitative particle tracing (figure 3). In case 1, no core is detected in the post-treatment dataset, for which particle tracing does not exhibit any vortical/helical pattern. In case 3 and 4, quantitative metrics differ for pre- and post-treatment, assuring the use of the proposed markers in future studies which seek to evaluate pre- versus post-treatment flow.DISCUSSION
Our work presents a pipeline for a quantitative description of vortical/helical blood flow in tubular vessels. In particular, we propose reproducible metrics based on 3D PC-MRI data. As shown for synthetic velocity data, the algorithm proves to be robust towards noise, which is of great importance when considering its deployment in an in-vivo patient study. A remaining limitation of the proposed pipeline is the bounding box, based on which we expect errors in the propulsion metric for strongly curved cores. Future efforts must include a full evaluation of the algorithm using a bigger in-vivo data patient cohort and a pre-clinical study to discover which metric may define a valuable hemodynamic biomarker.CONCLUCSION
This work proposes a pipeline for characterizing vortical flow in tubular structures using a fully automated vector pattern matching and computed quantitative metrics. We seek to optimize this tool with respect to the current limitations and subsequently deploy it in a clinical study.Acknowledgements
We thankfully acknowledge grant support from: Federal Ministry for Education and Research (BMBF - project: SMART); German Research Foundation (DFG HE 7321/4-1).References
1. Arvidsson PM, Kovács SJ, Töger J, et al. Vortex ring behavior provides the epigenetic blueprint for the human heart. Sci Rep 2016;6(22021).
2. Frydrychowicz A, Berger A, Del Rio AM, et al. Interdependencies of aortic arch secondary flow patterns, geometry, and age analysed by 4-dimensional phase contrast magnetic resonance imaging at 3 Tesla. Eur Radiol 2012;22:1122-1130.
3. Schnell S, Smith DA, Barker AJ, et al. Altered aortic shape in bicuspid aortic valve relatives influences blood flow patterns. Eur Hear J Cardiovasc Imaging 2016;17:1239-1247.
4. Von Spiczak J, Crelier G, Giese D, Kozerke S, Maintz D, Bunck AC. Quantitative analysis of vortical blood flow in the thoracic aorta using 4D phase contrast MRI. PLoS One 2015;10:1-19.
5. Sotelo J, Urbina J, Valverde I, et al. Three-dimensional quantification of vorticity and helicity from 3D cine PC-MRI using finite-element interpolations. Magn Reson Med 2018;79:541-553.
6. Lorenz R, Bock J, Barker AJ, et al. 4D flow magnetic resonance imaging in bicuspid aortic valve disease demonstrates altered distribution of aortic blood flow helicity. Magn Reson Med 2014;71:1542-1553.
7. Drexl J, Khan H, Markl M, et al. Detection of Vortical Structures in 4D Velocity Encoded Phase Contrast MRI Data Using Vector Template Matching. Functional Imaging and Modeling Of The Heart. LNCS 2013; 7945:276-283.
8. Heiberg E, Ebbers T, Wigstrom L, Karlsson M. Three-dimensional flow characterization using vector pattern matching. IEEE Trans Vis Comput Graph 2003;9:313-319.
Figures