1966
Fully dimensional vessel segmentation in non-contrast-enhanced 3D PC-MRI image data.1Department of Computer Science, Technical University of Munich, Munich, Germany, 2Institute for Imaging Science and Computational Modeling in Cardiovascular Medicine, Charité Universitätsmedizin, Berlin, Germany, 3Department of Pediatric Cardiology, German Heart Center, Munich, Germany
Synopsis
Fully dimensional (spatial + temporal) segmentation of blood vessels is crucial to perform 3D PC-MRI based quantitative characterization of hemodynamics. However, most prior works neglect the temporal movement of vessels, making it a 3D-only segmentation problem. Therefore, the objective of this work was to show feasibility of a deformable-registration-based algorithm for 4D segmentation of the aorta. Performance of the proposed algorithm proved to be acceptable, with overall Dice index and Hausdorff distance of 0.86±0.04 and 3.63±0.75 mm, respectively.
INTRODUCTION
Fully dimensional (spatial + temporal) segmentation is a crucial step for accurate 3D PC-MRI based hemodynamic quantification in all moving vessels of interest. Throughout the cardiac cycle the aortic wall moves in the range of 5-10 mm which encompasses several voxels.1 However, most flow characterization studies employ a static definition of vessel boundaries2–4 and approaches exploring suitable algorithms for 3D PC-MRI based 4D vessel segmentation are lacking. The objective of this work is to show feasibility of a deformable-registration-based algorithm for 4D segmentation of the aorta in non-contrast enhanced 3D PC-MRI data.METHODS
DATA: After obtaining written consent, 11 healthy volunteers were examined using a 1.5T MRI scanner (Siemens) without the administration of signal-to-noise (SNR)-enhancing contrast agent. Two datasets were generated: (1) whole heart 3D PC-MRI (MAG): TE/TR [ms] = 2.54/5; flip angle =7; in-plane FoV [mm3] = 270x360; slices/slab = 56-64; spatial resolution [mm3] = 2.25x2.25x2.3; temporal resolution [ms] = 40; VENC = 150 cm/s; PEAK-GRAPPA factor = 5; prospective ECG triggering (18-22 frames). (2) whole heart 3D (3DWH) balanced steady-state GRE (TrueFISP); TE/TR [ms] = 1.35/269; flip angle = 90; in-plane FoV [mm3] = 500x500; slices/slab = 96; spatial resolution [mm3] = 2.0x2.0x1.3; prospective ECG triggering to capture single cardiac frame in diastole.
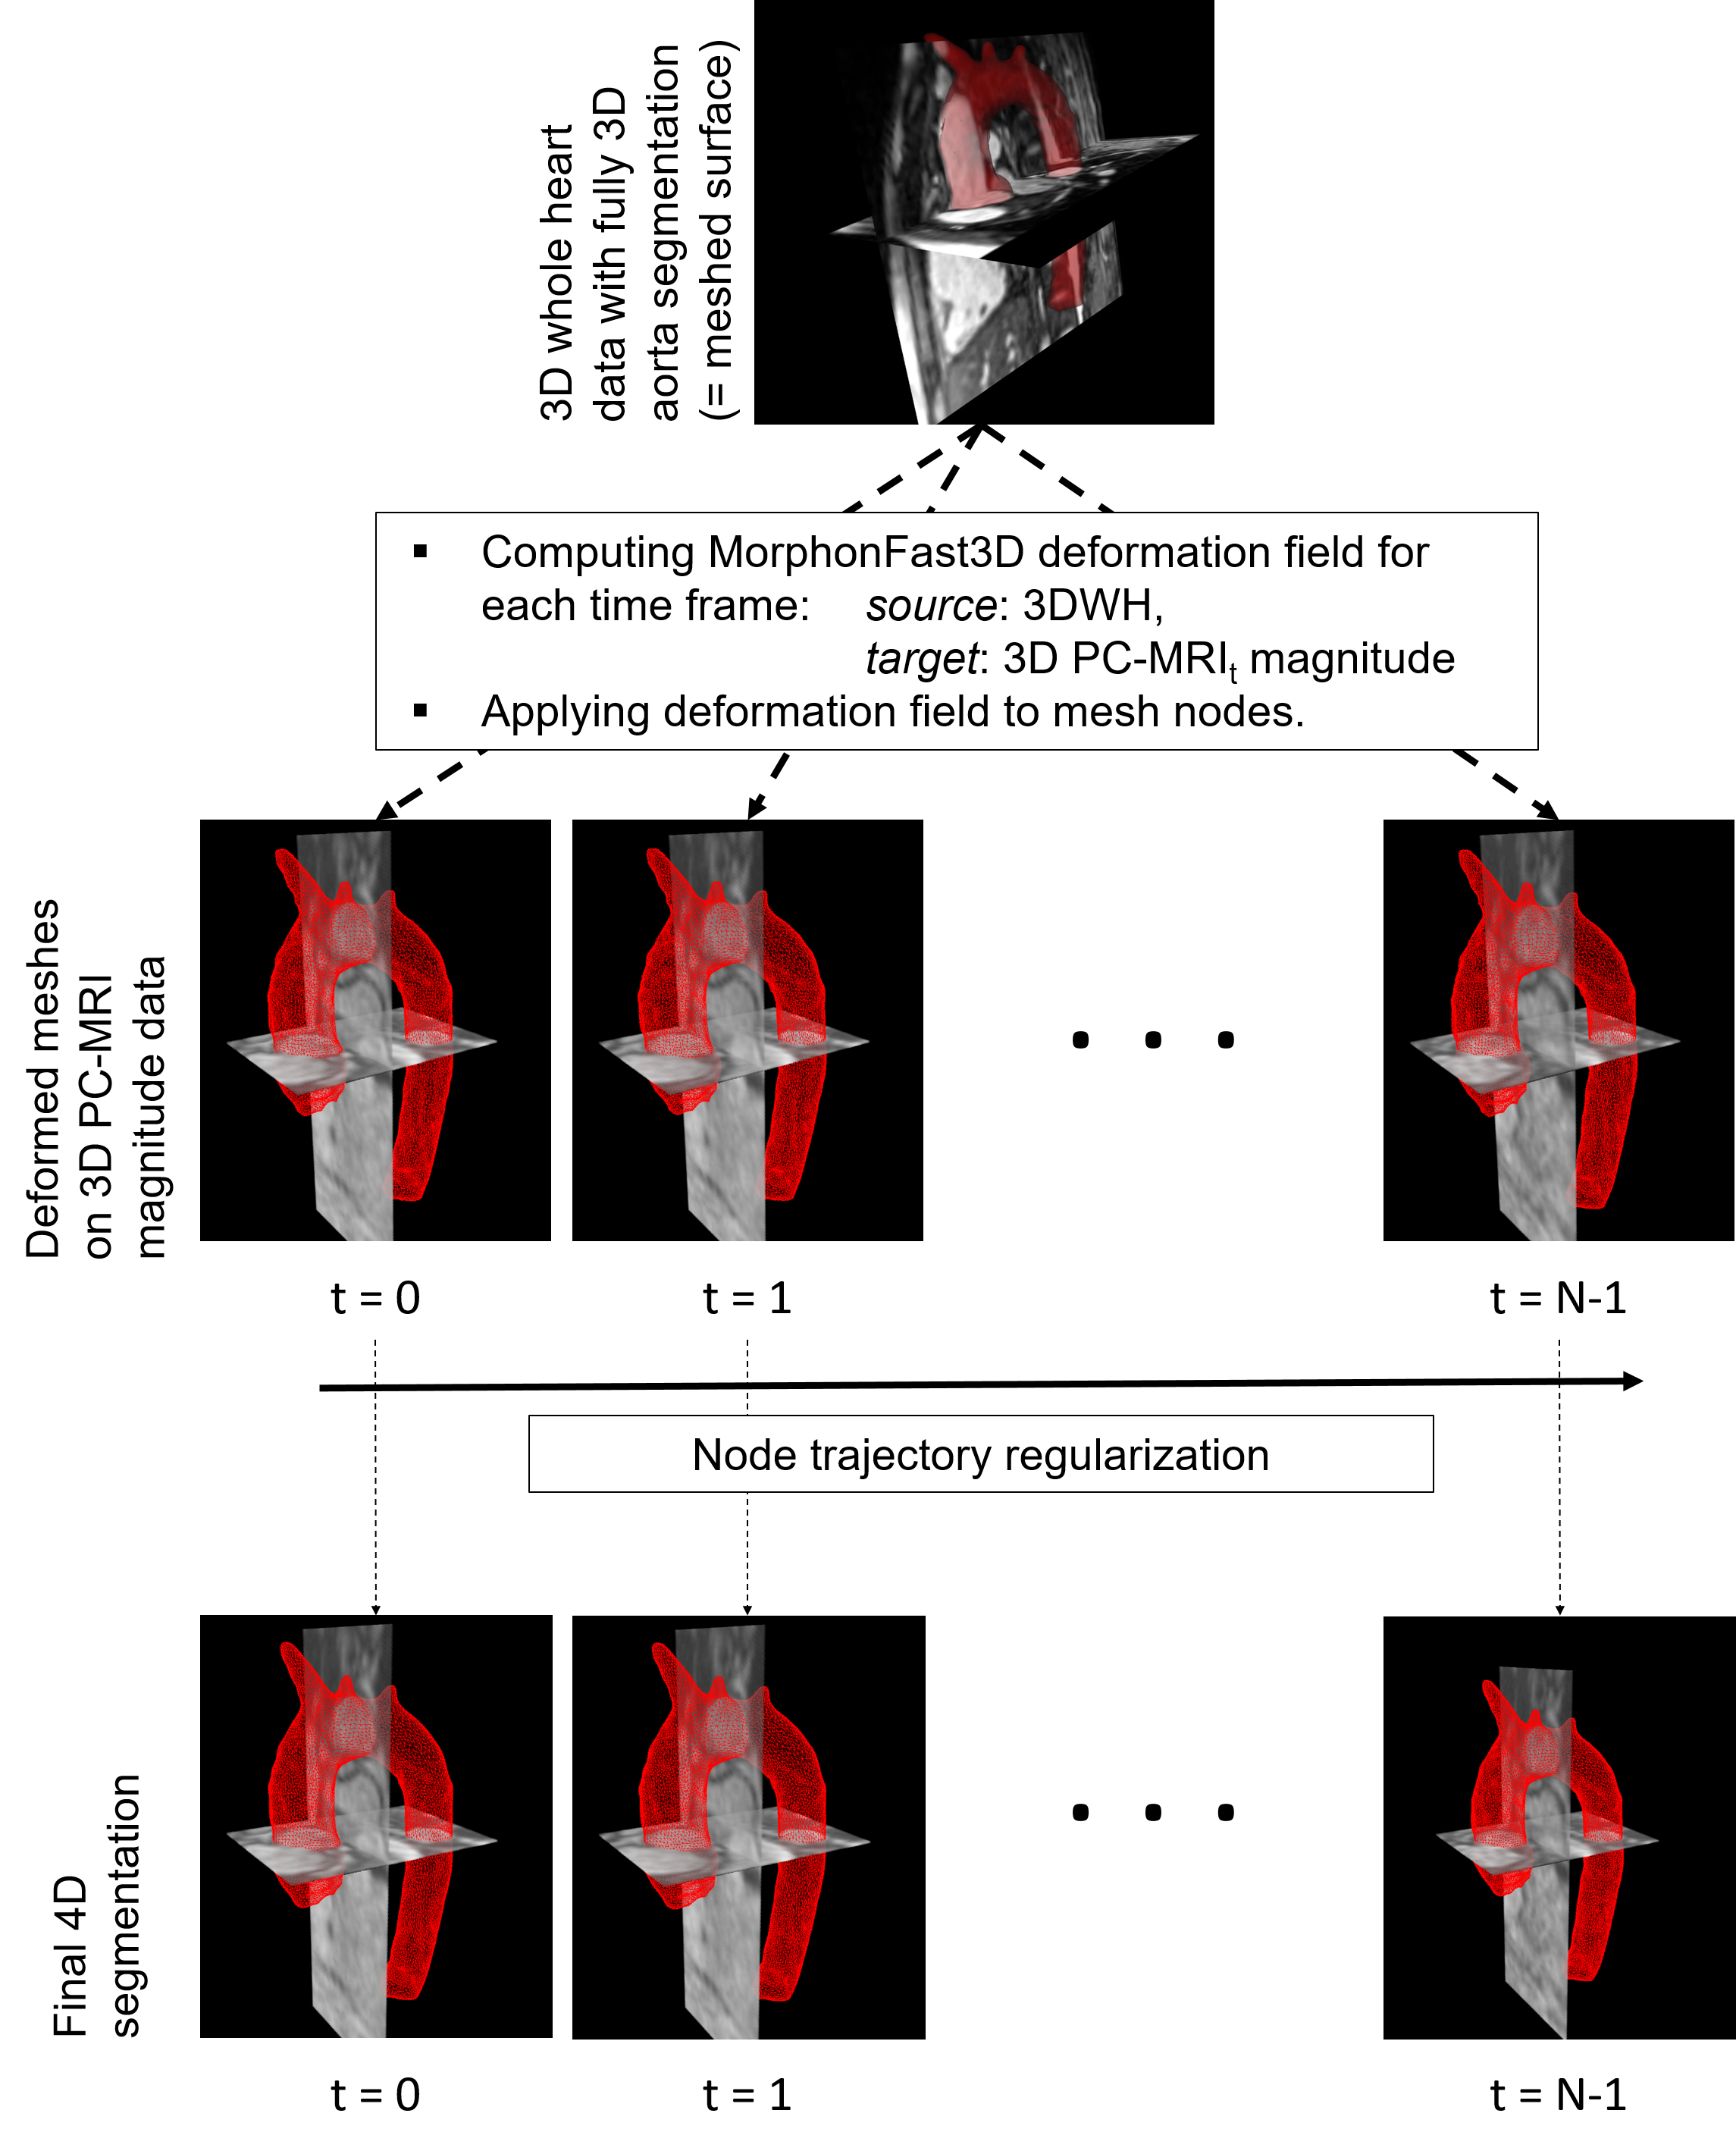
4D-SEGMENTATION: We use a registration-based segmentation approach to generate a time-resolved 3D surface mesh of the aorta. Algorithm steps are (figure 1): (1) Initial shape definition by watershed-based segmentation of the aorta in static 3D whole heart (3DWH) data with subsequent surface mesh generation (marching cubes with 1x1x1 mm3 voxelization) and Laplacian smoothing (passes = 20, factor = 0.2). (2) Iterative computation of N deformation fields between 3DWH and MAG(t) (with t = [1, N-1]), using local 2D quadrature filters in scale space.5,6 The algorithm runs on S = 2 down sampled scale-spaces, with I = 5 iterations per scale, and employs a Gaussian filter ($$$\sigma$$$ = 4) for spatial regularization. For fast computation of the 3D deformation field, we reformat both target and source 3D image into 2D stacks along x, y, and y dimension, for which we compute 2D deformation fields separately and then assemble our final 3D deformation field in the last step. (3) Applying deformation field to initial shape’s nodes to generate N target meshes. (4) Temporal node trajectory regularization by smoothing each node’s position through time (smoothing kernel = [0.25, 0.5, 0.25], passes = 2).
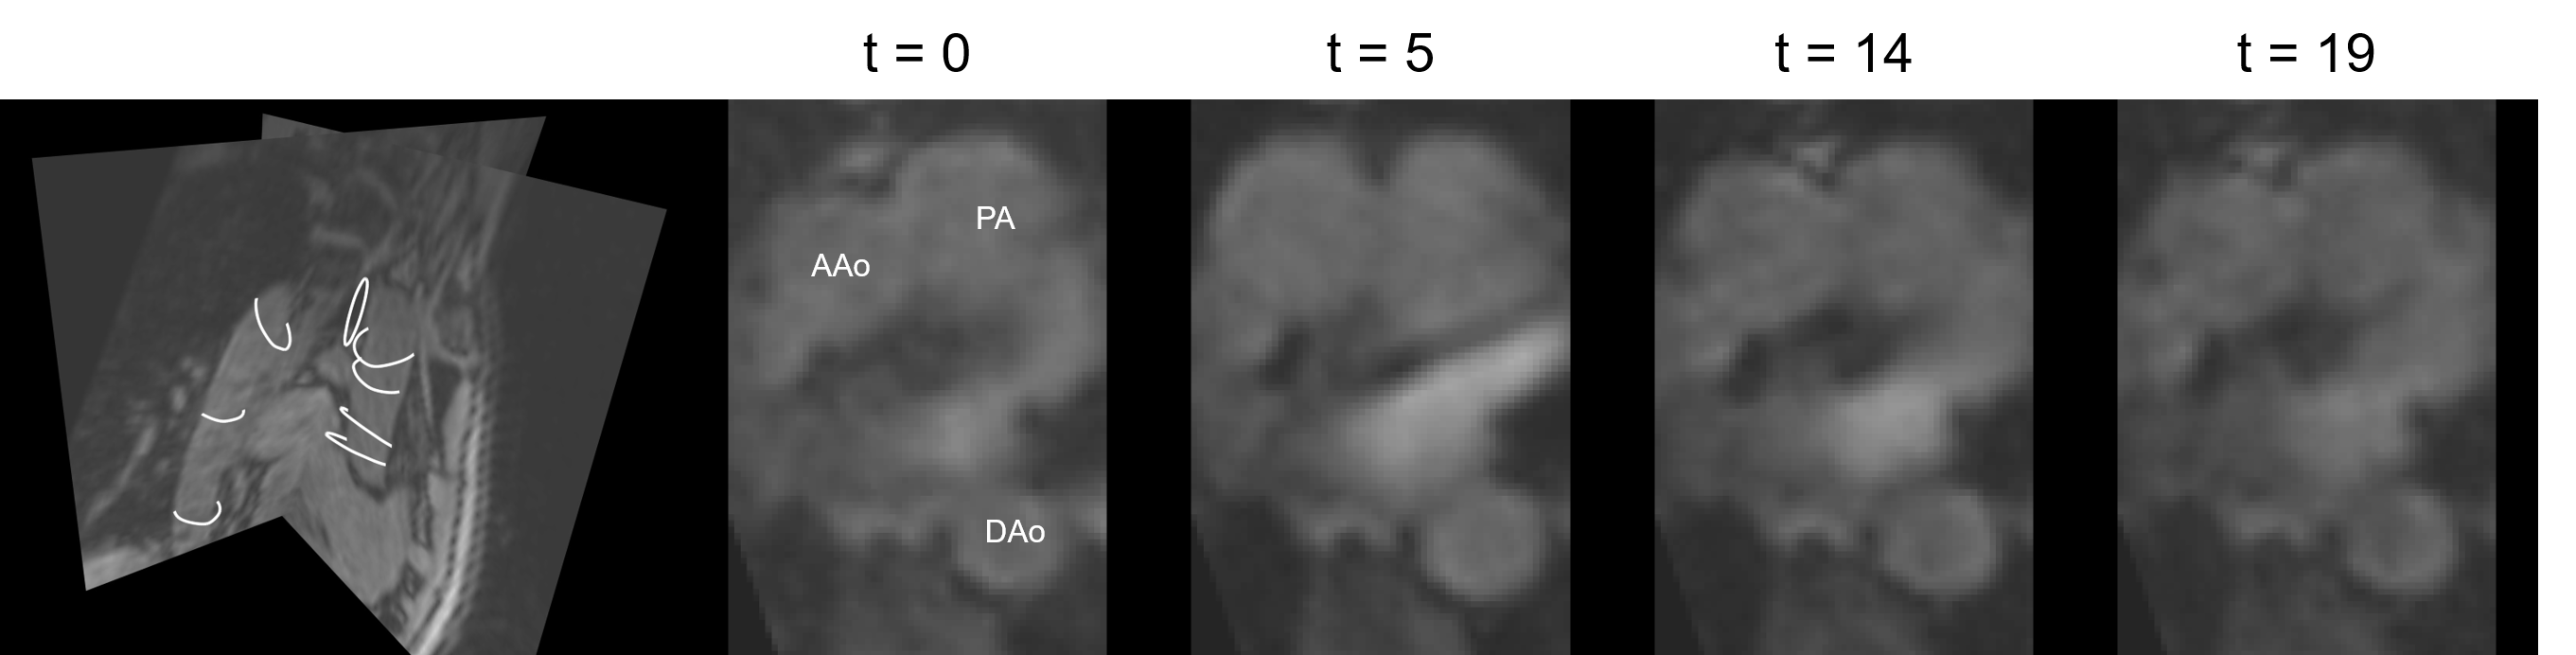
EVALUATION: Expert annotations of the ascending through descending aorta (2D manual contours at 8 sample locations at each time frame) were obtained and defined as ground truth (figure 2). Dice index and Hausdorff distance (HD) similarity metrics were used for comparison.
RESULTS
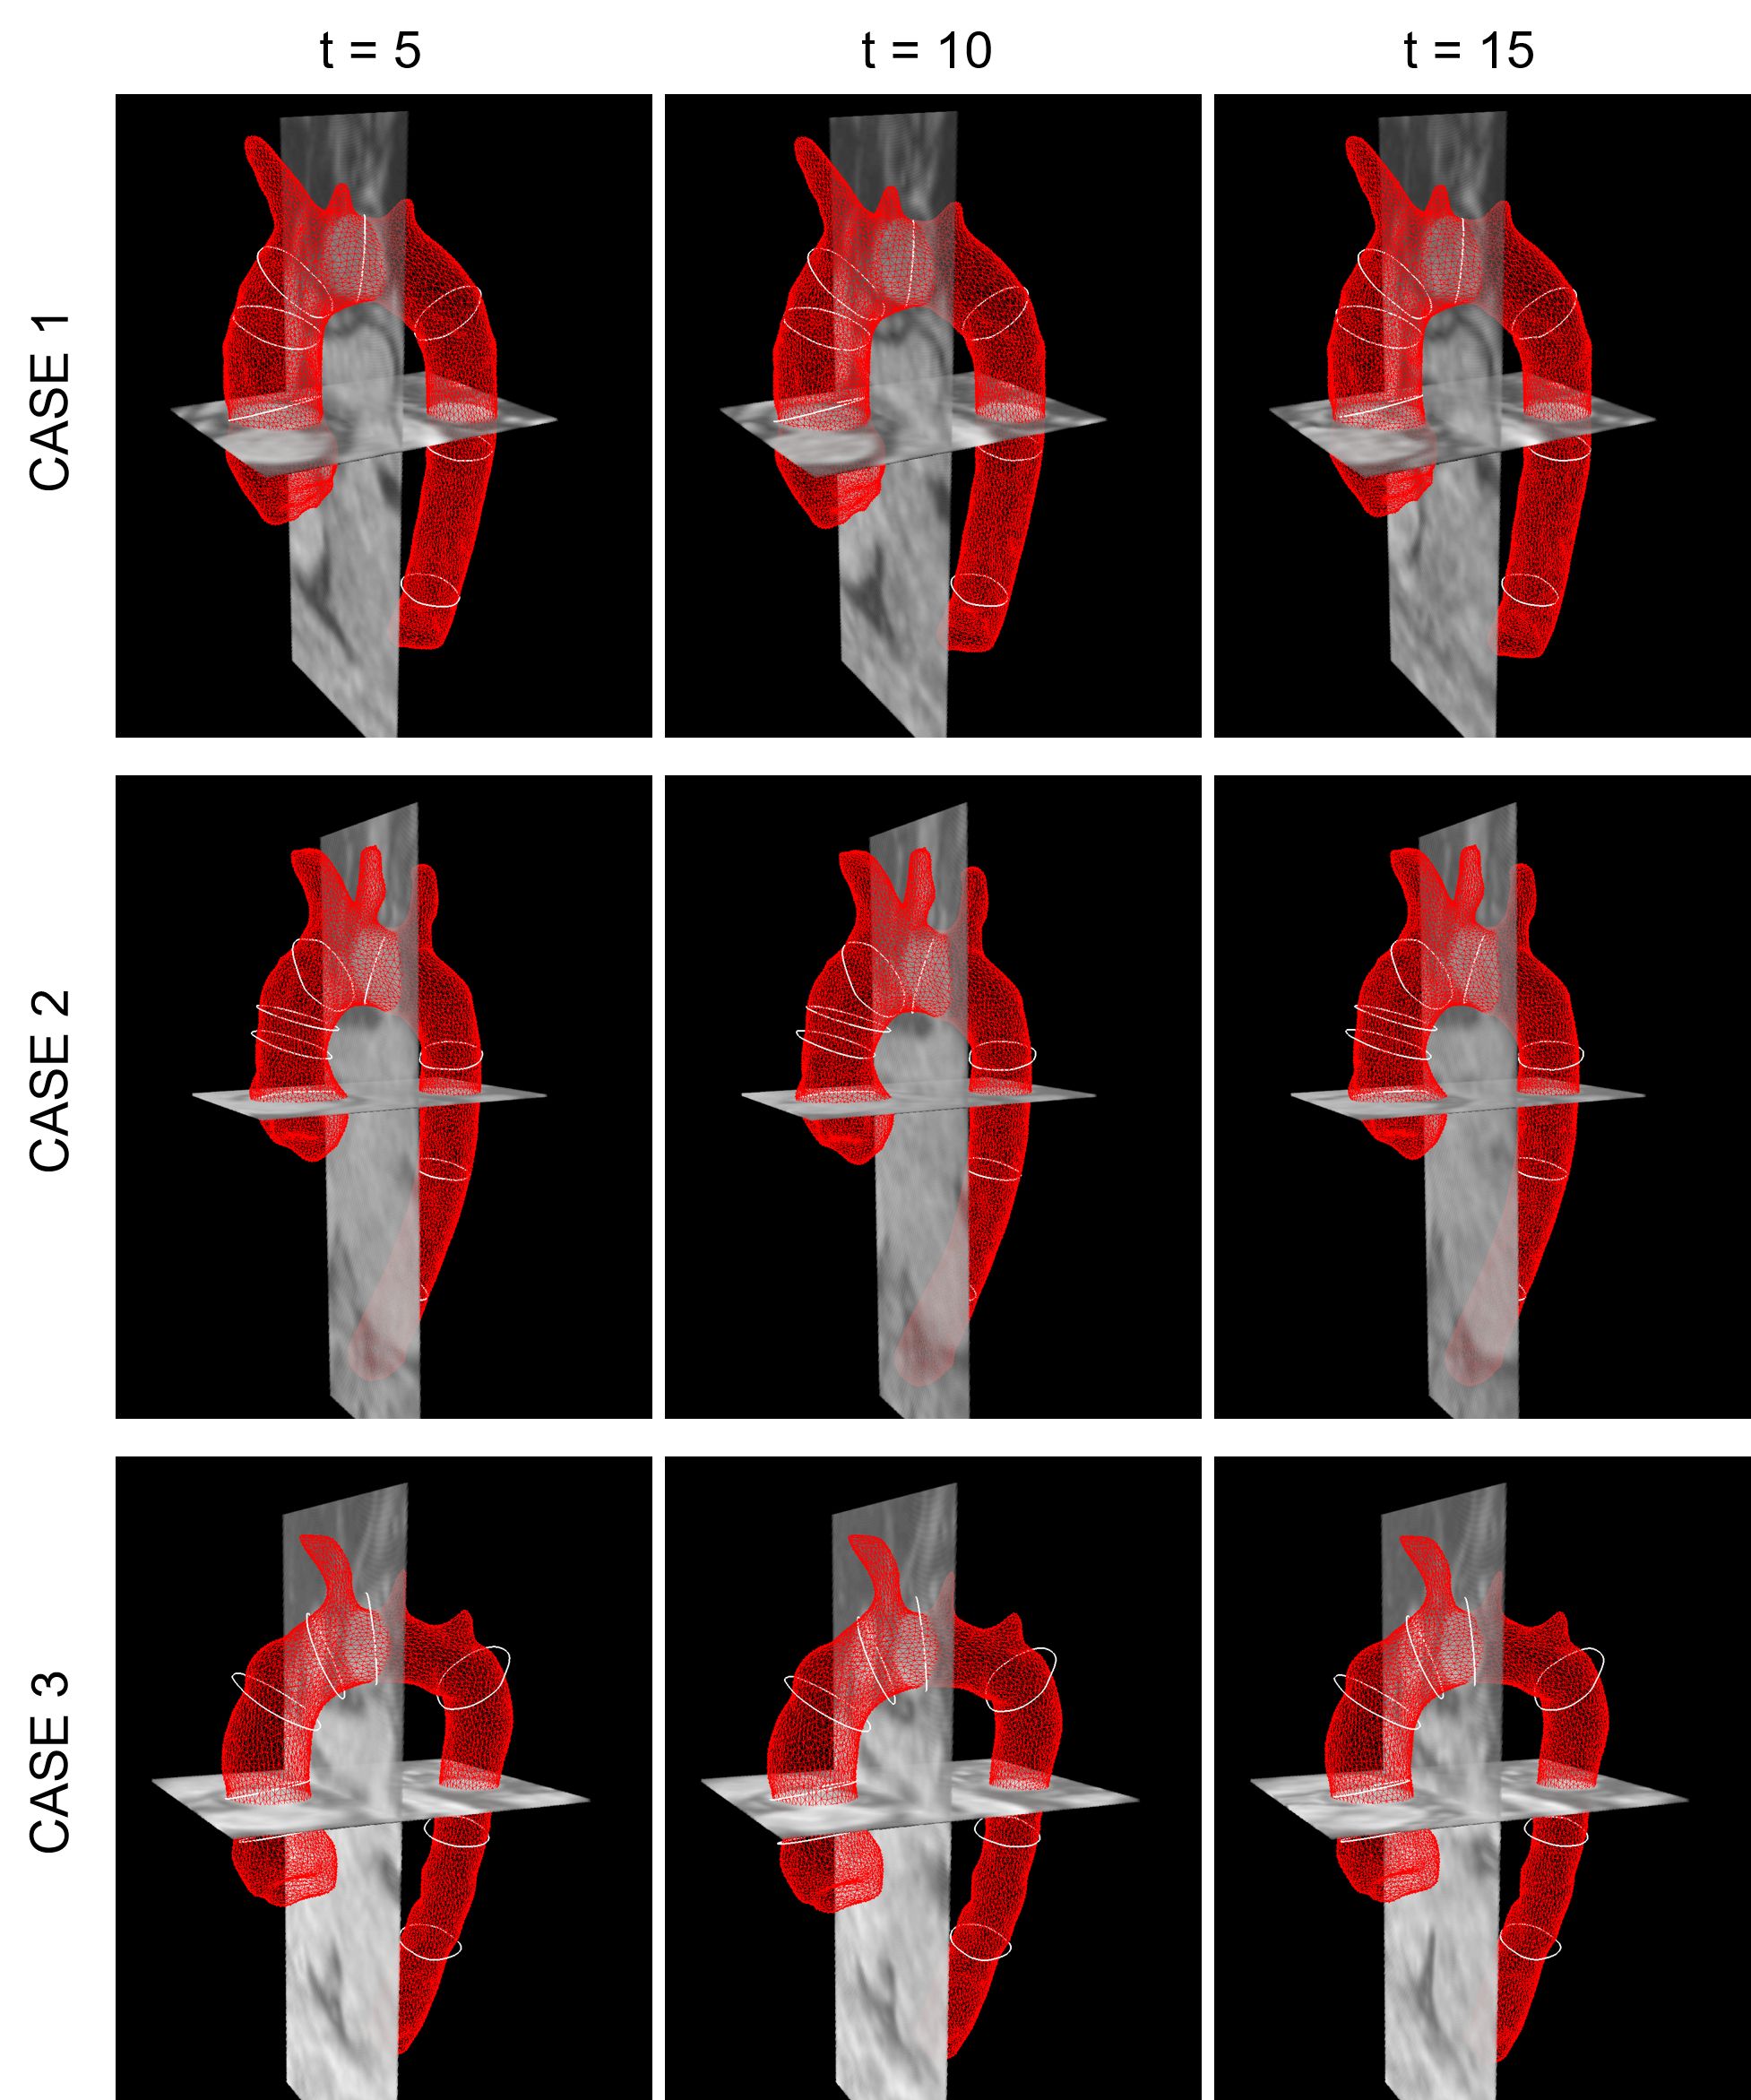
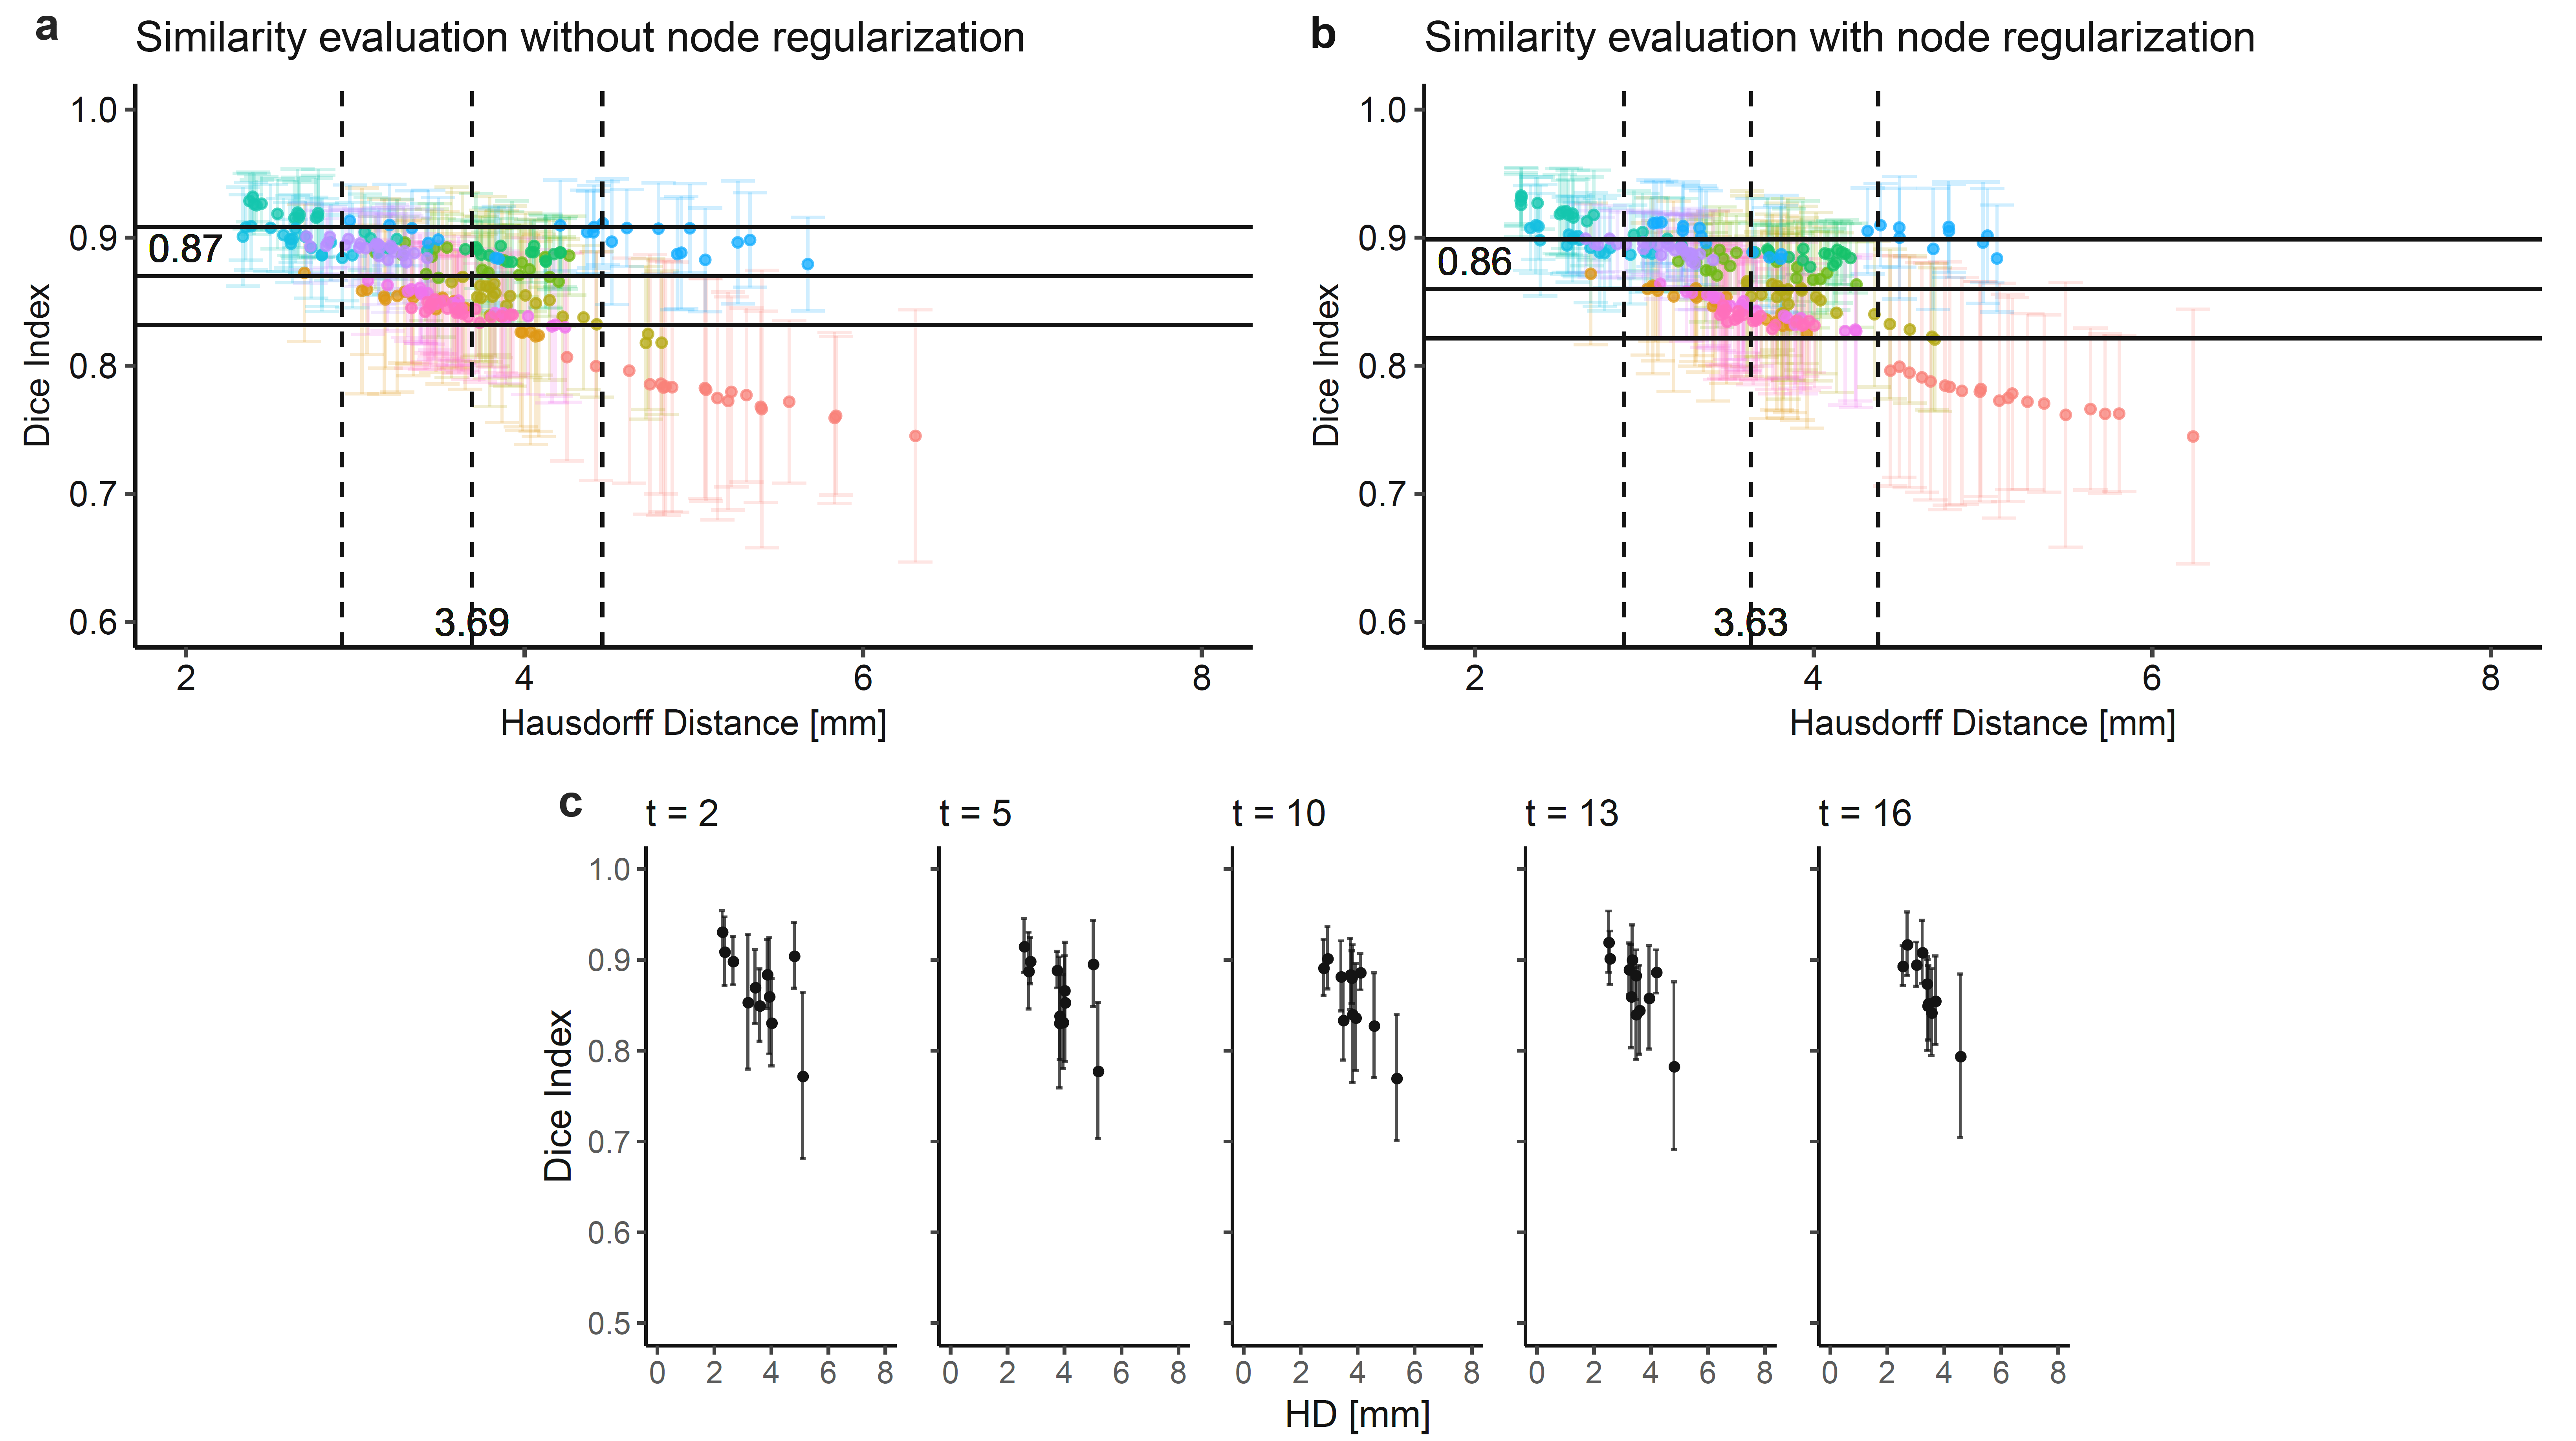
Qualitative results for three exemplary cases are shown in figure 3. Overall quantitative similarity (mean±SD) is 0.86±0.04 (with min/median/max = 0.74/0.87/0.93 mm) for Dice and 3.63±0.75 mm (with min/median/max = 2.27/3.56/6.24 mm) for HD (figure 4b). Without applying temporal node regularization, we achieve scores of 0.87±0.04 (with min/median/max = 0.75/0.87/0.93) for Dice and 3.69±0.77 mm (with min/median/max = 2.34/3.60/6.31 mm) for HD (figure 4a). Time-resolved evaluation does not show any preferred phase (both in systole and diastole) which performs consistently better over other phases (figure 4c). Although quantitative results do not show any impact of temporal smoothing on our output, we note that qualitative visualization improved enormously, eliminating “flickering” of the mesh.DISCUSSION
Based on the quantitative comparison results, we found our proposed 4D segmentation workflow suitable for fully dimensional vessel wall definition in non-contrast-enhanced 3D PC-MRI data. Bustamente et al.7 proposed an atlas-based method for time-resolved angiographic segmentation of the heart cavities and vascular structures. In contrast, our method is based on patient-specific vessel shape, which may be obtained from any 3D whole heart sequence output. We note that PC-MRI magnitude data exhibits extremely low contrast between blood pool and surrounding tissue, particularly when imaged without the administration of SNR-enhancing contrast agent, which is preferred in the clinical routine. Manual vessel wall contouring is therefore challenging and may not always present the true wall position and in turn ground truth for evaluating an algorithm’s performance. The presented workflow faces two limitations, which we seek to tackle in the future: (1) registration parameters (number of iterations, size of scale-space) need to be tuned based on a-priori information (range of movement); (2) semi-automated segmentation of initial 3D shape in 3DWH data, restricting the pipeline from being fully automated.CONCLUSION
This work evaluates an algorithm which proves to be suitable for accurate fully dimensional segmentation of the aorta in noisy 3D PC-MRI image data.Acknowledgements
Funding: German Heart Foundation, e.V.References
[1] Zimmermann J, Demedts D, Mirzaee H, et al. Wall shear stress estimation in the aorta: Impact of wall motion, spatiotemporal resolution, and phase noise. J Magn Reson Imaging 2018;48:718-728.
[2] Barker AJ, van Ooij P, Bandi K, et al. Viscous energy loss in the presence of abnormal aortic flow. Magn Reson Med 2014;72:620-628.
[3] Allen BD, Van Ooij P, Barker AJ, et al. Thoracic aorta 3D hemodynamics in pediatric and young adult patients with bicuspid aortic valve. J Magn Reson Imaging 2015;42:954-963.
[4] Potters W V, van Ooij P, Marquering H, Vanbavel E, Nederveen AJ. Volumetric arterial wall shear stress calculation based on cine phase contrast MRI. J Magn Reson Imaging 2015;41:505-516.
[5] Knutsson H, Andersson M. Morphons: Paint on Priors and Elastic Canvas for Segmentation and Registration. Scandinavian Conference on Image Analysis. LNCS 2005;3540:292-301.
[6] Tautz L, Hennemuth A, Peitgen HO. Motion analysis with quadrature filter based registration of tagged MRI sequences. In: Statistical Atlases and Computational Models of the Heart. Imaging and Modelling Challenges. LNCS 2012; 7085:78-87.
[7] Bustamante M, Petersson S, Eriksson J, et al. Atlas-based analysis of 4D flow CMR: Automated vessel segmentation and flow quantification. J Cardiovasc Magn Reson 2015;17:87.
Figures