1962
Deep Spatiotemporal Phase Unwrapping of Phase-Contrast MRI Data1Electrical Engineering, Stanford University, Stanford, CA, United States, 2Radiology, Stanford University, Stanford, CA, United States
Synopsis
This work demonstrates the advantage temporal information provides for deep phase unwrapping of phase-contrast MRI data. Using a patch-based, three-dimensional ResNet architecture, our model performs better than state-of-the-art single-step algorithms. Our deep spatiotemporal phase unwrapping model continues the quest to lower Venc values to increase dynamic range and velocity-to-noise ratio (VNR) of 4D flow data by providing a robust method for phase unwrapping.
Introduction
Phase-contrast MRI encodes velocity information into the phase of images, giving clinicians access to more data for stronger diagnoses. The primary limiting factor for optimal data dynamic range and velocity-to-noise ratio (VNR) is the velocity encoding (Venc) parameter, which is the maximum velocity (cm/s) that can be encoded in phase, from $$$-\pi$$$ to $$$\pi$$$. Any velocities that exceed the Venc will cause phase wrapping. A common clinical strategy is to overestimate the Venc, since it can vary dramatically with anatomy differences and various pathologies, at the cost of lower velocimetric dynamic range and VNR. Meanwhile, a robust phase unwrapping algorithm would allow clinicians to choose a low Venc and obtain useable images with high dynamic range and VNR. Existing single-step algorithms1,2 often only perform well on images with up to one cycle of phase wrapping. Building on existing deep phase unwrapping work,3 we propose to use a modified patch-based 3D ResNet,4 which exploits spatiotemporal correlations in phase-contrast data to improve phase unwrapping accuracy, especially for data with severe wrapping.Methods
With IRB approval, 4D flow data for 10 patients were retrospectively collected: 7 were used for training, 1 for validation, and 2 for testing. Data were acquired with a contrast-enhanced velocity-encoded volumetric RF-spoiled GRE sequence. Each set had approximately 300 slices in the sagittal axis, but the middle 219 were chosen to eliminate slices that do not cover the heart. Preprocessing was necessary because the data we started with was originally sampled at a Venc of 250 with no wrapping. We first found the phase difference between two serial flow-encoded images and concatenated that with the corresponding magnitude images. We then simulated wrapping by shifting, stretching, and normalizing the data to create wrapped images at random Venc values between 25 and 75. During training, to minimize the amount of noise seen by the model, the images were randomly cropped into patches in the spatial domain, to one-fifth the original size. This decision was made because noise phase is extremely different from anatomical phase, which can confuse the model when training. To increase the likelihood of cropping on a phase wrapped patch, the magnitude images were used to derive a probability density function for the crop selection. We hypothesized that magnitude image patches with higher signal intensity--which in our contrast-enhanced dataset can be correlated with blood--are more likely to have high flow and result in wrapping after Venc adjustments. All 30 timesteps were used. During validation and testing, the images are not patched to evaluate performance on full images.
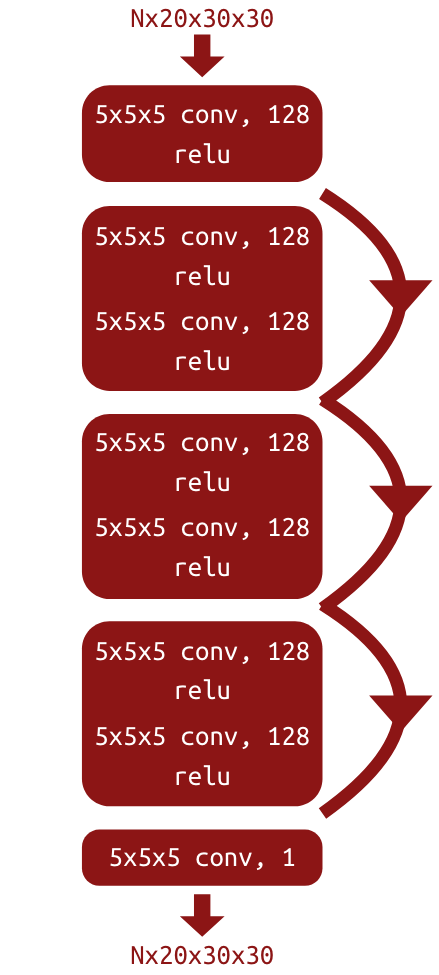
The network architecture is shown in Figure 1, based on a ResNet model. Three-dimensional convolution layers were used, since the inputs were of size Nx20x30x30 at training time and size Nx100x150x30 at validation and testing time. The training lasted over 135 hours, training for 1000 epochs. A long training time was necessary due to the 12,320,000 parameters that needed to be updated.
Results
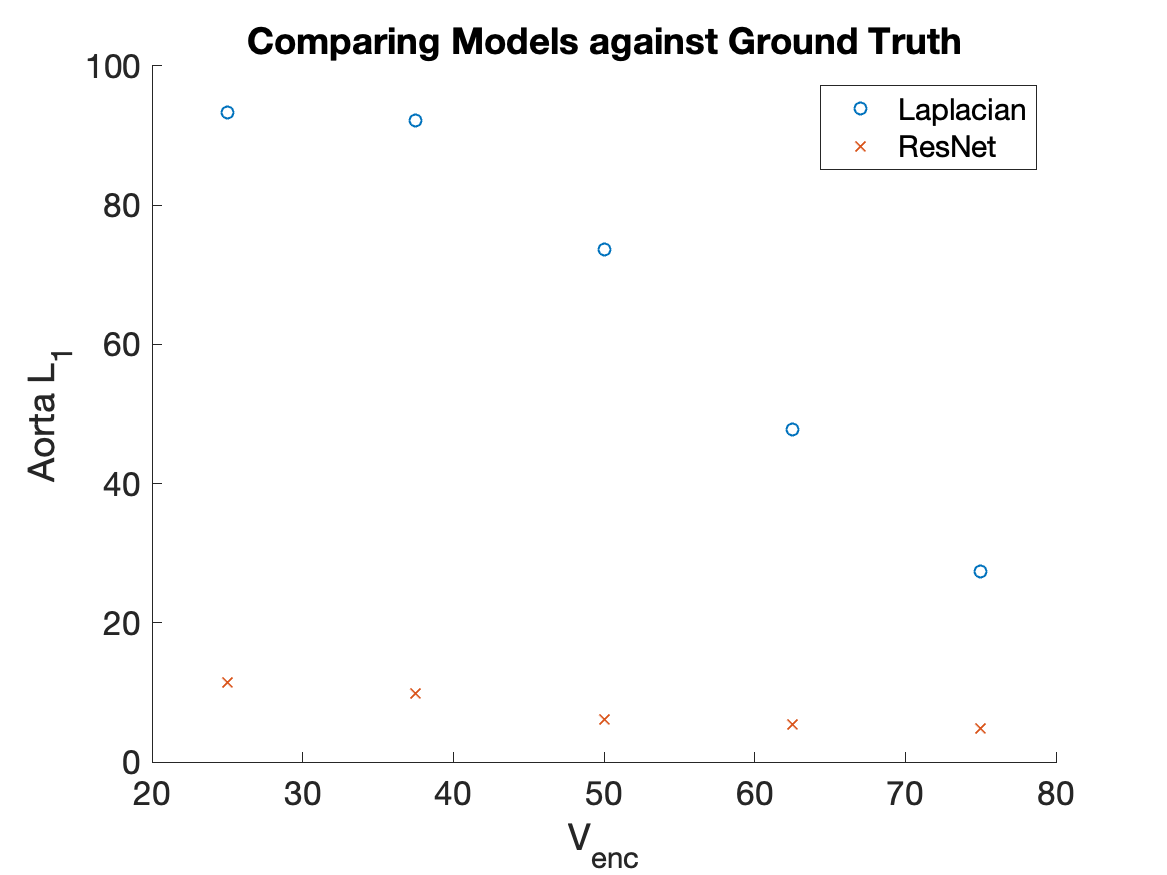
Figure 2 compares the qualitative appearances of our model outputs with the high Venc ground truth, wrapped image, and Laplacian algorithm1 output, which is used as a baseline. The animation scrolls through 5 Venc values, linearly spaced from 25 to 75. For quantitative comparison, we calculated the pixel-wise L1 difference in the manually segmented aorta for each Venc, shown in Figure 3.Discussion & Conclusions
Our deep phase unwrapping model clearly demonstrates a more robust method for unwrapping 4D flow MRI data. Since data is unwrapped slice-by-slice, this method can easily be generalized to 2D phase-contrast data. From the qualitative comparison in Figure 2, it is clear that our model outperforms the Laplacian baseline at lower Venc settings, which corresponds with our hypothesis, since the Laplacian algorithm is optimized for single-cycles of wrapping or less. The data shown in Figure 3 reinforces the observed qualitative results. One current limitation of our model, though, is the inability to accurately model eddy current-related background phase errors and flow-related signal dephasing which become more severe at lower Venc acquisitions. Future work will incorporate simulated training data to aid the model in compensating for these artifacts.Acknowledgements
This work was generously supported by NIH R01-EB009690, NIH R01-EB026136, and GE Healthcare.References
- Loecher M, et al. Phase unwrapping in 4D MR flow with a 4D single-step Laplacian algorithm. J Magn Reson Imaging. 2016;43: 833-842.
- Ying L. Phase unwrapping. Wiley Encyclopedia of Biomedical Engineering. 2006.
- Johnson K. 3D Velocimetry Phase Unwrapping using Block-wise Classification with a Shift Variant Fully 3D Convolutional Neural Network. ISMRM 2018.
- He K, et al. Deep residual learning for image recognition. arXiv:1512.03385 [cs.LG]. 2015.
Figures