1961
Time Resolved 4D Flow MRI Quantification without Segmentation1Medical Physics, University of Wisconsin Madison, Madison, WI, United States, 2Radiology, University of Wisconsin Madison, Madison, WI, United States
Synopsis
4D flow sequences enable the acquisition of time resolved velocity fields over an averaged cardiac cycle. Flow quantification and velocity profile analysis typically requires manual segmentation and plane placement, which can lead to inaccuracies with lack of reproducibility and large post-processing times. Improving upon the semi-automated, 4D flow post-processing techniques with the application of centerline labeling and k-means based segmentation, here we propose a fully automated, time-resolved flow quantification method which utilizes flow as a function of distance instead of segmentation. This method may further decrease the time involved with 4D flow processing and increase the agreement with manual segmentation.
Purpose
4D flow MRI enables the acquisition of time resolved velocity fields in intricate vascular networks. Flow quantification analysis typically requires manual segmentation and manual plane placement, which can lead to lack of reproducibility and long post processing times. Semi-automated approaches, such as centerline based analysis (plane placement) paired with k-means clustering (vessel segmentation) help reduce processing time and increase reproducibility.1 Here we expand on this work by implementing a fully automated flow quantification method that does not require vessel segmentation and corrects for potential background phase errors. We propose quantifying flow as a function of radial distance and using information in the surrounding tissue to correct background phase errors.Methods
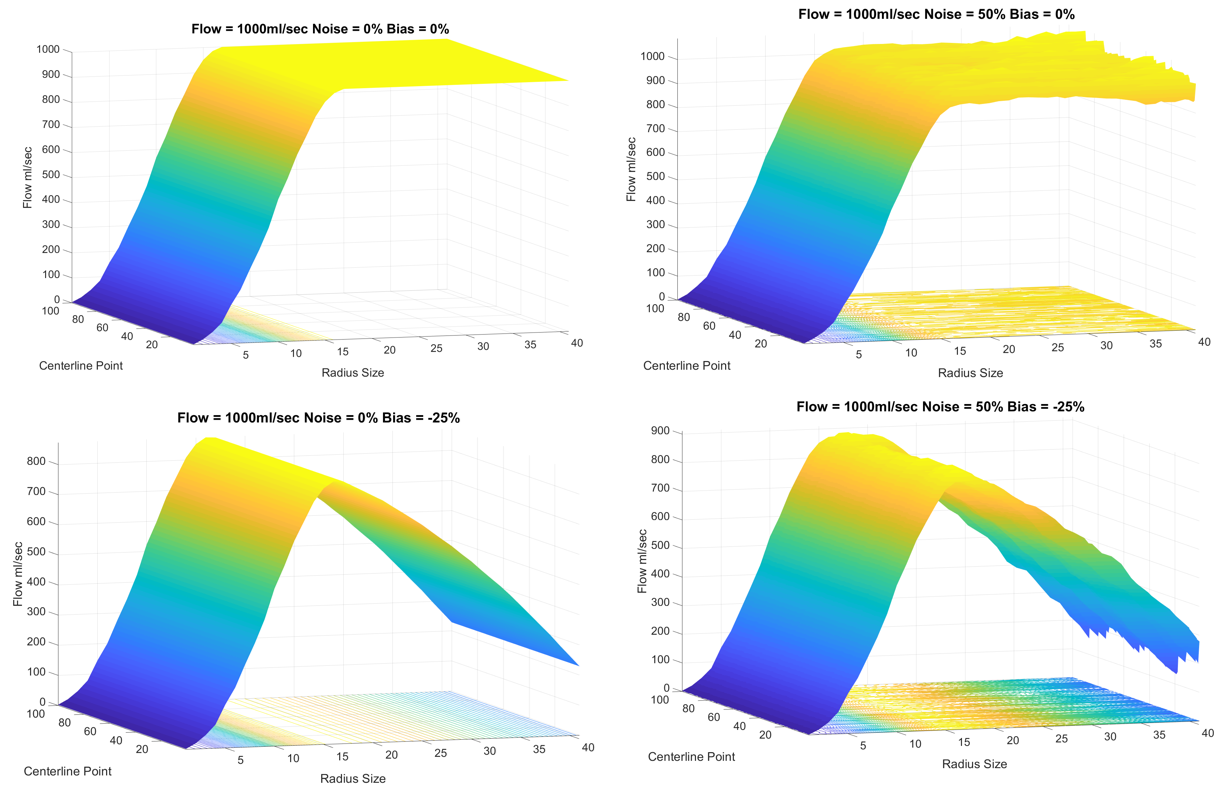
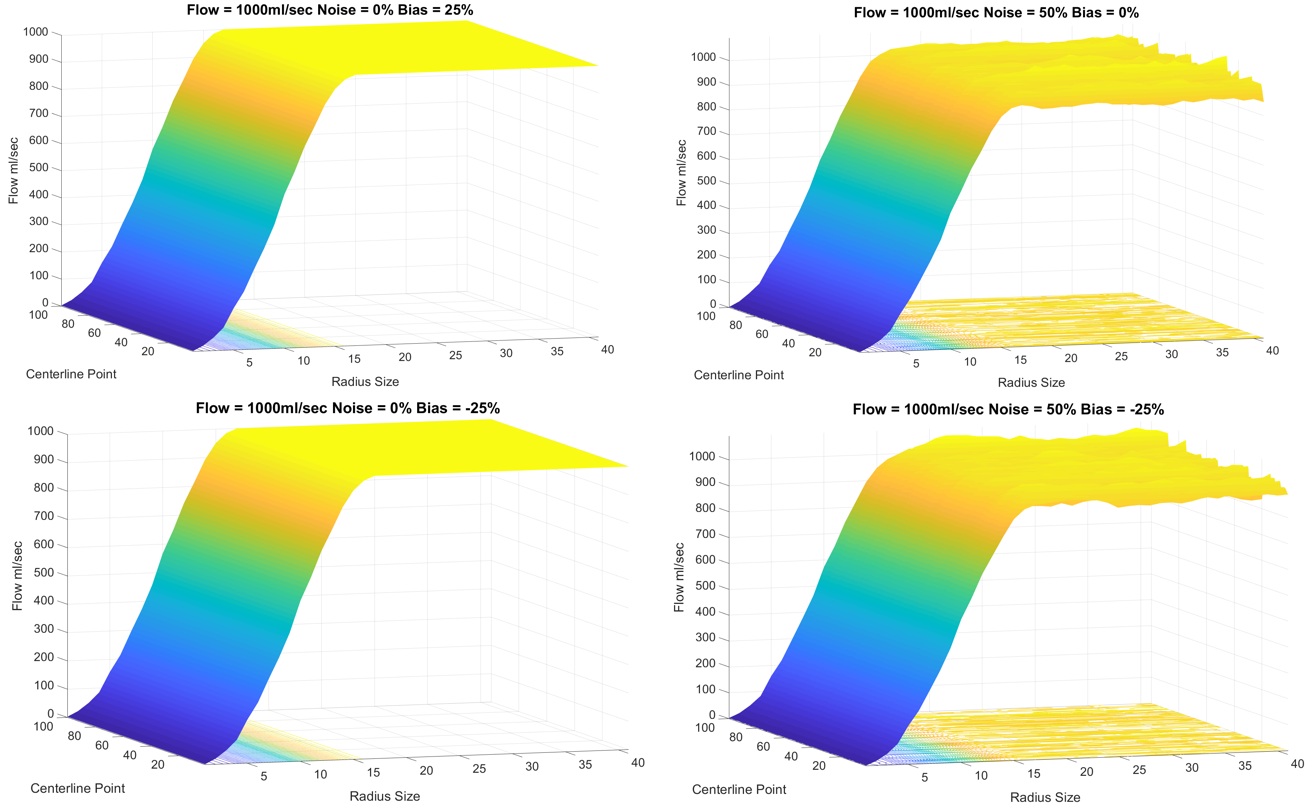
Concept: The proposed segmentation free algorithm starts with a centerline calculation2. A disc is grown perpendicular and outward to the centerline and analyzed for through-plane flow as diameter increases. In an ideal scenario, without noise and background phase, the flow calculated as a function of diameter will become constant once the disc completely contains the vessel as all non-vessel voxels have zero velocity. The best estimation of flow is then identified as the diameter from which flow plateaus. If noise is randomly distributed and no phase bias is present, then flow will still stabilize. However, if a bias is present from residual background phase, then the flow estimate will continue to increase or decrease. Therefore, we apply a bias correction method using an iterative numerical analysis approach, which estimates a background phase that optimizes the slope of flow as a function of diameter to zero.
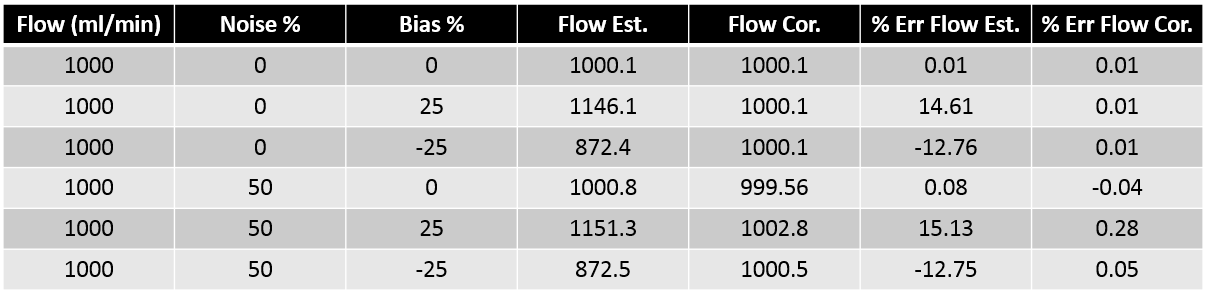
Numerical simulation: One hundred cross sectional velocity planes were generated to simulate a single branch in a vascular network. A ground truth flow of 1000 ml/min was used for all data sets. A positive and negative bias of 25% was used to simulate potential phase offsets seen in in-vivo data. Gaussian noise was combined at levels of 0 and 50% to test robustness to noise. Flow quantification was performed on all datasets with and without bias correction.
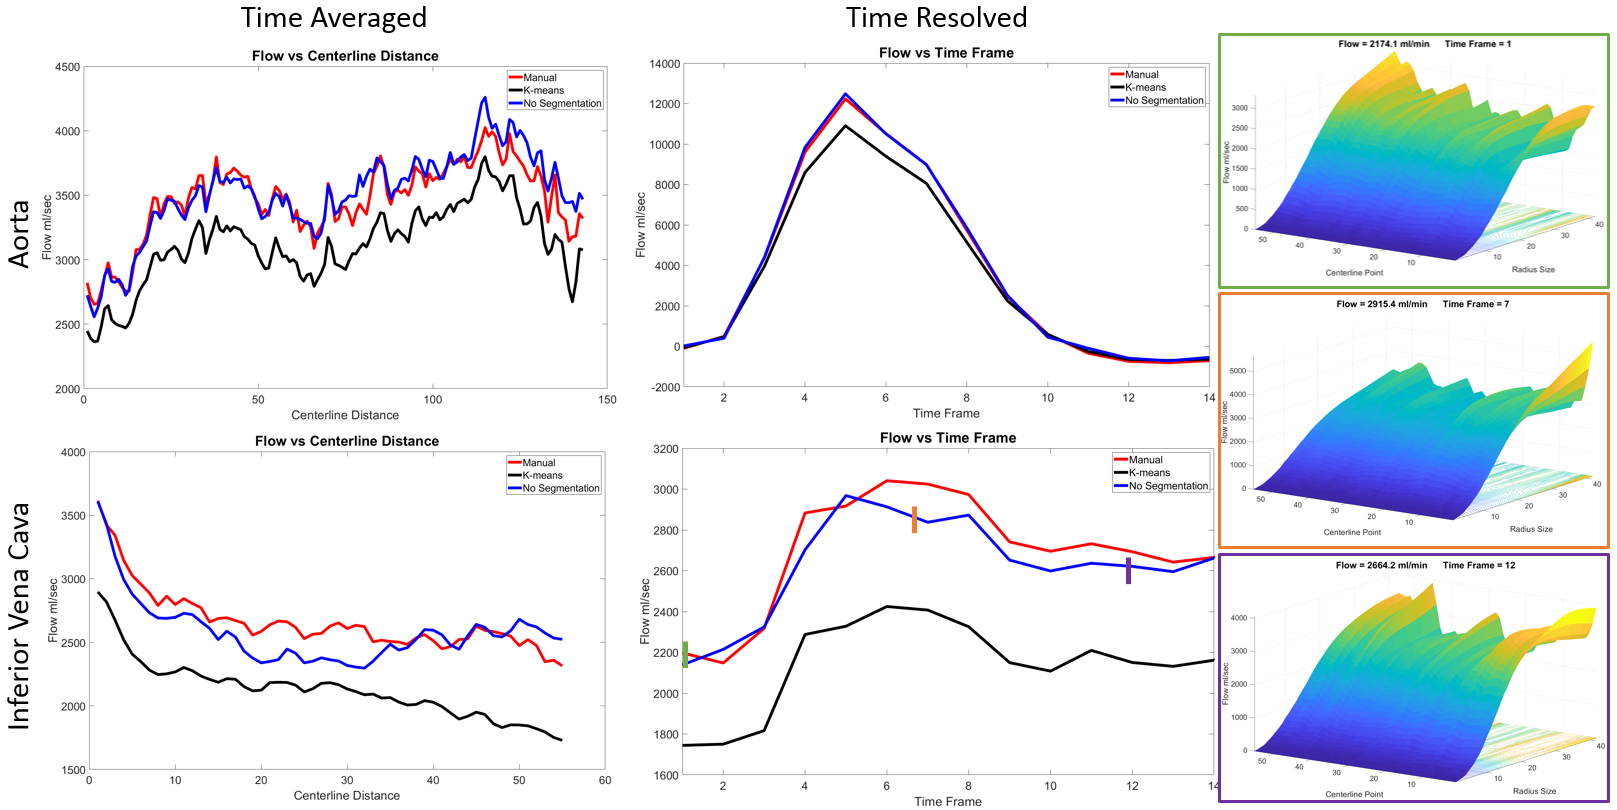
In Vivo Data: Cardiac and cranial scans were acquired on a clinical 3T scanner using 4D flow MRI with an under-sampled radial acquisition, PC VIPR3. Flow estimates in an arterial and venous segment were quantified: aorta(Ao) and inferior vena cava(IVC) in cardiac(FOV 32x32x32cm, res 1.25mm), right internal carotid artery (ICA) and right transvers sinus (TS) in cranial(FOV 22x22x22cm, res 0.69mm). Flow quantification was compared to the k-means method1 and manual segmentation. Flow values were calculated for both time averaged and time resolved datasets. All post processing and visualizations were performed with in-house software tools (MATLAB 2018a).
Results
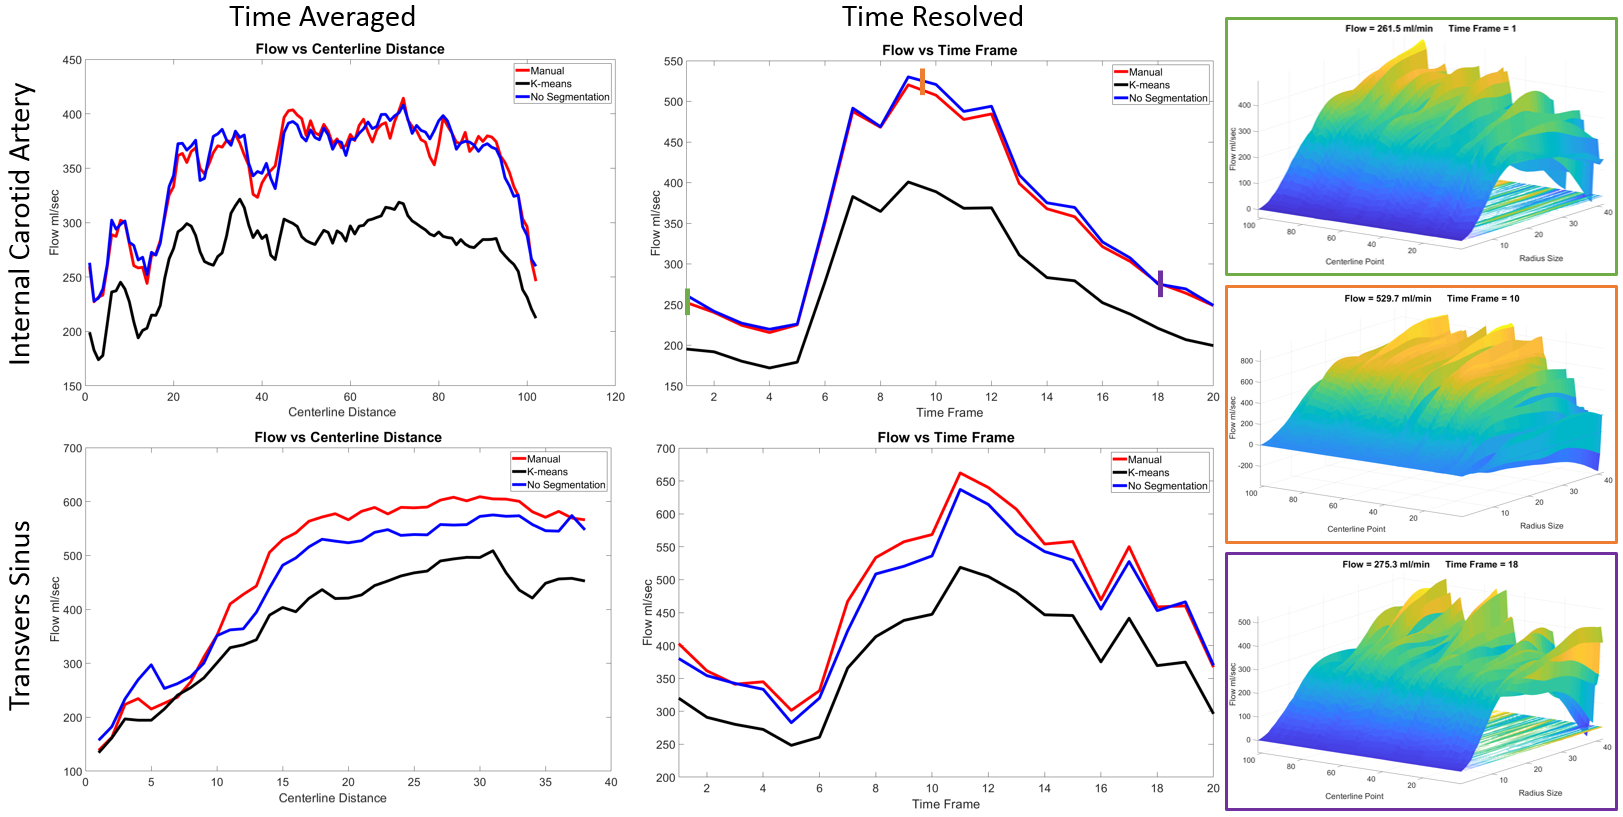
Flow values were computed within 15.1% of the ground truth without bias correction and within 0.08% with only noise present. The bias corrected method resulted in flow values with a maximum error of 0.28% for all variations of noise and bias (Figure 1). Visualizations of flow data vs radius and centerline points clearly show bias presence and correction (Figure 2 and 3). Compared to the manual segmentation, k-mean clustering percent difference (Cardiac: Ao=10.0%, IVC=20.3%; Cranial: ICA=21.8%, TS=20.4%) was larger than the proposed ‘no segmentation method’(Cardiac: Ao=-2.17%, IVC=2.90%; Cranial: ICA=-1.75%, TS=4.5%) for all scans and vessels of interest.. Flow variations over the cardiac cycle and centerline point locations followed similar trends for all methods (Figure 4 and 5).Discussion
The fully automated method without segmentation flow values agreed with manual segmentation results for both time resolved and time averaged data, while k-means seemed to have a global underestimation in flow for individual time frame analysis. This underestimation in flow is thought to be caused by too aggressive segmenting in noisy time frames and could be corrected by weighting input k-means data. The algorithm with no segmentation showed a more consistent flow for venous vessels than compared to arterial. Visualization of the flow values as a surface plot allows for easy interpretation of variations in flow and can help identify potential sources of error (e.g. bias, other vessels).Conclusion
In this study, a segmentation free algorithm with time resolved flow quantification with correction for local phase offsets was introduced. The fully automated flow quantification method was shown to be applicable in in-silico and in-vivo settings for venous and arterial vessel segments with variations in sizes, shape, and velocities. The new method may allow us to further decrease the time involved in 4D flow processing and increasing the agreement with manually segmented results. Potential failure modes such as close proximity to adjacent vessels or large gradients in background phase will require further investigations.Acknowledgements
No acknowledgement found.References
1) Schrauben, Eric, et al. "Fast 4D flow MRI intracranial segmentation and quantification in tortuous arteries." Journal of Magnetic Resonance Imaging 42.5 (2015): 1458-1464.
2) Palágyi KS, Balogh E, Kuba A, Halmai Cs, Erdôhelyi B, Hausegger K. A sequential 3D thinning algorithm and its medical applications. In: Proc 17th Int Conf Information Processing in Medical Imaging, IPMI 2001. Davis, CA; 2001.
3) Johnson, K. M. et al Magnetic Resonance in Medicine. 2008; 60(6), 1329-1336.
Figures