1960
Valvular flow imaging in the era of feature-tracking: Pilot study to measure mitral flow1Department of Clinical Physiology, Lund University, Skane University Hospital, Lund, Sweden, 2Department of Biomedical Engineering, Lund University, Faculty of Engineering, Lund, Sweden, 3Wallenberg Center for Molecular Medicine, Lund University, Lund, Sweden, 4Department of Radiology & Biomedical Imaging, Yale School of Medicine, Yale University, New Haven, CT, United States, 5Department of Cardiology, Yale School of Medicine, Yale University, New Haven, CT, United States
Synopsis
Magnetic resonance imaging of the mitral valve is challenging since the valve moves in and out of the image plane during the cardiac cycle. To more accurately measure mitral flow, a phase contrast sequence that uses offline feature-tracking of the valve in the long-axis view is proposed. The tracking result is exported to the scanner, allowing the slice position to change in real-time based on the cardiac phase.
The slice-following sequence outperformed the conventional sequence when quantifying regurgitant volumes. Hence, the new sequence is a promising method for improving the accuracy of trans-valvular flow.
Introduction
Accurate measurement of blood flow through the mitral valve has many clinical applications, such as quantifying mitral regurgitation1 and determining diastolic flow parameters2. Magnetic resonance imaging (MRI) is capable of measuring blood flow using phase contrast (PC), and recent studies advocate MRI as more accurate than echocardiography for diagnostic assessment prior to mitral valve repair surgery3. There is also an increasing awareness of the importance of evaluating diastolic function, which relies on mitral valve flow parameters E and A, due to its role in diseases such as atrial fibrillation and heart failure4.
Mitral imaging is impacted by the moving valvular plane, meaning that an imaged short-axis slice will not depict the same tissue in all timeframes over the cardiac cycle. An early approach to this known challenge used a spin labeling sequence to determine the valvular slice plane displacement, which was employed for prospective slice-following with 2D PC5. More recent work employed 4D flow measurement, which can be analyzed in the moving valvular plane, based on retrospective tracking6. However, in this era of improved feature-tracking, we propose a retrospectively ECG-gated 2D PC sequence with prospective slice-following. The valve plane location is determined by feature-tracking in long-axis cine7, and the displacements are prospectively employed during the scan for slice-following.
Methods
Thirteen healthy controls were imaged at two different sites and imaged on a 1.5T or 3T Siemens scanner. Nine subjects had good data quality and were included. A retrospectively gated 2D gradient echo cine sequence was imaged over the mitral valve in the short-axis view using both static and slice-following imaging. The slice-following plane was planned in the basal left ventricle (LV) at end-diastole, while the static plane was planned at end-systole to ensure that the LV is depicted in all timeframes.
Scan parameters for retrospectively ECG-gated PC were: 2D single breath-hold GRE, with VENC=150cm/s, TR/TE/θ=5.2ms/2.9ms/15°, matrix size 192x160, FOV 360mm, voxel size 2.2x2.2x8mm, 4 bipolar pairs per phase and 42ms temporal resolution. A 4-chamber cine was acquired with temporal resolution and phases matched to the PC sequence. Additionally, a short-axis cine stack and 2D PC images of the aortic root (through-plane flow encoding) were acquired and analyzed.
Slice-following was obtained by exporting the 4-chamber to offline for feature-tracking in the software Segment7,8. The resulting mitral valve displacement was saved to a file accessed by the PC sequence. Within the sequence, the slice location was changed in real-time based on the cardiac phase. Figure 1 shows a schematic overview of the scanning procedure.
Mitral regurgitant volume quantification: The accuracy of mitral valve flow was assessed by measuring mitral regurgitant volumes. Regurgitant volumes were quantified in two ways. First, according to the current guidelines9 by subtracting stroke volume (SV) measured by PC in the aortic root from SV measured by planimetry on the short-axis cine stack. Second, by subtracting the volume of the inflow to the LV measured with the proposed sequence from the SV in the aortic root. The second quantification method was performed using slice-following PC as well as conventional (static) PC. Figure 2 shows an example of a short-axis cine and an aortic PC image used to quantify mitral regurgitation according to current guidelines.
Results
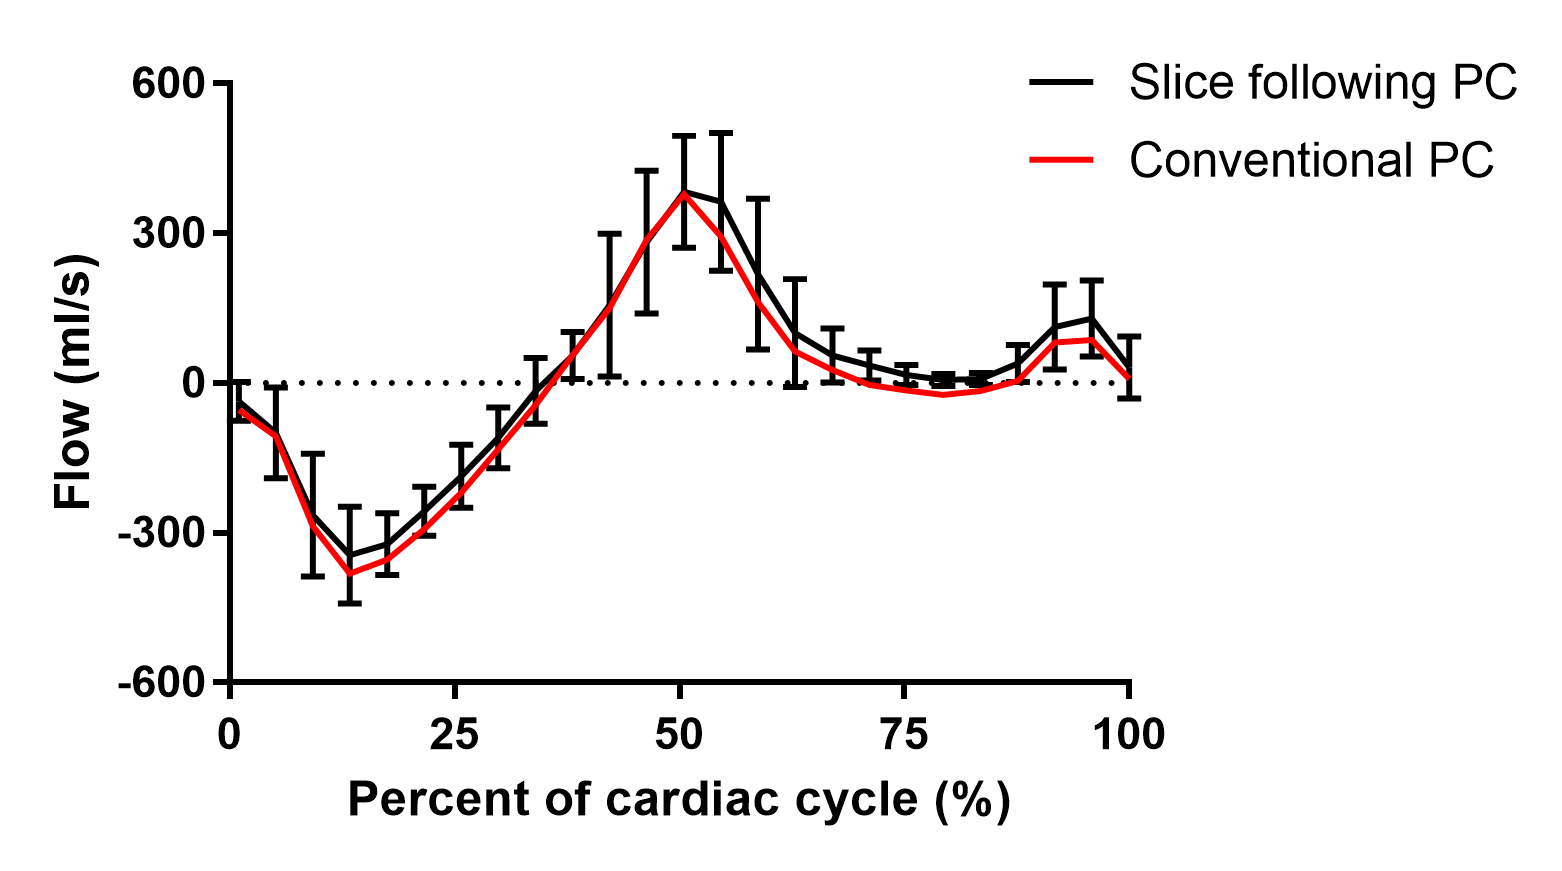
An animated illustration of the slice-following and static image planes are shown in Figure 3. Figure 4 shows the mean quantified flow curves, averaged over all subjects. Comparison of regurgitant volumes using the current guidelines and the proposed method is shown in Figure 5, disclosing a strong agreement and low bias for slice-following PC but not for conventional PC.
Quantified values for regurgitant volumes were 20.3±2.3 ml using planimetry, 19.3±2.7ml using slice-following PC, and 31.8±19.7ml using conventional PC. Regurgitant fractions (regurgitant volume as a percentage of SV) were 17.1±1.2% using planimetry, 16.3±1.5% using slice-following PC, and 26.7±16.8% using conventional PC. Average SV measured in the short-axis cine was 118.9±13.2ml.Discussion
Slice-following PC from offline feature-tracking of the mitral valve is feasible. Using slice-following PC, the quantification of regurgitant volumes agreed well with the established method and to previously reported values10,11. With conventional PC, the regurgitant volume was overestimated (bias 11ml), according to previously reported results (bias 25ml)11. This suggest that the slice-following sequence is better suited than a static image plane when measuring valvular flow.Conclusion
A slice-following 2D phase-contrast sequence that follows the mitral valve throughout the heartbeat has been developed. The method outperforms conventional static PC in accurately quantifying regurgitant volumes. Hence, the sequence is a promising method for improving the accuracy of trans-valvular flow.Acknowledgements
This work was in part supported by the 2017 ISMRM Research Exchange Program.References
1. Baumgartner et al. 2017 ESC/EACTS Guidelines for the management of valvular heart disease. Eur Heart J. 2017 Sep 21;38(36):2739-2791.
2. Nagueh et al. Recommendations for the Evaluation of Left Ventricular Diastolic Function by Echocardiography: An Update from the American Society of Echocardiography and the European Association of Cardiovascular Imaging. Eur Heart J Cardiovasc Imaging. 2016 Dec;17(12):1321-1360.
3. Uretsky et al. Discordance between echocardiography and MRI in the assessment of mitral regurgitation severity: a prospective multicenter trial. J Am Coll Cardiol. 2015 Mar 24;65(11):1078-88.
4. Rosenberg et al. Diastolic dysfunction and risk of atrial fibrillation: a mechanistic appraisal. Circulation. 2012 Nov 6;126(19):2353-62.
5. Kozerke et al. Heart motion adapted cine phase-contrast flow measurements through the aortic valve. Magn Reson Med. 1999 Nov;42(5):970-8.
6. Westenberg et al. Mitral valve and tricuspid valve blood flow: accurate quantification with 3D velocity-encoded MR imaging with retrospective valve tracking. Radiology. 2008 Dec;249(3):792-800.
7. Seemann et al. Time-resolved tracking of the atrioventricular plane displacement in Cardiovascular Magnetic Resonance (CMR) images. BMC Med Imaging. 2017 Feb 28;17(1):19.
8. Heiberg et al. Design and validation of Segment--freely available software for cardiovascular image analysis. BMC Med Imaging. 2010 Jan 11;10:1.
9. Schulz-Menger et al. Standardized image interpretation and post processing in cardiovascular magnetic resonance: Society for Cardiovascular Magnetic Resonance (SCMR) board of trustees task force on standardized post processing. J Cardiovasc Magn Reson. 2013 May 1;15:35.
10. Kawel-Boehm et al. Normal values for cardiovascular magnetic resonance in adults and children. J Cardiovasc Magn Reson. 2015 Apr 18;17:29.
11. Westenberg et al. Accurate quantitation of regurgitant volume with MRI in patients selected for mitral valve repair. Eur J Cardiothorac Surg. 2005 Mar;27(3):462-6.
Figures