1959
Wearable Seismocardiography as a Quick Screen for Thoracic Aorta Flow Abnormalities Necessitating 4D Flow MRI1Biomedical Engineering, Northwestern University, Evanston, IL, United States, 2Anesthesiology, Northwestern University, Chicago, IL, United States, 3Radiology, Northwestern University, Chicago, IL, United States, 4Radiology, University of Colorado, Anschutz Medical Campus, Aurora, CO, United States
Synopsis
Seismocardiography, the measurement and analysis of forces and accelerations from the beating heart that propagate through the chest wall, can yield insights about cardiac and hemodynamic health. In subjects with pathological or deranged blood flow in the thoracic aorta, the characteristics of SCG accelerations change as a result of the altered flow. Here, we use 4D flow MRI to investigate the specific SCG changes that are associated with abnormal aortic flow, and we consider the potential to use SCG as a quick screen for need of a comprehensive 4D flow MR examination.
Introduction
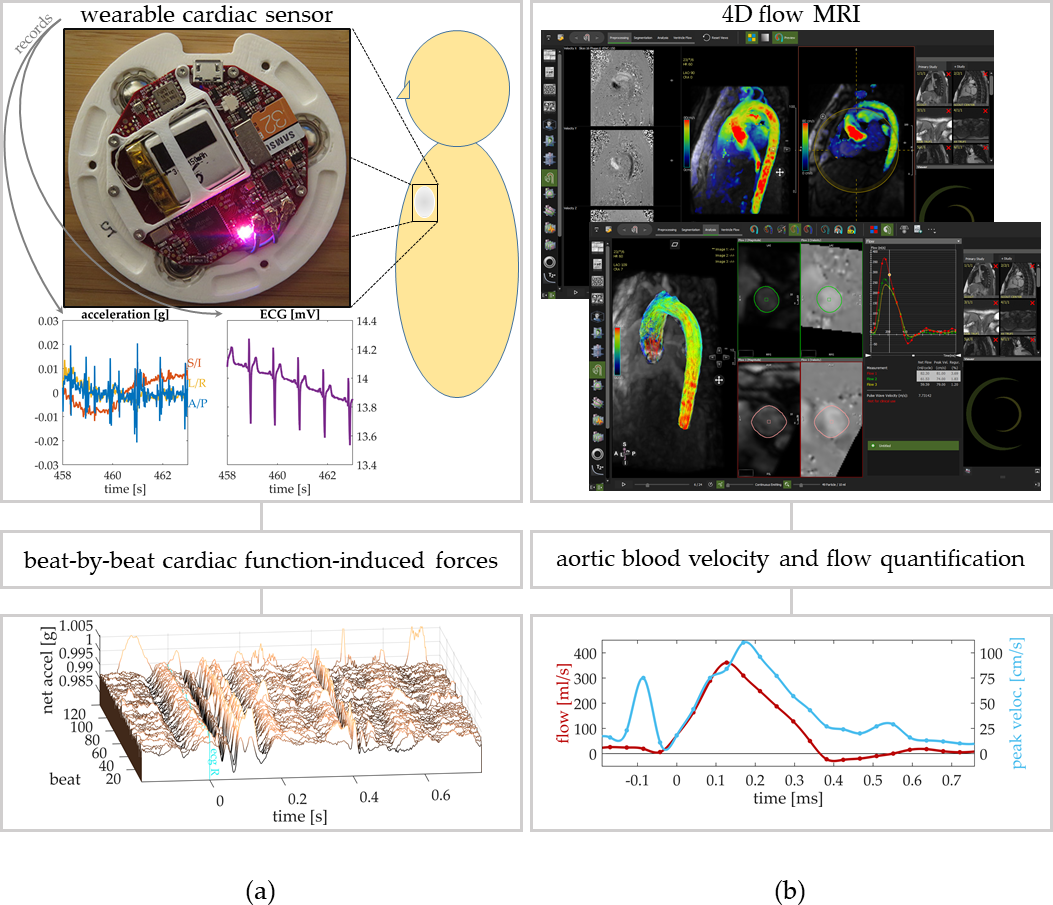
During normal cardiac cycles, mechanical forces emanating from the beating heart and pulsatile aortic blood flow transmit through the chest wall. Components of these forces are detectable outside the body, which is well known, as evidenced by stethoscope usage. A full force-spectrum can be recorded by external chest-acceleration measurements from sensors in a wearable device placed on the torso, providing continuous measurement of 3-directional chest-wall acceleration and ECG voltage. From these, a seismocardiogram (SCG) signal[1,2] can be formed, characterizing cyclic reverberations from cardiac function and flow (Fig.1a).
Thoracic aorta flow can be directly measured and visualized by time-resolved three-dimensional phase-contrast (4D flow) MRI (Fig.1b)[3]. These techniques provide clinically valuable information in many contexts, e.g., interrogating flow abnormalities from aortic valve disease. However, MR scans and 4D flow analysis can incur significant costs from scanner usage and computationally-demanding analysis.
We hypothesize that flow abnormalities have detectable SCG manifestations. To investigate, we chart normal SCG signal ranges referenced to 4D flow MRI metrics in a healthy-control cohort. We extend this comparison to subjects with bicuspid aortic valve (BAV) disease and known aortic flow abnormalities, delineating the impact upon SCG signal characteristics of BAV-mediated flow aberrations. This investigation suggests the possibility of using wearable SCG-recording devices to acquire SCG power 'heat maps' as a low-cost, sensitive test—a quick screen—for flow pathologies.
Methods
Data Collection: SCG and 4D flow data were collected from 21 healthy subjects (ages 54y±18y;10 females) as a normal cohort dataset and from 3 patients with documented BAV disease (ages 63,72,79;1 female). Immediately prior to MRI, the supine SCG was recorded by wearable cardiac sensor (Fig.1a). MR exams (1.5T/Aera/Siemens/Germany), included 4D flow (2.4mm3; 30–40ms/frame; 150–200cm/sVENC) covering the thoracic aorta (Fig.1b) and short-axis CINE-SSFP (1.9mm2×6mm; 25frames/heartbeat) covering the left ventricle (LV) base–apex.
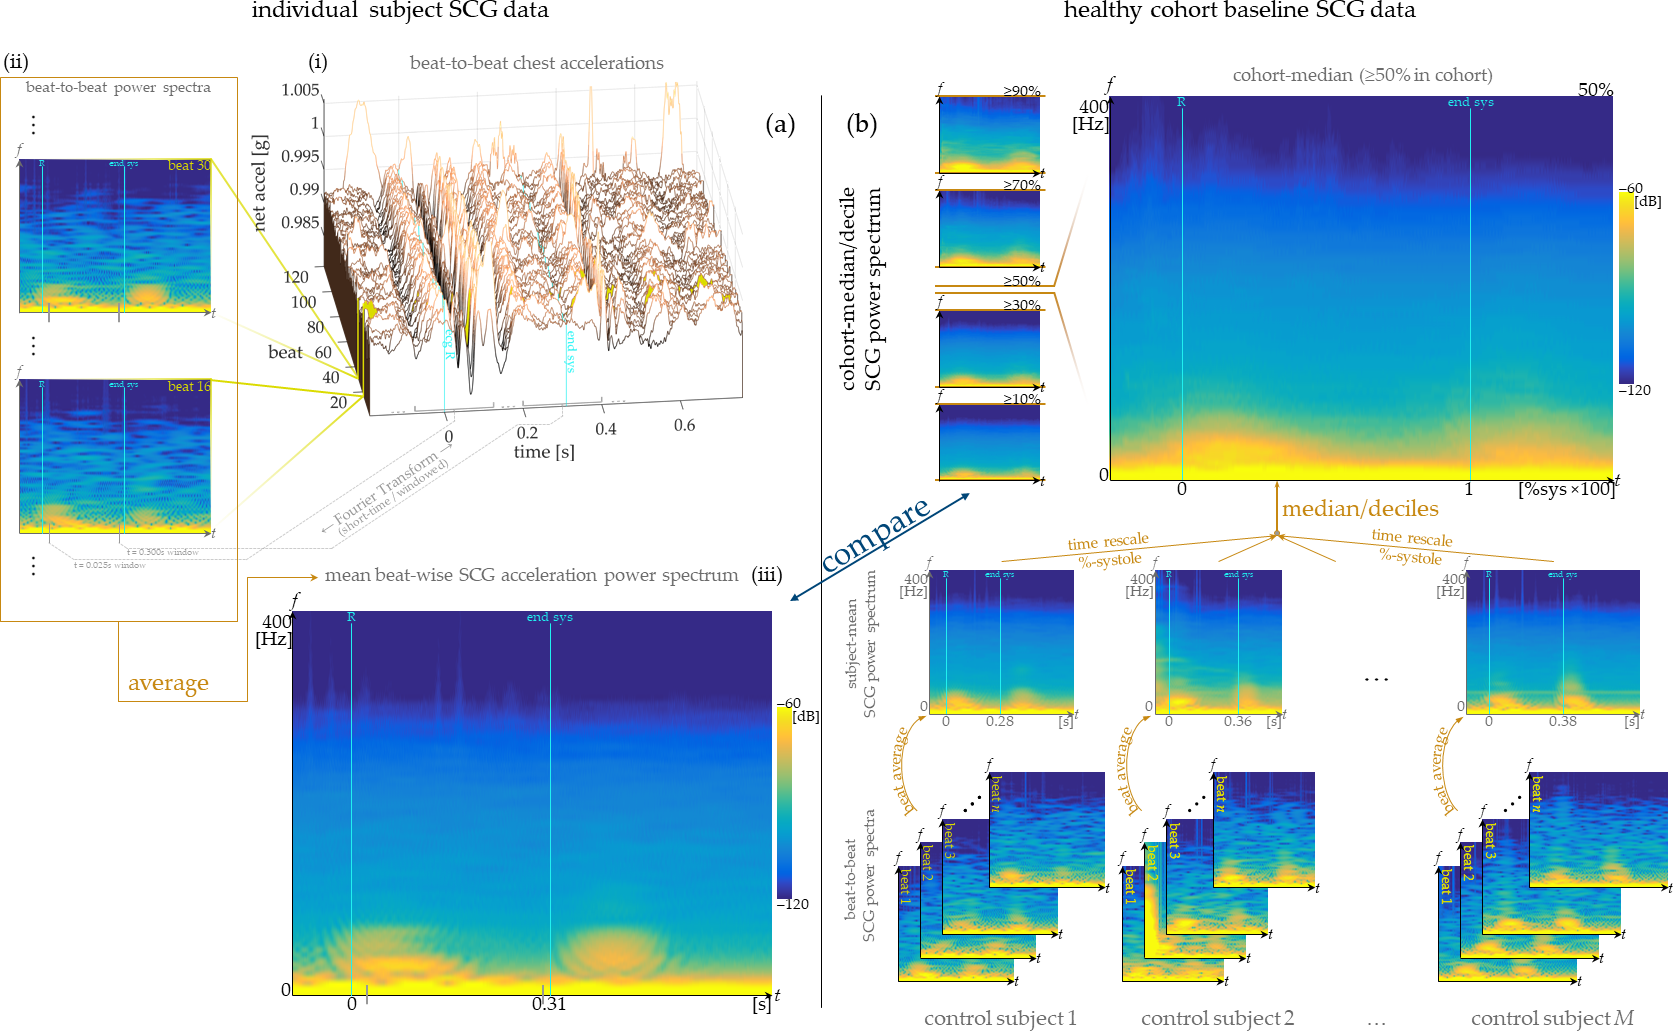
Data Processing: Each subject's SCG was formed by time-referencing acceleration measurements to R-waves in simultaneously-acquired ECG, for beat-to-beat synchronization (Figs.1a,2a). From beat-synchronized net accelerations, time-varying spectral power density (Short-Time Fourier Transform; 0.2s Hamming window) in each heartbeat was computed (Fig.2a,ii). Finally, individual-beat spectra were averaged over all heartbeats (Fig.2a,iii), forming the subject-specific SCG signal. MR images were analyzed (cvi42/Circle/Canada), calculating blood velocities from 4D flow images (Fig.1b) and annotating end-systole (minimum LV volume) in CINE images. Flow metrics were computed in a 2D cut-plane of the proximal ascending aorta, with frame-by-frame-defined ROI. Pathline visualizations were generated within a 3D segmentation.
Normal-Cohort Analysis: SCG and MRI signals were aggregated across the full cohort of healthy individuals. Statistics (median and decile ranges) for SCG power spectra and MRI metrics were computed to derive normal ranges of each measurement. For dynamic medians and quantiles for each parameter, the time scale of each subject's cardiac cycle was normalized to end-systole (time=0 — ECG R-wave; time=1 — end-systole).
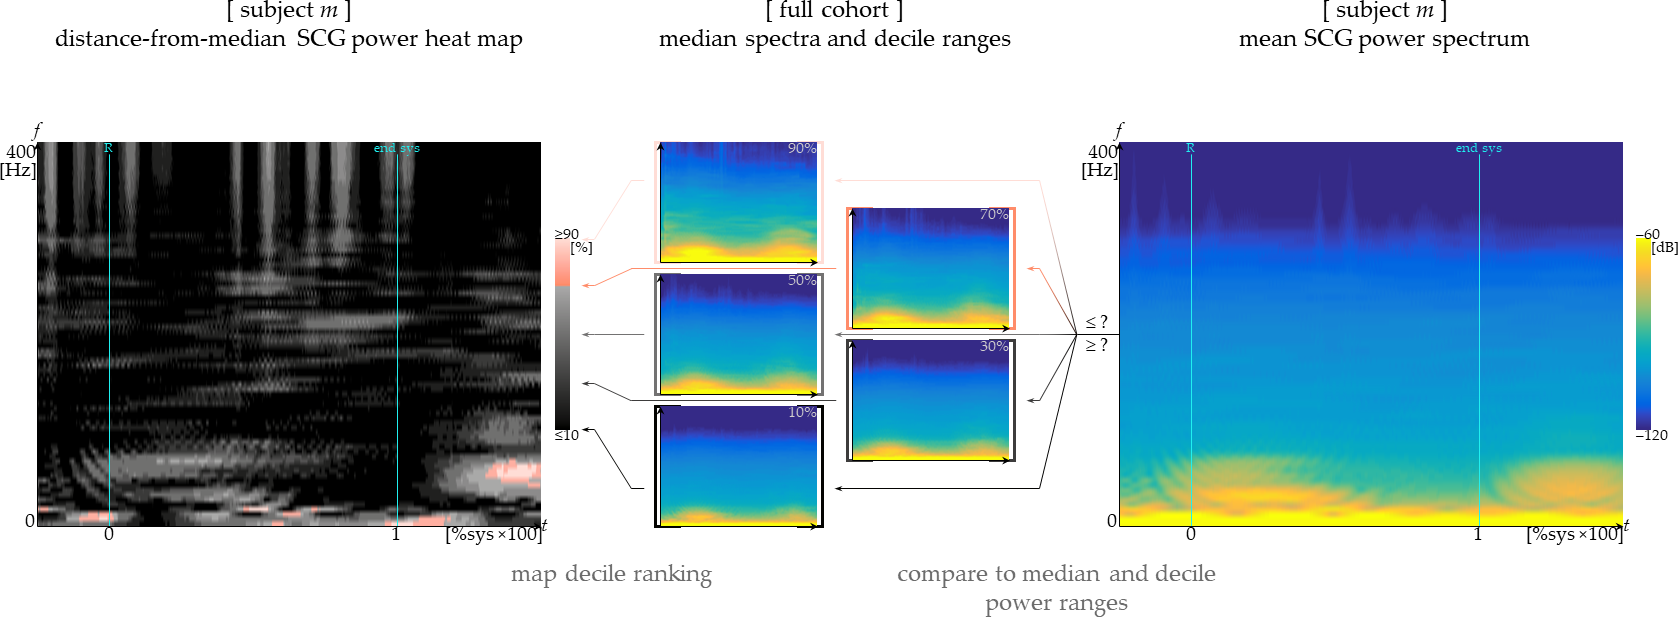
Comparative Analysis: SCG and MRI analysis for BAV patients and one randomly-selected control were completed and compared to the normal-cohort statistics. SCG power-spectra heat maps were assembled, showing cohort-relative decile rankings at each time/frequency (Fig.3).
Results
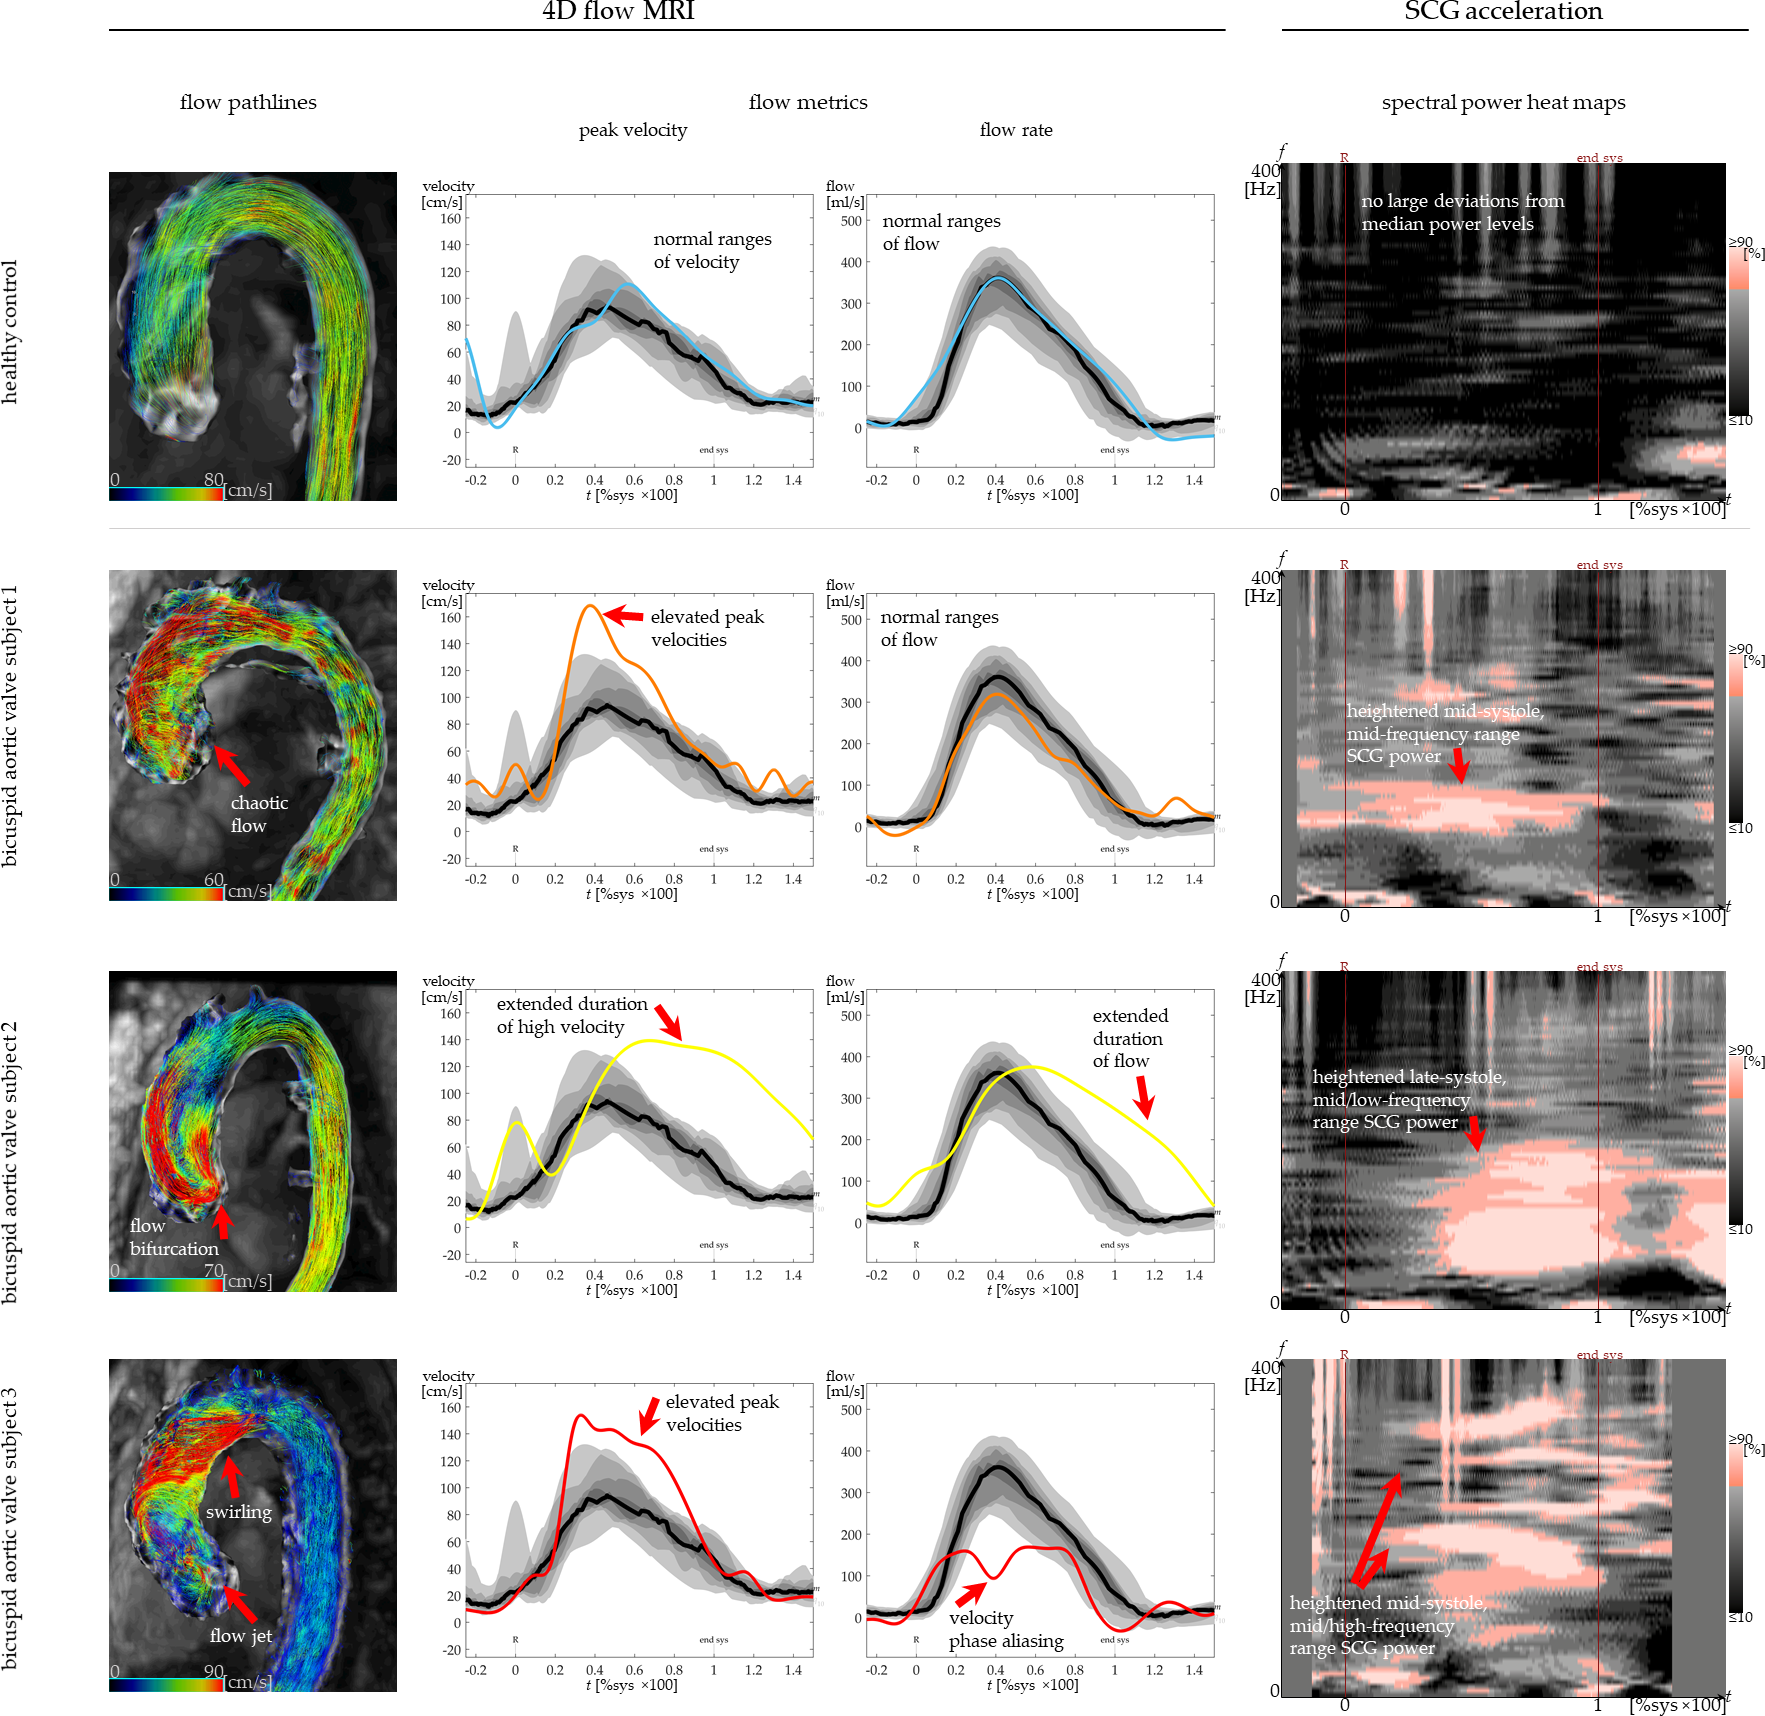
Normal flow metrics ranges were established from healthy-subject cohort data (Fig.4). Maximal median flow rate is 360ml/s at 0.4 systole duration; 7th-to-3rd decile spread is 110ml/s. Maximal median peak velocity is 94cm/s at 0.45 systole duration, with 7th–3rd decile distance 20cm/s. In BAV-patient quantifications, deviations above these ranges are observed (Fig.4)—e.g., mid-systole peak velocities exceeding 120cm/s, the 9th-decile range. Corresponding qualitative flow characteristics are depicted by pathline visualizations.
Heat maps of BAV-subject SCG spectra deviate upward from the baseline power amplitudes in particular frequency and time ranges. Each subject's SCG spectral power in the 100–200Hz range during mid-/late-systole is above the normal cohort's 9th decile (Fig.4). Power deviations at other frequencies are also observed, particular to each BAV subject's flow characteristics. The observed SCG power abnormalities correspond in time with flow deviations shown by 4D flow for each BAV subject. The healthy control subject has no comparable regions of elevated SCG power levels.
Discussion
Correspondences between SCG spectral heat maps and MRI-depicted flow abnormalities indicate SCG measurement offers an intriguing, possibly complementary dimension of hemodynamics observation, particularly for detecting blood flow abnormalities. Cardiac function produces detectable reverberations; when functional aspects are changed, such as BAV-induced turbulent flow, correspondingly different chest wall accelerations are shown in SCG. Modern electronics make sensing of SCG signals feasible at low cost, with relative ease, so these correspondences suggest potential use of SCG as a quick screen for flow abnormalities.Conclusion
A relationship was observed between non-normative SCG power spectra in BAV patients and pathological aortic flow visualized by MRI. Further investigation with larger cohorts is needed to confirm this relationship. If confirmed, this implies an easy-to-acquire SCG recording could quickly assess potential value of comprehensive MR flow examination.Acknowledgements
This work was supported by the NIH and Hartwell Foundation.References
[1] Inan, Omer T., et al. "Ballistocardiography and seismocardiography: a review of recent advances." IEEE J. Biomedical and Health Informatics 19.4 (2015): 1414-1427.[2] Wiens, Andrew D., et al. "Toward continuous, noninvasive assessment of ventricular function and hemodynamics: Wearable ballistocardiography." IEEE journal of biomedical and health informatics 19.4 (2015): 1435-1442.
[3] Markl, Michael, et al. "4D flow MRI." Journal of Magnetic Resonance Imaging 36.5 (2012): 1015-1036.
Figures